1452
Age-related changes in brain morphology based on a large-scale MRI database of non-human primates
Mayu Iida1,2, Junichi Hata2,3,4, Yawara Haga1,4, Akiko Uematsu4,5, Fumiko Seki2,4, Daisuke Yoshimaru2,3,4, Kei Hagiya4, Hirotaka James Okano3,4, Hideyuki Okano4, and Takako Shirakawa1
1Department of Radiological Sciences, Human Health Sciences, Tokyo Metropolitan University Graduate School, Tokyo, Japan, 2Live Imaging Center, Central Institute for Experimental Animals, Kanagawa, Japan, 3Division of Regenerative Medicine, Jikei University School of Medicine, Tokyo, Japan, 4Laboratory for Marmoset Neural Architecture, Center for Brain Science, RIKEN, Saitama, Japan, 5Center of Evolutionary Cognitive Sciences, Tokyo University Graduate School, Tokyo, Japan
1Department of Radiological Sciences, Human Health Sciences, Tokyo Metropolitan University Graduate School, Tokyo, Japan, 2Live Imaging Center, Central Institute for Experimental Animals, Kanagawa, Japan, 3Division of Regenerative Medicine, Jikei University School of Medicine, Tokyo, Japan, 4Laboratory for Marmoset Neural Architecture, Center for Brain Science, RIKEN, Saitama, Japan, 5Center of Evolutionary Cognitive Sciences, Tokyo University Graduate School, Tokyo, Japan
Synopsis
MRI data of 204 large common marmoset colonies were obtained and analyzed regarding brain volume. Marmosets have a brain structure and nerve paths are similar to those in humans compared to other experimental animals. The volume from puberty to old age in six regions (gray matter, deep gray matter, white matter, brainstem, cerebellum, and CSF) could be evaluated. From the viewpoint of volume and variability when performing brain image analysis, it was suggested that marmosets are experimental animals that can evaluate the effects of individual differences at the same level as humans or with slightly less variation than humans.
Introduction
Non-human primates, such as common marmosets, have a brain structure and nerve paths are similar to those in humans compared to other experimental animals. They are therefore an experimental animal that is attracting attention in brain neuroscience research. However, it is not certain when marmosets become adults and when they have reached old age. In addition, the dispersion of their individual brain morphology compared to rodents when used as experimental animals needs to be determined. How is it compared to humans? There are many things that need to be clarified. Also, the number of individuals used in marmoset research is very small compared to human research. There are many studies that have targeted dozens of individuals. As with humans and other experimental animals, it is very important to evaluate a larger number of individuals in marmoset studies for statistical analysis of brain images. Within this context, in this study, MRI data of 200 large marmoset colonies were obtained and analyzed regarding brain volume. The purpose of this study was to evaluate the variations of individual marmosets in brain morphology, to understand individual differences in marmoset brains and to compare the results with humans and other experiment animals.Methods
All data were acquired with 9.4T MRI (Biospec 94/30) using a transmit and receiver coil and a conventional birdcage circuit, 86 mm (Bruker BioSpin, Ettlingen, Germany). The imaging parameters used in this study were Rapid Acquisition with Relaxation Enhancement (RARE), Contrast; T2WI (TR/TE : 4000/22 ms, FOV : 48 mm×48 mm, Image size : 128×128, Rare factor : 4, Pixel Resolution : 270μm, scan time : 7 min 24 sec). The subjects were 204 healthy common marmosets who were 0.8–11 years old (male 111, female 93). The segmentation was created using in the ANTS software package. This image was skull stripped, then segmented to produce template specific tissue priors. Specifically, the template was segmented into 5 tissue priors: gray matter (GM), deep gray matter (deepGM), white matter (WM), brainstem and cerebellum. The images were then processed using the antsCorticalThickness pipeline (ANTS), which extracts the brain, warps the tissue priors and segments the subject images into the five tissue images in subject space. ThresholdImage was used to calculate the amount of cerebrospinal fluid (CSF). Using ITK-SNAP (www.itksnap.org), volume measurements were made in the whole brain and six brain regions. The volume and dispersion of each brain region were compared and evaluated. This study was approved by the Animal Experiment Committees in RIKEN Brain Science Institute (BSI), and was conducted in accordance with the Guidelines for Conducting Animal Experiments of RIKEN BSI.Results
The whole brain volume showed a gradual decrease with age. The GM showed a clear volume reduction. The deepGM showed a gradual decrease that was similar to that of GM. There was no significant change in the WM. On the other hand, relative to the whole brain, it can be said that WM increases with age. The brainstem showed a slight increase, and there was no significant change in the cerebellum and CSF. The correlation between body weight and brain volume was also obtained.Discussion
In this study, from the acquired data, the volume from puberty to old age in the whole brain and six regions could be obtained and compared with previous research with a volume transition of marmosets and humans focusing on the stage of development. The peak volume in the GM was observed at the age of 5.3 months and subsequently declined by 20% by the age of 30 months. It is estimated that the decrease continues after this. The WM peak volume was observed at the age of 9.9 months, and the volume did not decline, but rather remained stable after reaching a peak plateau.1 From previous research results, we found that there is no contradiction, as we found a decrease in GM from the age of 1 in this study data and continuity with WM without a significant change. This suggested that common marmosets have little sex differences in brain volume between regions. It was suggested that marmosets are experimental animals that can evaluate the effects of individual differences with slightly less variation. The brainstem, cerebellum and CSF have not been calculated in common marmoset studies so far. In humans, GM volume decreases linearly between the ages of 20 and 70. The ratio of WM tends to consistently increase from youth (the age of 1–2 for marmosets) to old age.2,3 The volume of WM peaks in the 50s and then decreases slowly. The decrease in GM volume at a young age is due to pruning and myelination with development, but the decrease in GM after age 50 seems to reflect a decrease in neurons.Conclusion
In this study, we analyzed brain volume using large-scale MRI brain data of common marmosets. From these data, the volume from puberty to old age in six regions (GM, deepGM, WM, brainstem, cerebellum, and CSF) could be obtained and evaluated. From the viewpoint of volume and variability when performing brain image analysis, it was suggested that marmosets are experimental animals that can evaluate the effects of individual differences at the same level as humans or with slightly less variation than humans.Acknowledgements
This research is partially supported by the program for Brain Mapping by Integrated Neurotechnologies for Disease Studies (Brain/MINDS) from Japan Agency for Medical Research and development, AMED.References
- Seki F. Developmental trajectories of microanatomical structures in common marmoset brain. Neuroscience. 2017; 364:143-156.
- Fukuda H. Development and Aging of the Human Brain Structure and Global Network Pattern− Image Analyses of Brain MRI Database of Healthy Japanese. Journal of Tohoku Pharmaceutical university. 2013; 60:13−23.
- Taki Y. Correlations among Brain Gray Matter Volumes, Age, Gender, and Hemisphere in Healthy Individuals. 2011; PLoS ONE 6(7): e22734.
- Walhovd K. Effects of age on volumes of cortex, white matter and subcortical structures. Neurobiology of Aging 26. 2005; 1261–1270.
- Abbott Dh. Aspects of common marmoset basic biology and life history important for biomedical research. Comparative Medicine. 2003; 339-350.
- Hammelrath L. Morphological maturation of the mouse brain: An in vivo MRI and histology investigation. NeuroImage. 2016; 125:144–152.
- JA Scott. Longitudinal analysis of the developing rhesus monkey brain using magnetic resonance imaging: birth to adulthood. Brain Struct Funct. 2016; 221:2847–2871.
Figures
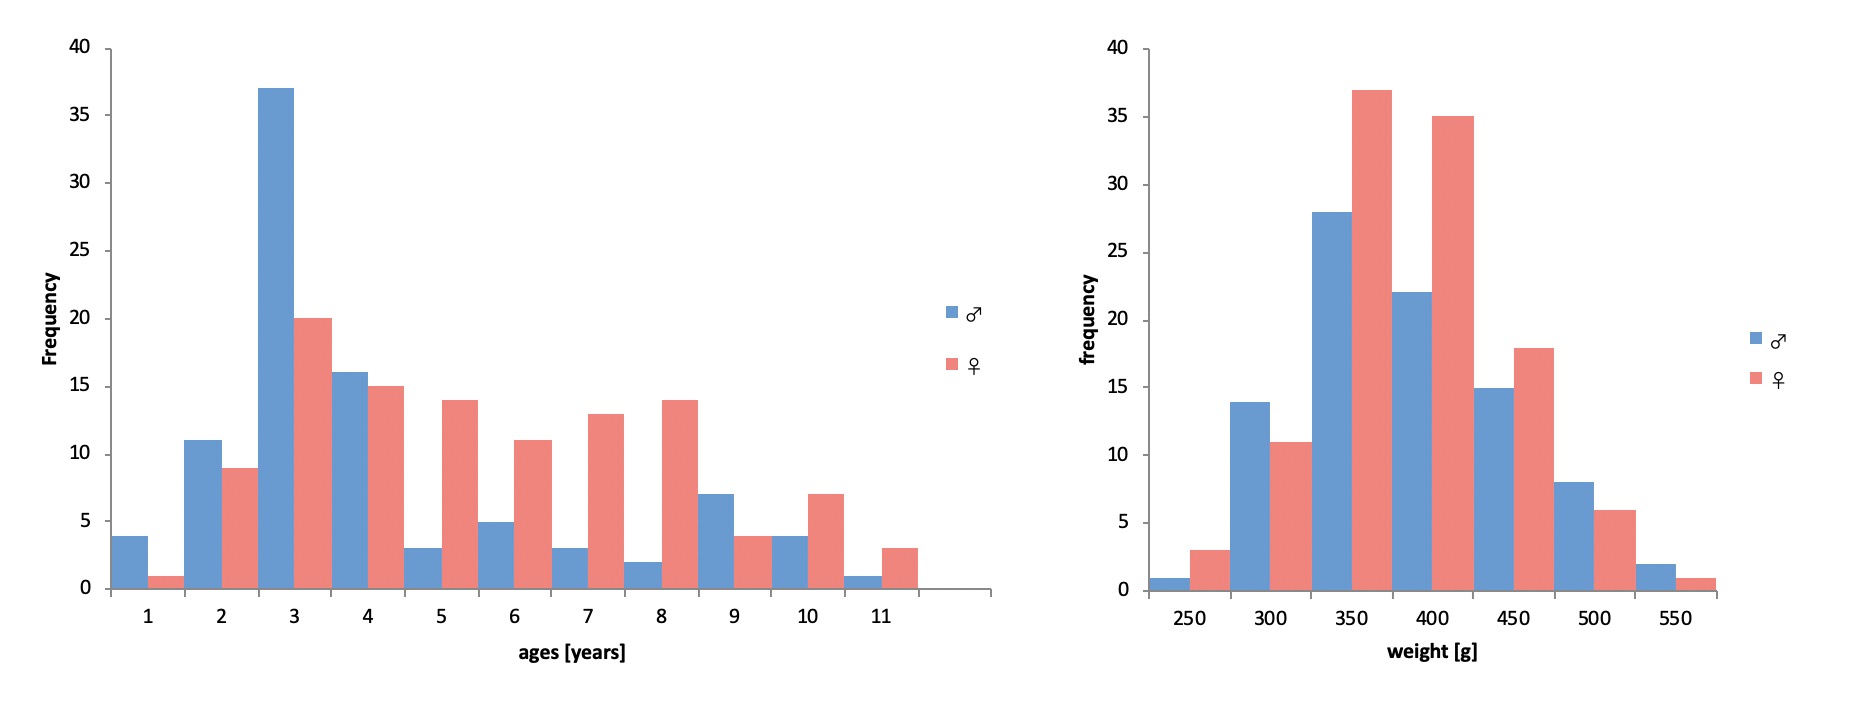
Here
is a histogram of ages and weight. There
is a total of 204 data. The left part of the figure presents ages and the right
part presents weight. The blue
bins are male, and the red bins are female.
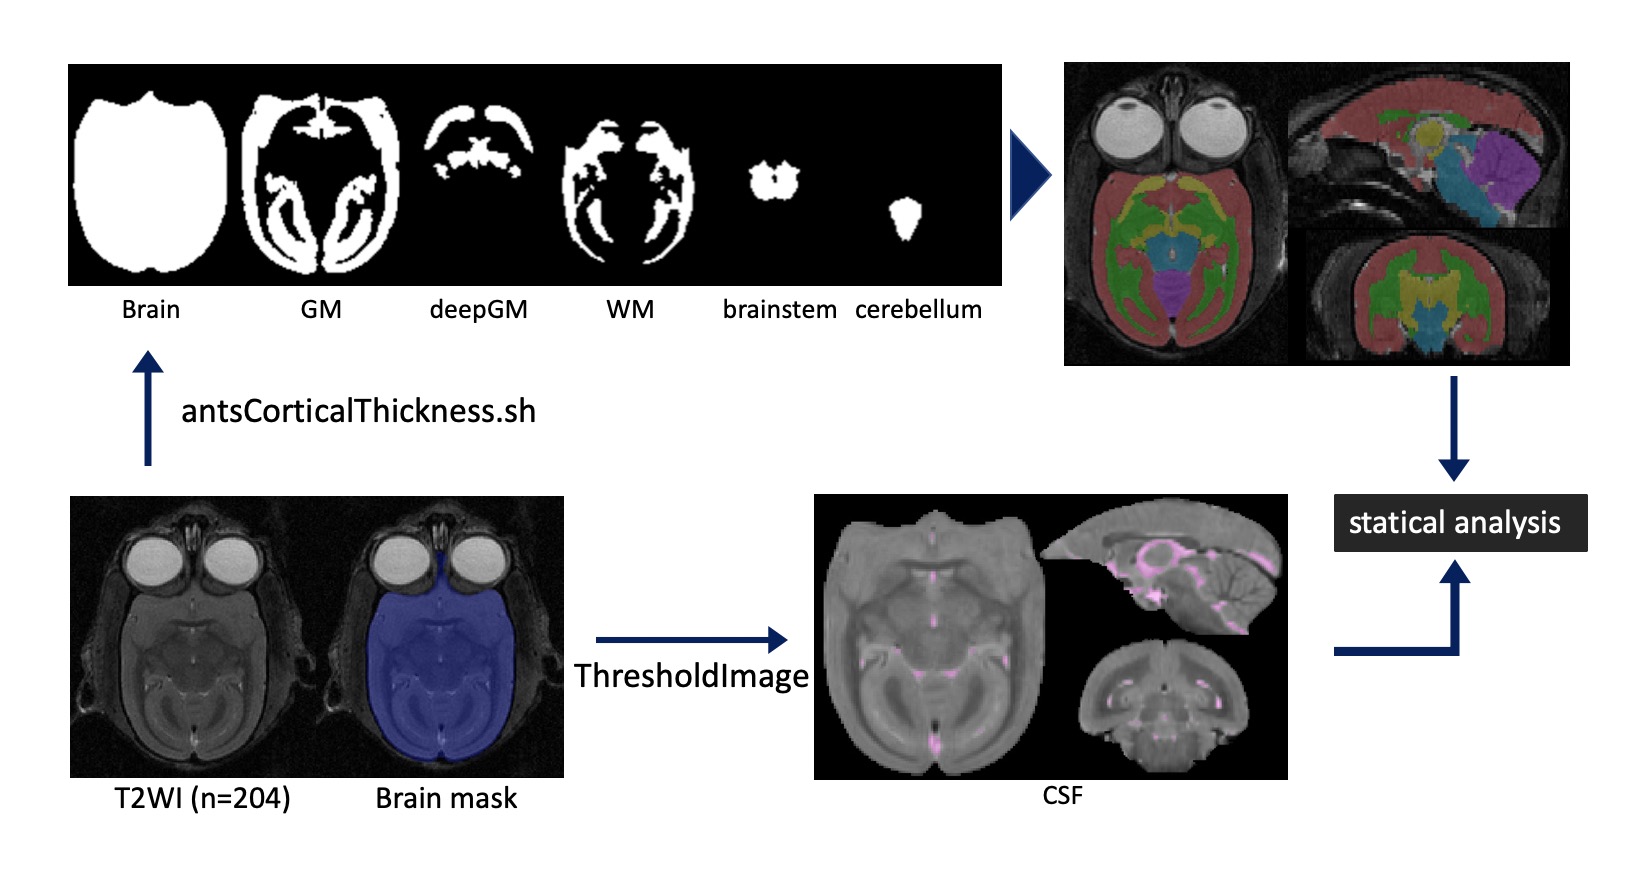
The
images were processed using the antsCorticalThickness pipeline, which segments
the subject images into the five tissue images: gray matter, deep gray matter,
white matter, brainstem and cerebellum. ThresholdImage
was used to calculate the amount of CSF.
Using ITK-SNAP, volume measurements were made in the whole brain and six brain
regions.
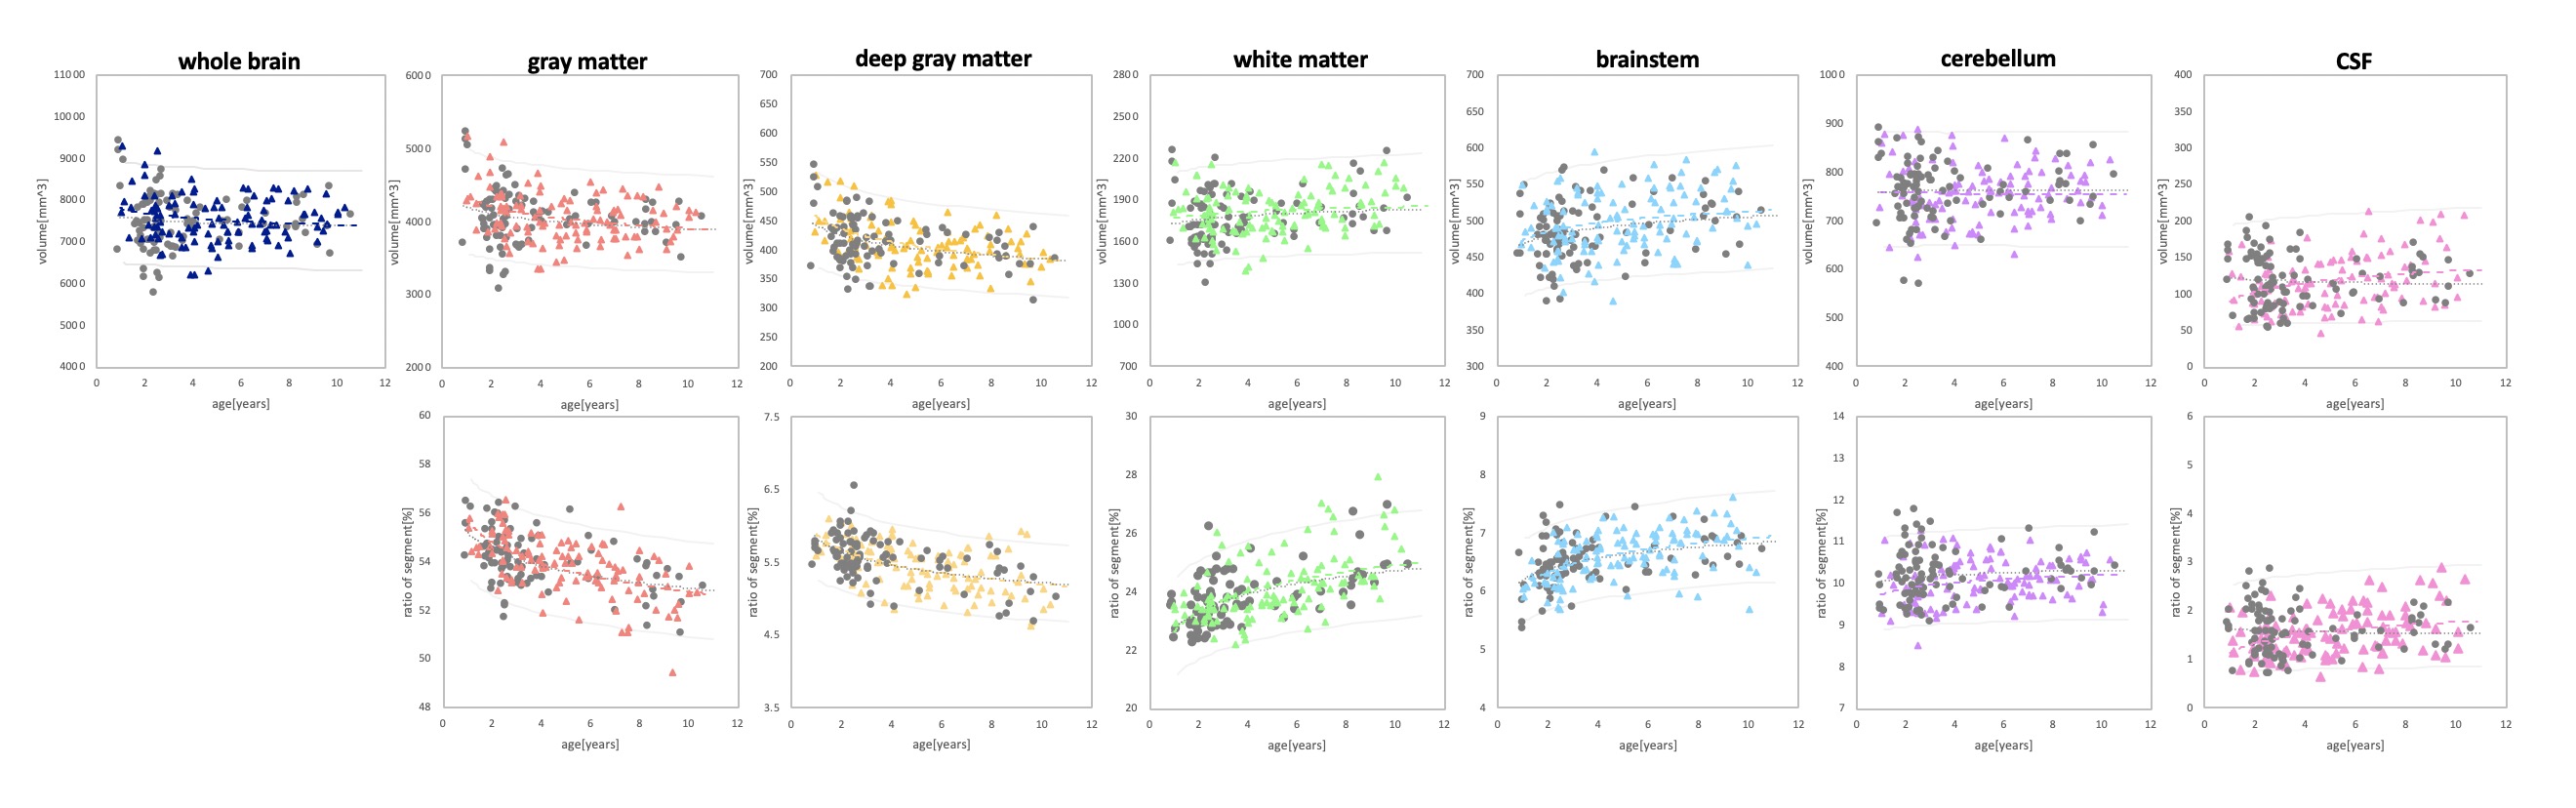
The upper part of the figure presents relationship
between age and volume, and the lower part presents between age and percentage
of the whole brain. The gray dots represent plot data of male, while
the colored triangle represent plot data of female. From the left, the images
are for the gray matter, deep gray matter, white matter, brainstem, cerebellum
and cerebrospinal fluid (CSF).
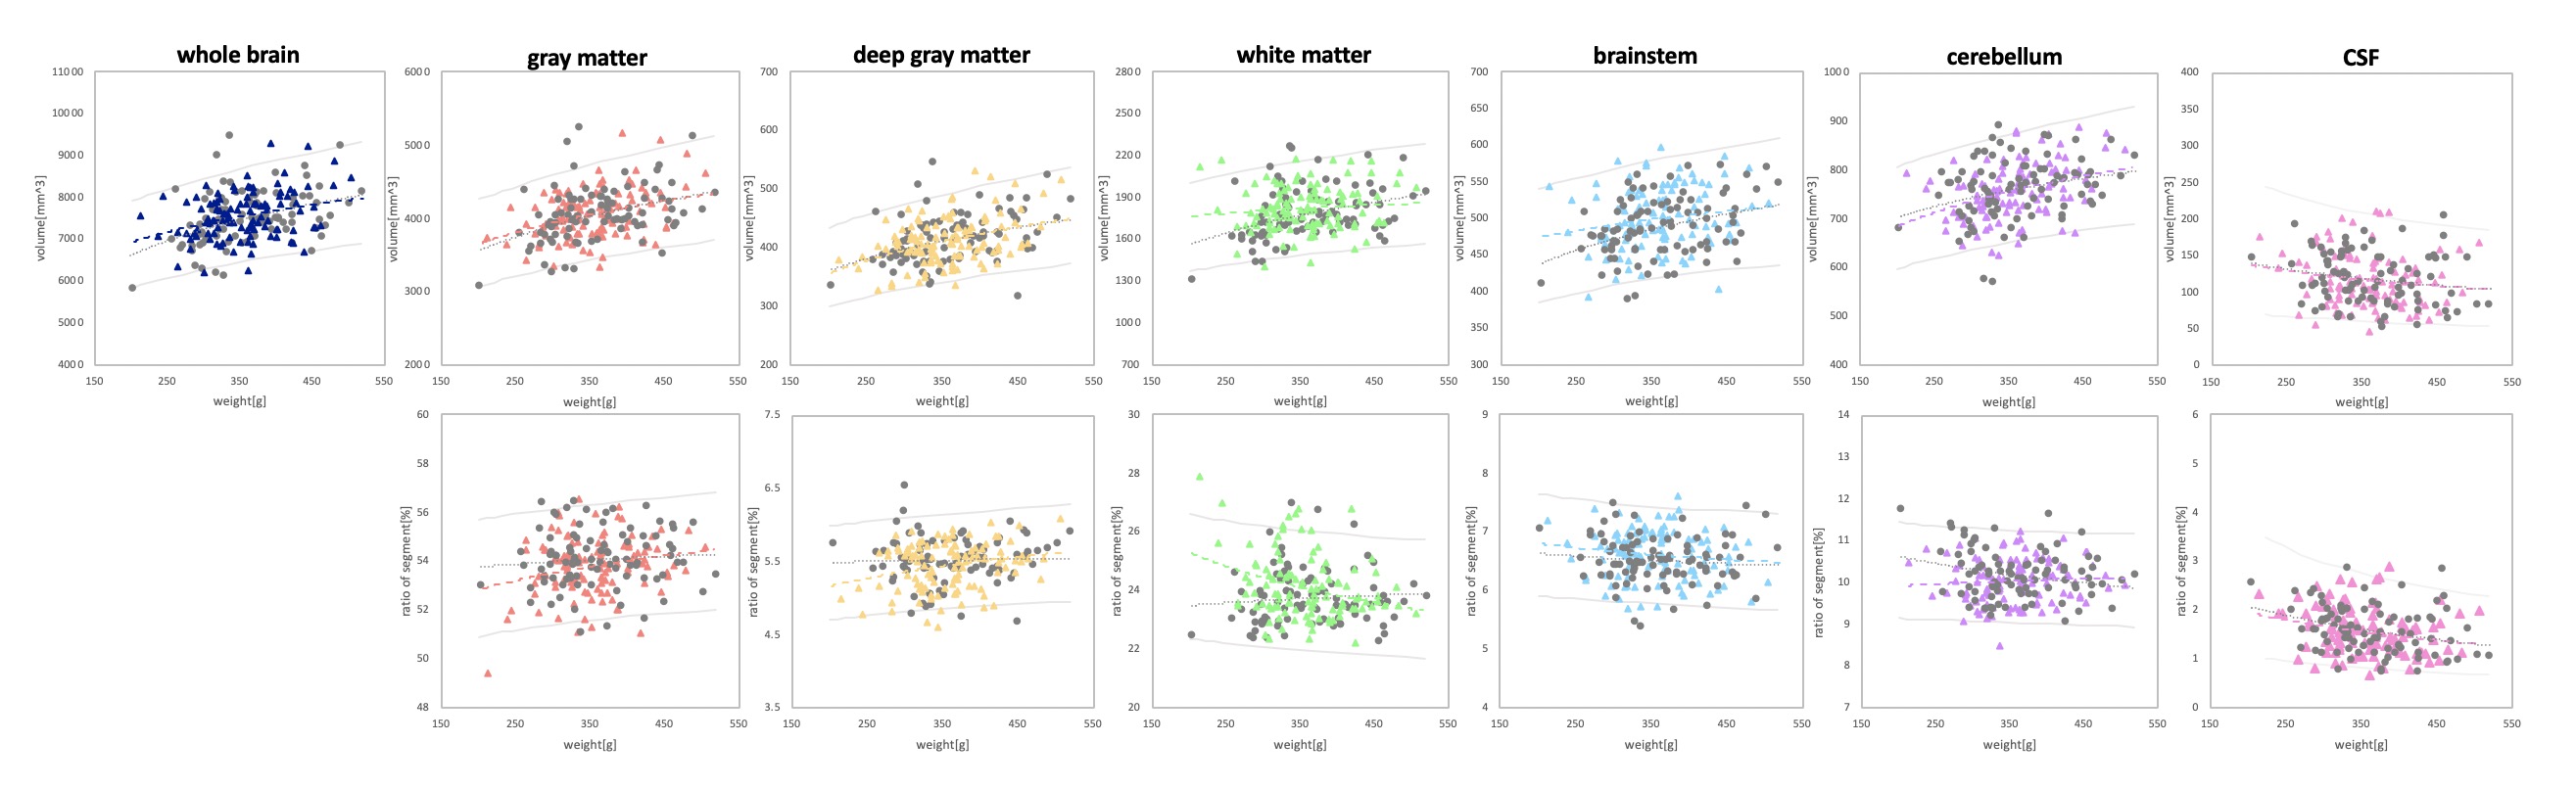
The upper part of the figure presents relationship
between weight and volume, and the lower part presents between weight and
percentage of the whole brain. The gray dots represent plot data of male, while
the colored triangle represent plot data of female. From the left, the images
are for the gray matter, deep gray matter, white matter, brainstem, cerebellum
and CSF.