1450
Relationship of regional volume changes and cardiac pulsatility in the brain1University of Pittsburgh, Pittsburgh, PA, United States
Synopsis
Brain atrophy is highly associated with cardiac pulsatility in the brain. The reduction of brain regional volumes was correlated with increased pulsatility of its supply arteries and a decrease of sinus and CSF. The regional volume reduction was affected by the pulsatility of different vessels.
INTRODUCTION
An increase of central arterial pulsatility is associated with structural changes in the brain1. High pulsatilty in arteries raises persistent stress to the microvascular system of capillaries and can cause damage to brain tissue. The cardiac pulsation signal generated from the heartbeat is delivered to the brain, along with vascular trees, and CSF. Because different brain regions have locally different vascular supply and drainage, the structural integrity of each region may be affected by pulsation of different vessels. We investigated the relationship between central arterial pulsatility and brain volumetric changes, as well as the spatial dependency of pulsatility on each regional volume change.METHODS
108 participants (ages: 66.5±8.4 with range of 50-87yrs, 68 females) were studied at 3T (Siemens, Prisma) using a 64-channel head coil. Subjects were 52 normal controls, 17 impaired without complaints, 11 subjective cognitive decline, 19 MCIs, and 9 ADs. 0.8 mm isotropic 3D T1- and T2-weighted images were acquired. rs-fMRI data were obtained with a GE-EPI with TR/TE = 800/37ms, voxel size = 2mm isotropic, FA = 52°, MB-acceleration-factor =8, and 72 slices with 420 volumes. The scanner provided a TTL pulse output for each slice to synchronize the cardiac cycle and MRI data. 8 separate sessions of rs-fMRI were acquired. The volumetric measurements for each brain region were performed by Freesurfer 6.0 after alignment of the T1- and T2-weighted images, bias field correction, removal of gradient nonlinearity, and readout distortion. All regional volumes were adjusted for total intracranial volume. To generate the cardiac pulsatile template map, the 2nd-order Fourier series (Σi ai·sin(i·θ)+bi·cos(i·θ),i=1,2) of the cardiac phase time courses with 6 motion parameters was fit to each voxel of image data2. Then, each voxel was calculated from the coefficients by sqrt(Σi [(ai/SEi)2+(bi/SEi)2]), where SE is standard error of the coefficients. This value indicates the amplitude of cardiac-coupled pulsatile signal in the brain. To determine a meaningful cardiac pulsatile map, a null statistic distribution was created by a Monte Carlo technique of regressing random phase data for an arbitrary noise model. The null statistic distribution was used to find the threshold for 3σ significance. For group analyses, each subject’s cardiac pulsatile map was transformed to MNI space, and the voxels within the brain mask were spatially normalized as Z-scores so that each individual’s map was on the same scale. The cardiac pulsatile data were then generated as a two-dimensional matrix (brain voxels x subjects). The LASSO-PCR approach3 was performed with a set of voxels in the cardiac pulsatile map as a regressor and the subjects’ age and regional volumes as the outcome. For cross-validation, the observed data were divided into training and test data. The training data were used to create the regression model, with estimation of voxel weights; the test data were applied to evaluate prediction accuracy. The fitting of the regression model was evaluated using a leave-one-out method. To test the overall significance of the model and ensure that cross-validated prediction errors were unbiased, we performed 1000 iterations of permutation test on the LASSO-PCR.RESULTS
Fig. 1 demonstrates the group averaged cardiac pulsatility map. Large vessels and CSF regions were localized. Fig. 2 shows the high correlation between the original and the predicted data in age, hippocampal region, and lateral ventricle region. Other brain regions of ventralDC, brainstem, accumbens, thalamus, and 3rd ventricle shows r > 0.6 between the original and the predicted volume. Amygdala, isthmus cingulate, parahippocampal parsorbitalis, postcentral superior frontal, and superior temporal regions show moderate correlation (r> 0.3), indicating the volume change of these regions are associated with the cardiac pulsatility. Fig.3 shows the spatial distribution of the cardiac pulsatile associated with regional volume in the brain. Reduction of hippocampal volume was related to an increased pulsatility of the insular artery (IA), posterior cerebral artery, and a decreased pulsatility of lenticulostriate arteries (LSA) and lateral ventricle (LV). VentralDC and brain stem, two adjacent areas, shows positive correlation with LV, sagittal sinus (SS), and LSA, and negative correlation with prepontine cistern (PC) and IA. The pulsatility of the PC is likely synchronized with that of the basilar artery. Accumbens is related negatively with IA and PCA and positively with LSA, SS, and LV. Since the volume of the ventricles is inversely correlated with that of deep gray matter regions, the opposite relationship of pulsatility was observed with the gray matter. The overall spatial dependency showed that gray matter volumes were negative correlation with the pulsatility of arterial vessels and positive correlation with the pulsatility of sinus and CSF regions. The additional labels in Fig. 2 are ACA: anterior cerebral artery, PS: petrosal sinus, CA: cerebral Aqueduct, CM: cistern magna, ICV: internal cerebral vein.DISCUSSION
The brain is vulnerable to increased arterial pulsatility4,5. Increased arterial stiffness with normal aging is inversely related with increased arterial pulsatility6. Each regional volume was associated with a different area of the cardiac pulsatile map. The pulsation of supply arteries appears to have influence on regional structural integrity.CONCLUSION
The cardiac pulsatility in the brain is highly associated with brain regional volume. Each region was affected by different regions of pulsatility.Acknowledgements
This work was supported by the National Institutes of Health (UF1-AG051197).References
1. Mitchell, Arterial stiffness, pressure and flow pulsatility and brain structure and function: the Age, Gene/Environment Susceptibility--Reykjavik study. Brain. 2011
2. Glover, Image-Based Method for Retrospective Correction of Physiological Motion Effects in fMRI: RETROICOR. Magnetic Resonance in Medicine 44:162–167 (2000)
3. Wager TD, Atlas LY, Leotti LA, Rilling JK. Predicting individual differences in placebo analgesia: contributions of brain activity during anticipation and pain experience. The Journal of neuroscience: the official journal of the Society for Neuroscience. 2011; 31(2):439–52
4. Webb, A. J. S. et al. Increased cerebral arterial pulsatility in patients with leukoaraiosis: arterial stiffness enhances transmission of aortic pulsatility. Stroke 43, 2631–2636 (2012).
5. Wohlfahrt, P. et al. Large artery stiffness and carotid flow pulsatility in stroke survivors. J. Hypertens. 32, 1097–1103;
6. Wagshul ME1, Eide PK, Madsen JR. The pulsating brain: A review of experimental and clinical studies of intracranial pulsatility. Fluids Barriers CNS. 2011 Jan 18;8(1):5.
Figures
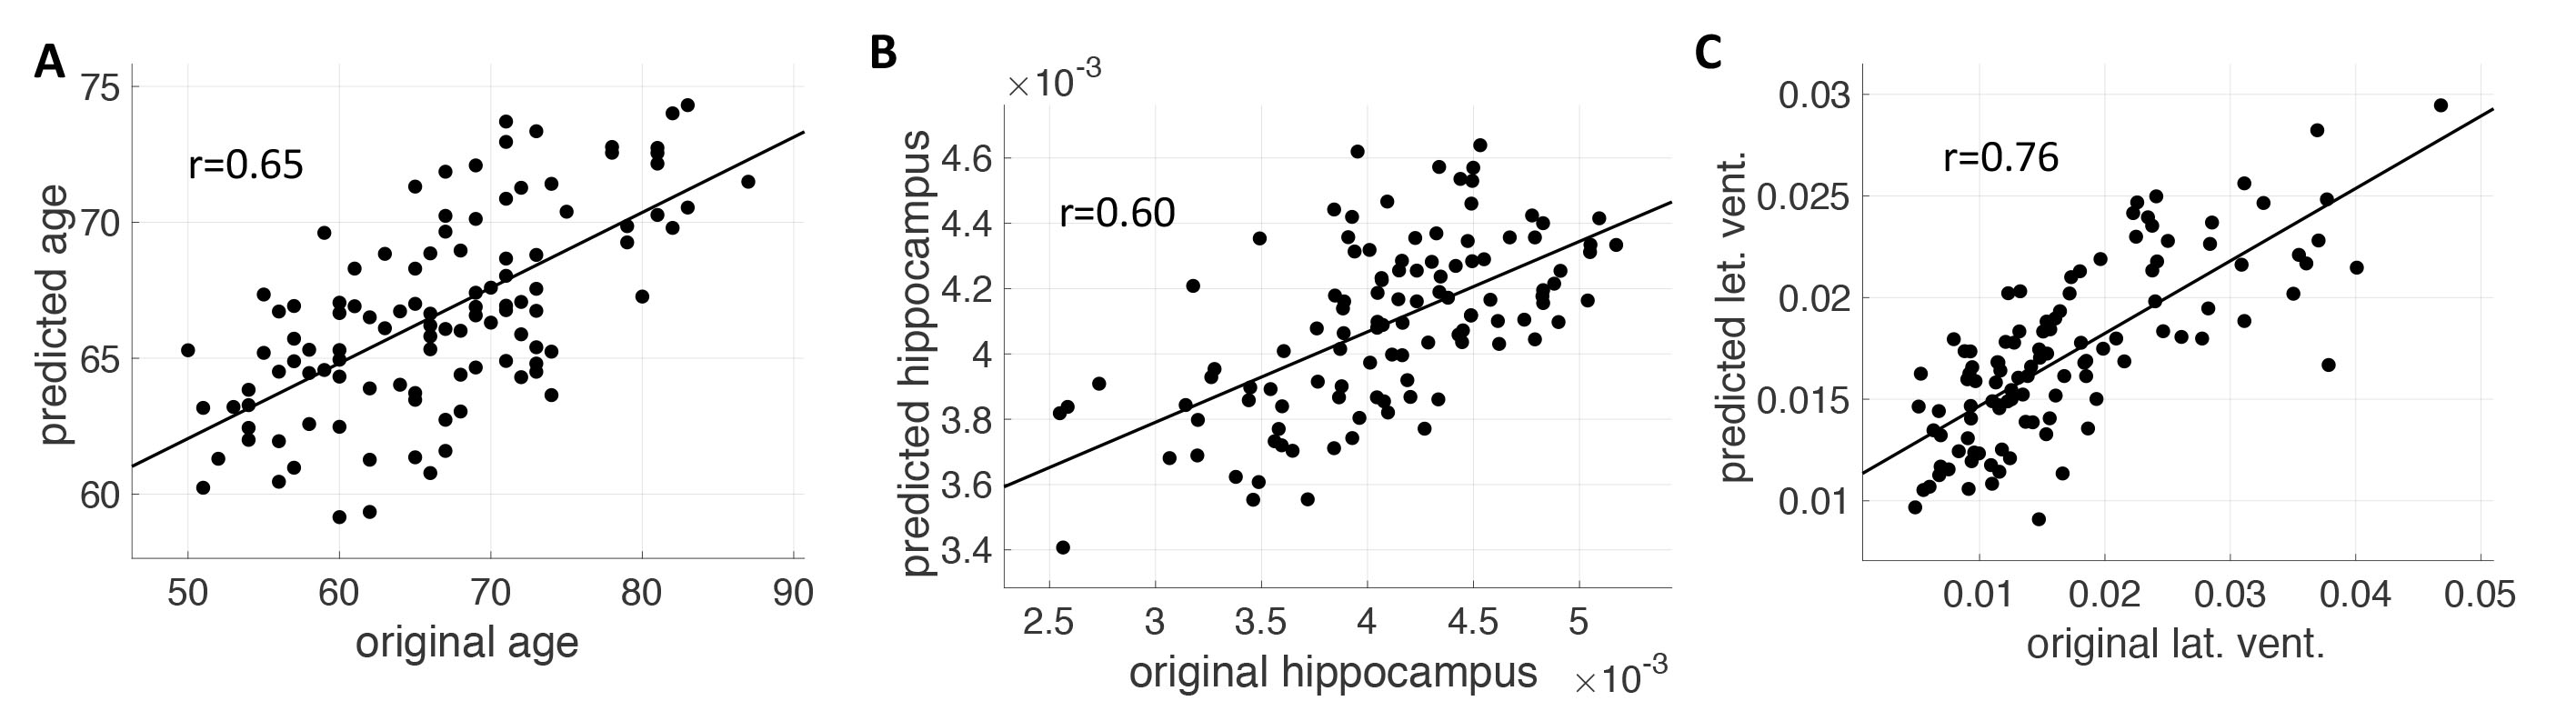
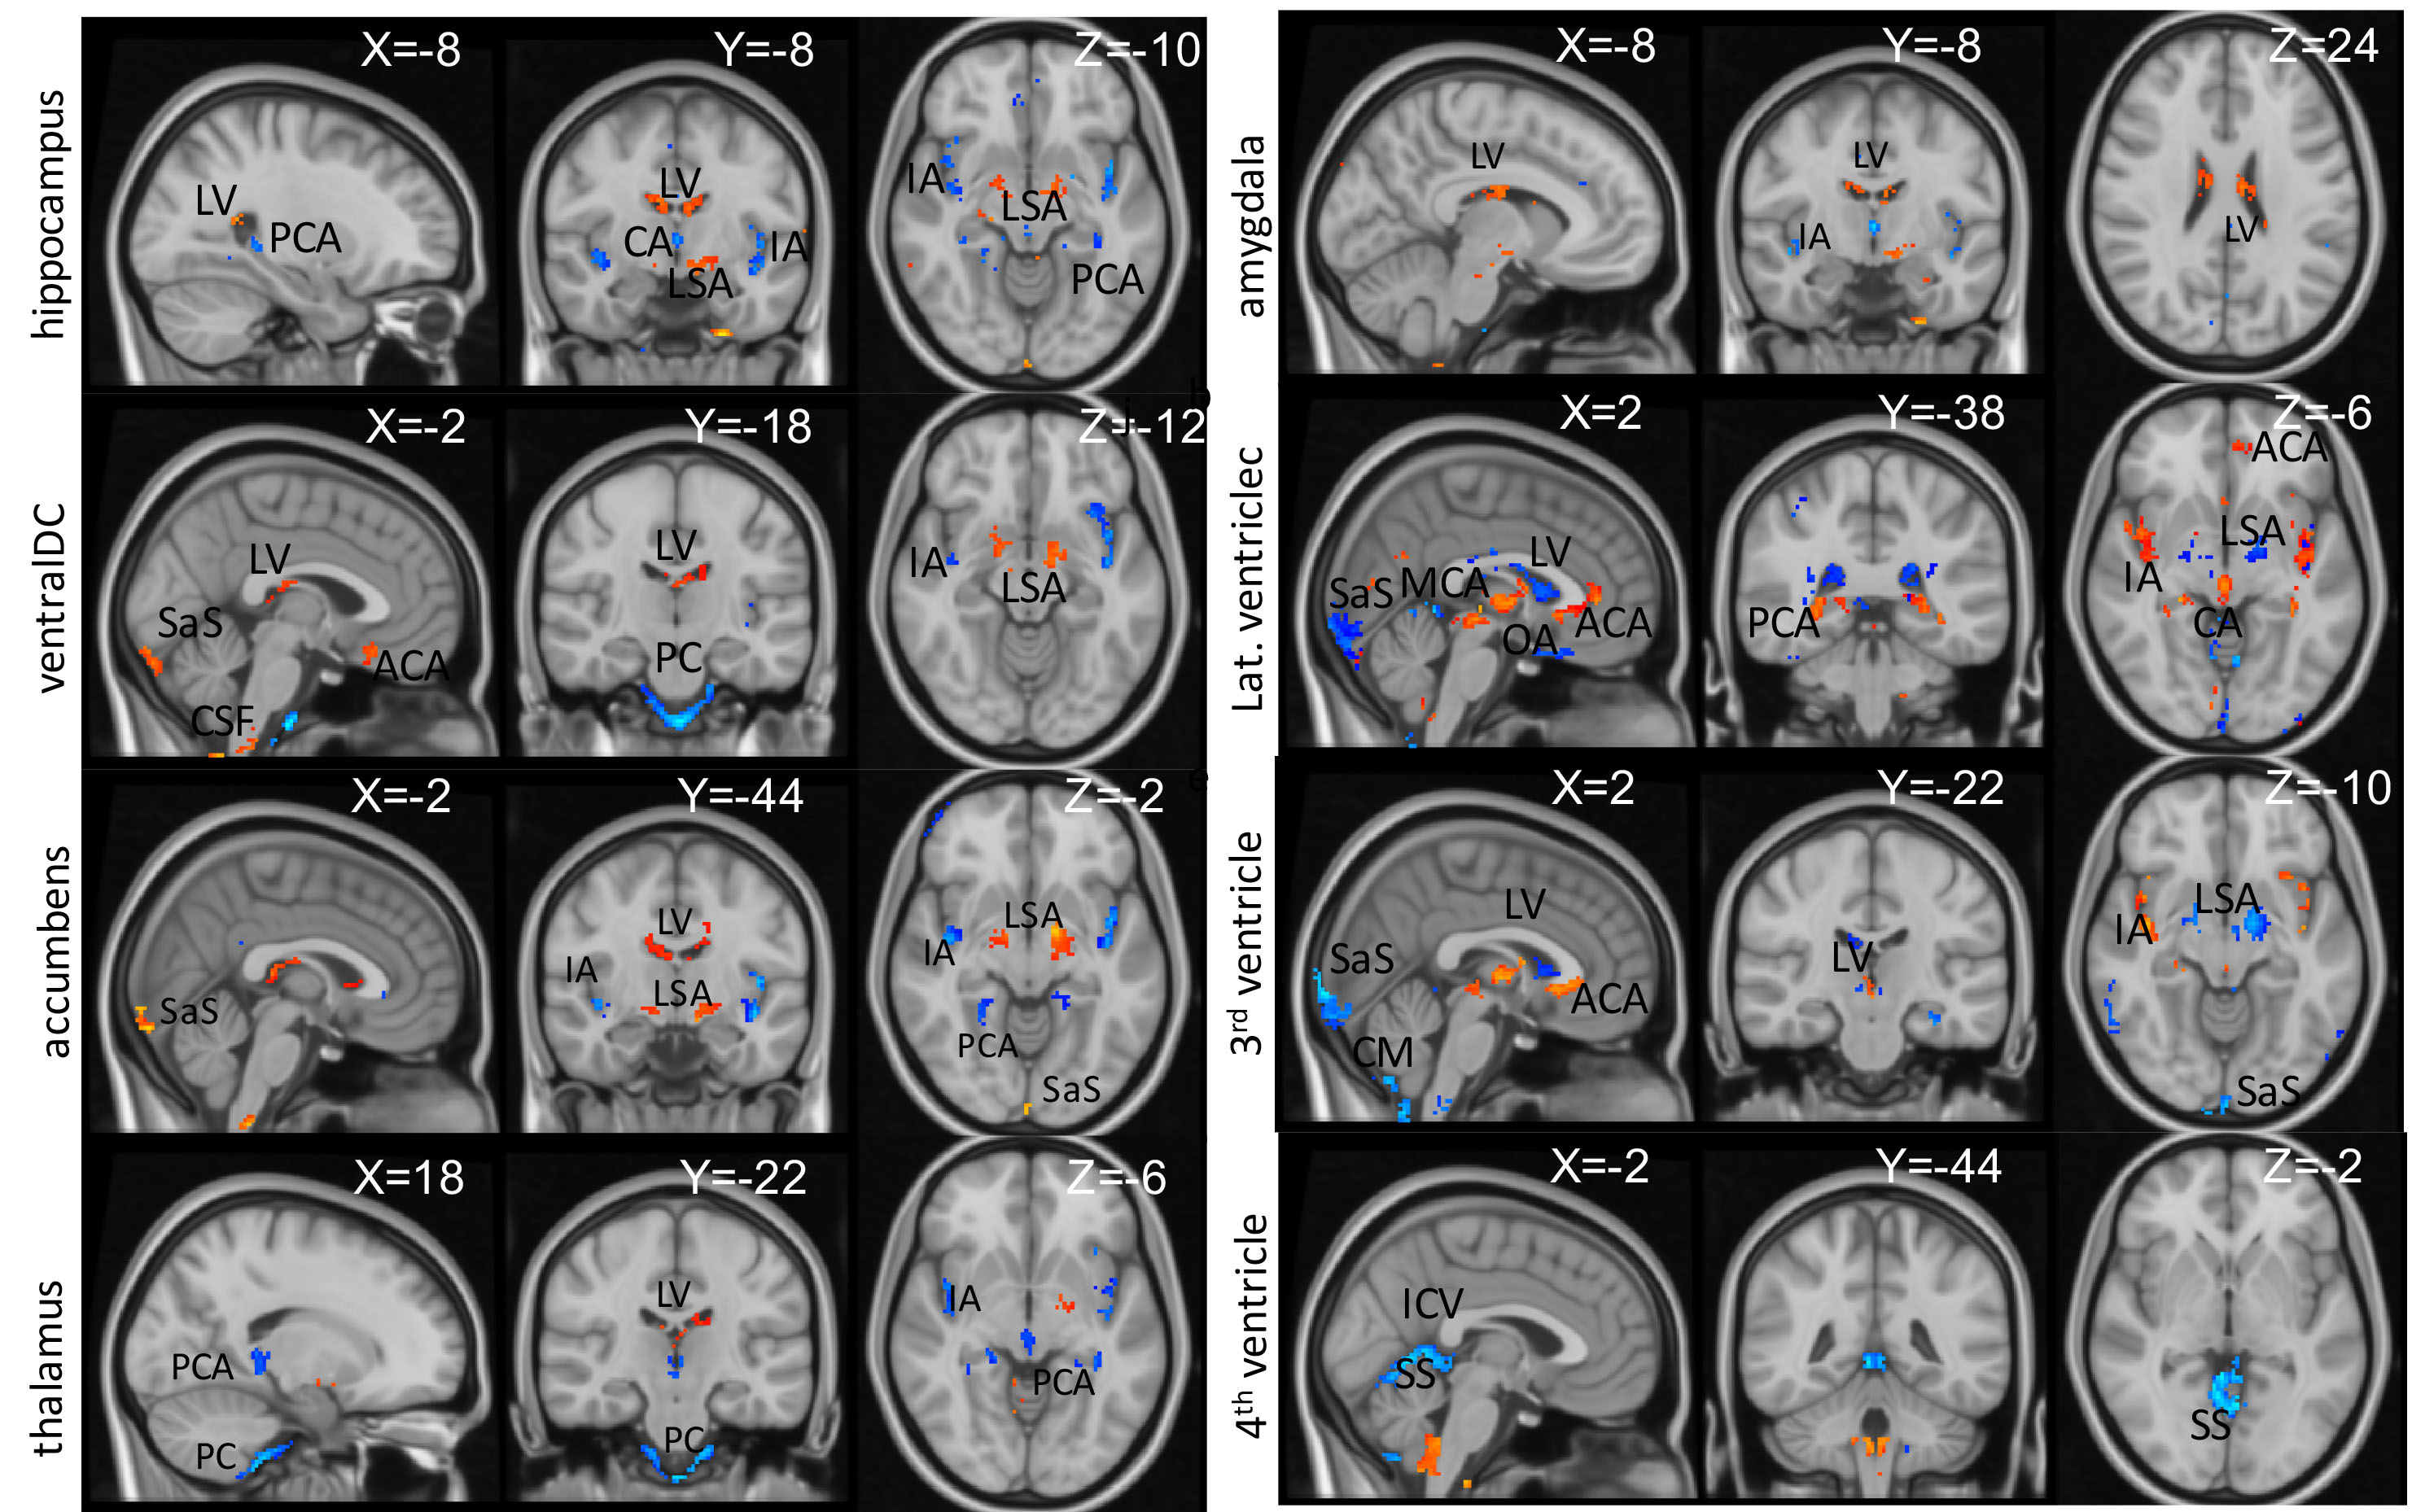
Fig. 2. Spatial distribution of cardiac pulsatile map correlated with the volumetric change of each brain region. The statistically significant voxels were displayed (p<0.01). Decreased volume of gray-matter was associated with increased pulsatility of input arteries for each region and correlated with pulsatility in LSA, ventricles, and sinus areas. Ventricular regions show inverse relationships as greater CSF means less brain parenchyma. Yellow/red:positive, blue/cyan: negative relationship. X, Y, Z: MNI coordinates.