1449
Similar mechanisms and locations of white matter lesions in elderly healthy controls and asymptomatic carotid artery stenosis patients1School of Medicine, Department of Neuroradiology, Technical University of Munich, Munich, Germany, 2MRRC, Yale University, New Haven, CT, United States, 3School of Medicine, Department of Radiology, Technical University of Munich, Munich, Germany, 4Philips Healthcare, Hamburg, Germany, 5School of Medicine, Clinic of Neurology, Technical University of Munich, Munich, Germany
Synopsis
White matter lesions (WML) are detected as hyperintensities on clinically frequently used T2-weighted FLAIR-images and can manifest as cognitive decline. Though most elderly subjects show WML, the pathogenesis is still unclear. Potential causes are small vessel damages and myelin-sheath deformations. We present data from 30 healthy elderly and 29 carotid stenosis patients measuring WML, individual watershed areas (iWSA), capillary transit-time heterogeneity (CTH) and DTI-based structural parameters. We hypothesize increased lesion load inside iWSAs and capillary dysfunction with structural damages in WML. Our results confirm those hypotheses and furthermore, indicate similar WML formation mechanisms in healthy aging and carotid artery stenosis.
Purpose
White matter lesions (WML) are detected as hyper-intensities on T2-weighted FLAIR images and are also known as white matter (WM) hyper-intensities. They are widely assessed in clinical routine and research to evaluate periventricular and deep white matter changes. Watershed areas (WSA) between perfusion territories1 are known to be most vulnerable to WML.2,3 In the absence of distinct diagnoses, WML are commonly interpreted as microangiopathic changes, which can result in cognitive decline.4 Despite WML findings in most elderly subjects, their pathogenesis is still unclear.2 A potential cause is cerebrovascular dysregulation.5-7 Other potential causes comprise small vessel damages and myelin sheath deformations.8 Promising state-of-the-art parameters to reveal insights to such microvascular and microstructural changes are the capillary transit-time heterogeneity (CTH)9 and DTI-based structural WM integrity parameters10,11. The impact of internal carotid artery stenosis (ICAS) on WML is currently under debate, as some studies found associations,12,13 while others did not14,15.The aims of our study were therefore to investigate WMLs in relation to recently available individual WSA (iWSA)16 and investigate microvascular impairments and structural damage, measured by CTH and DTI, respectively. Pathophysiologic and normal age-related WML effects8 were compared between patients with internal carotid artery stenosis (ICAS) with known CTH impairments17 and elderly healthy controls (HC). We hypothesize increased lesion loads inside iWSA. Furthermore, we hypothesize CTH increases and structural damage inside WML.
Methods
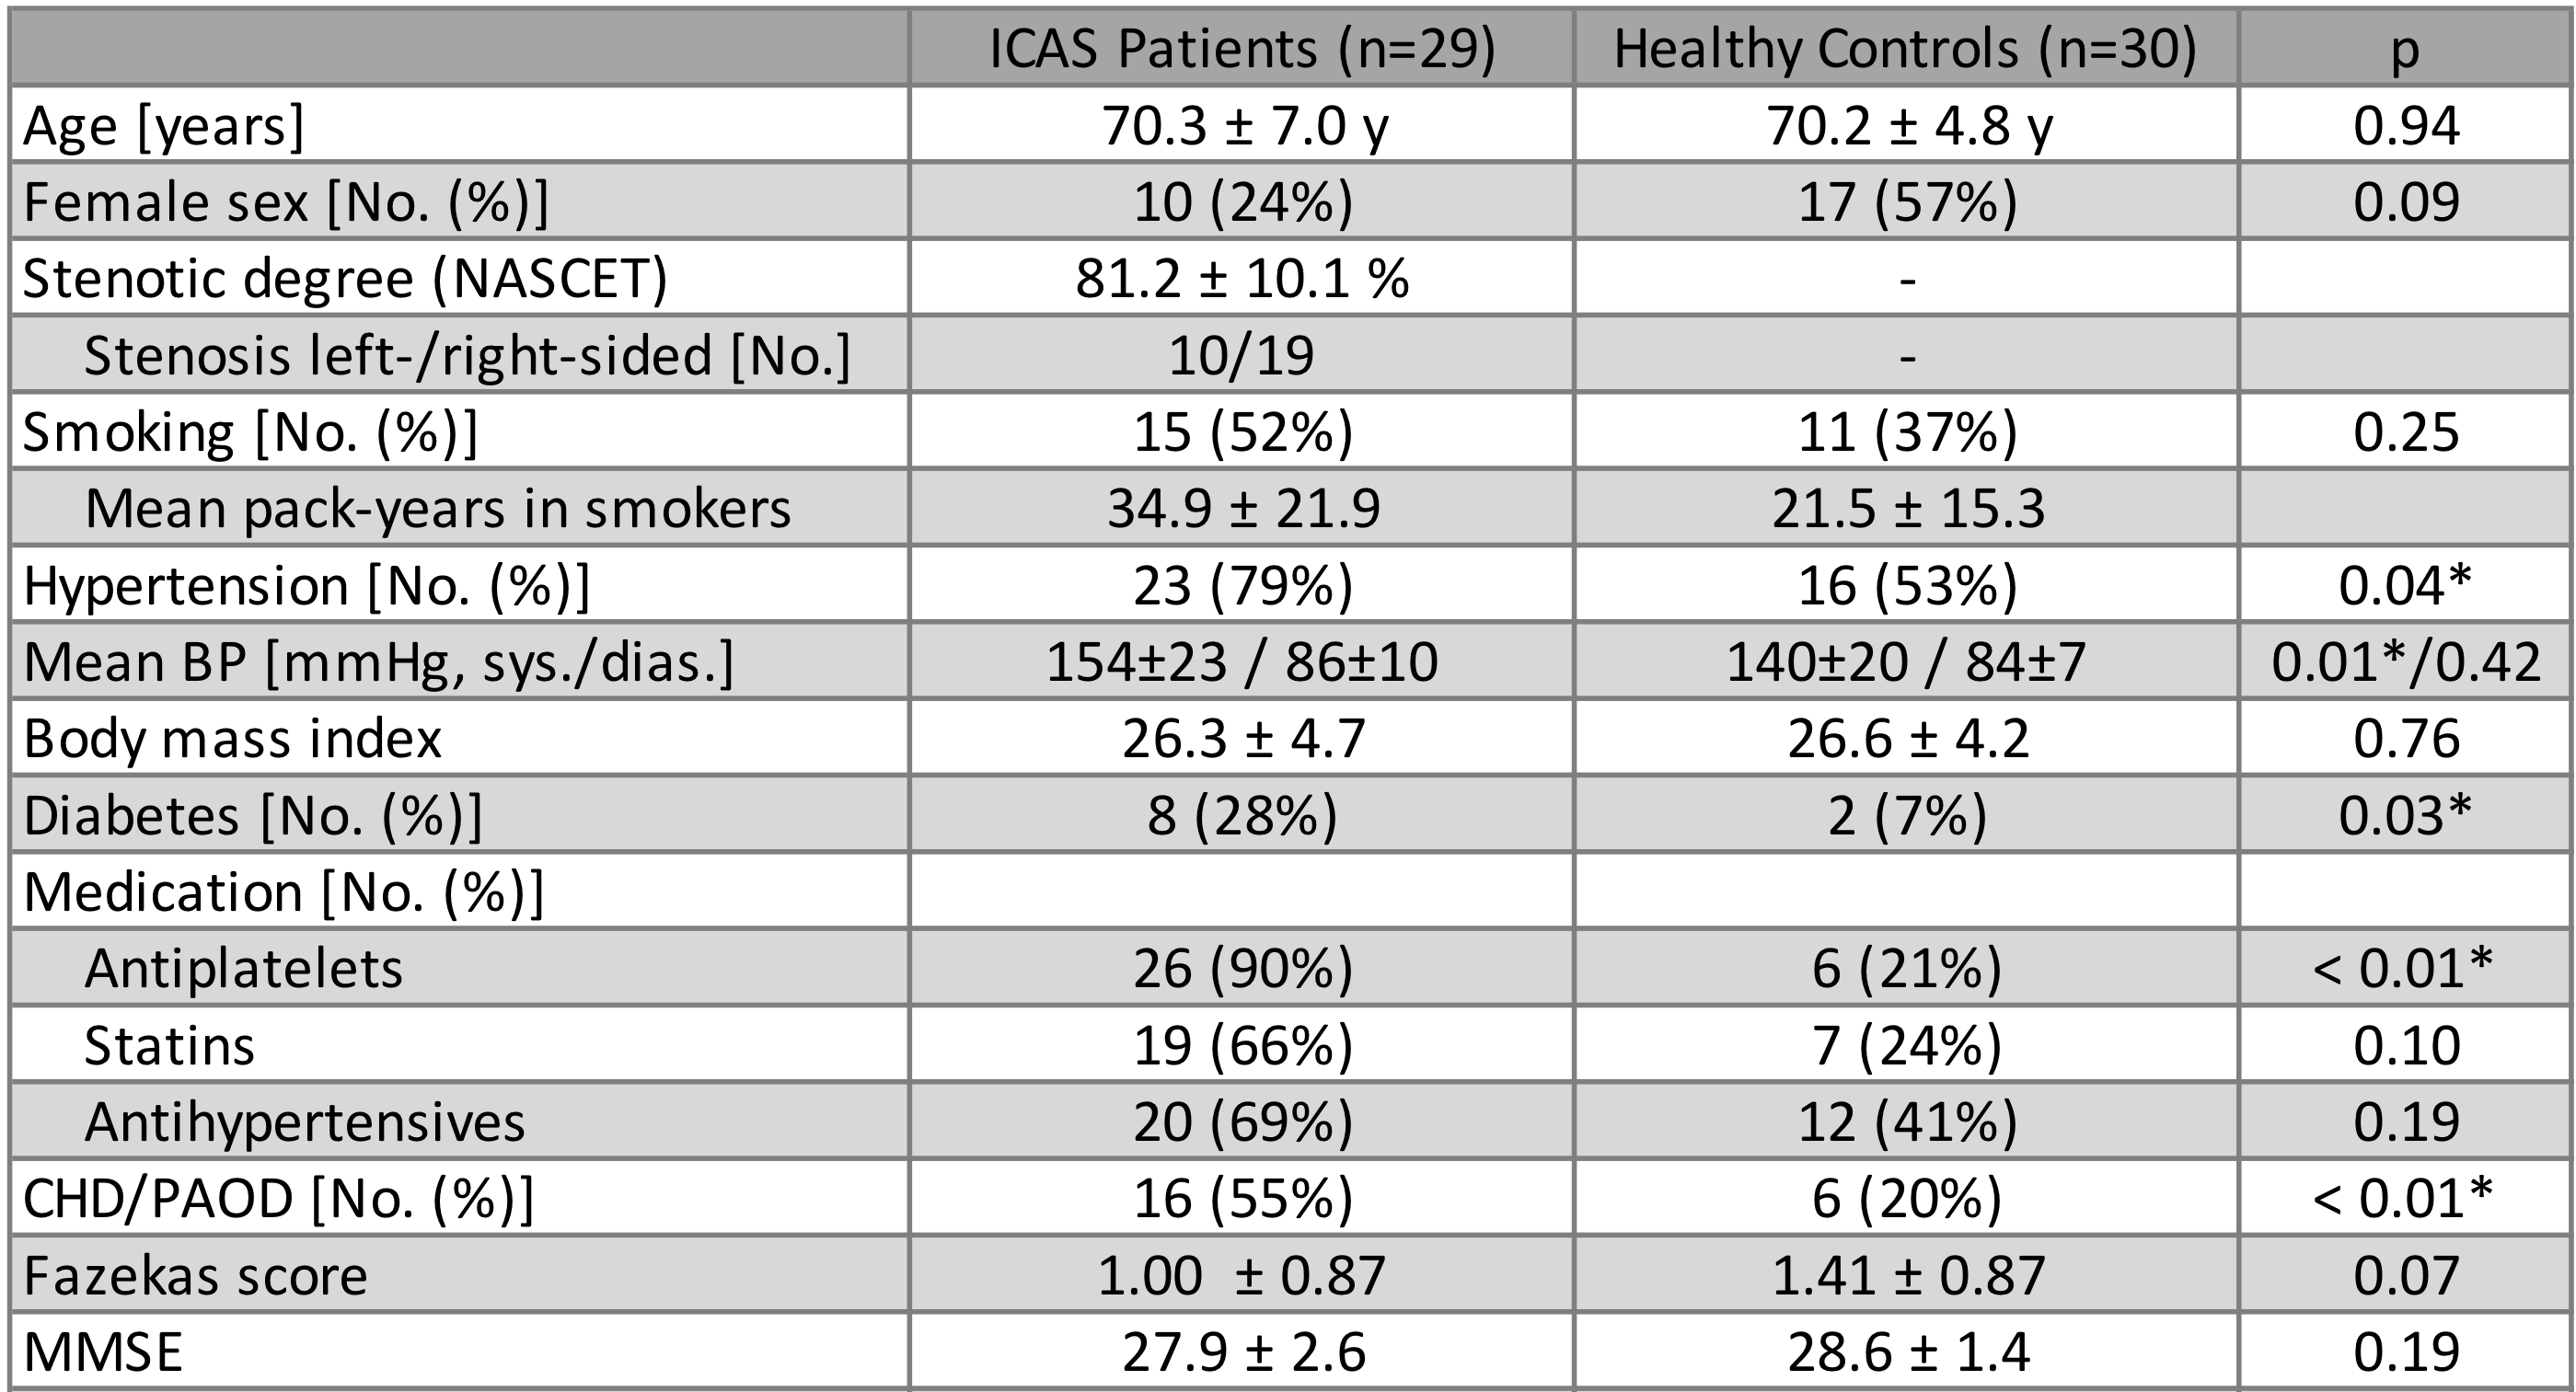
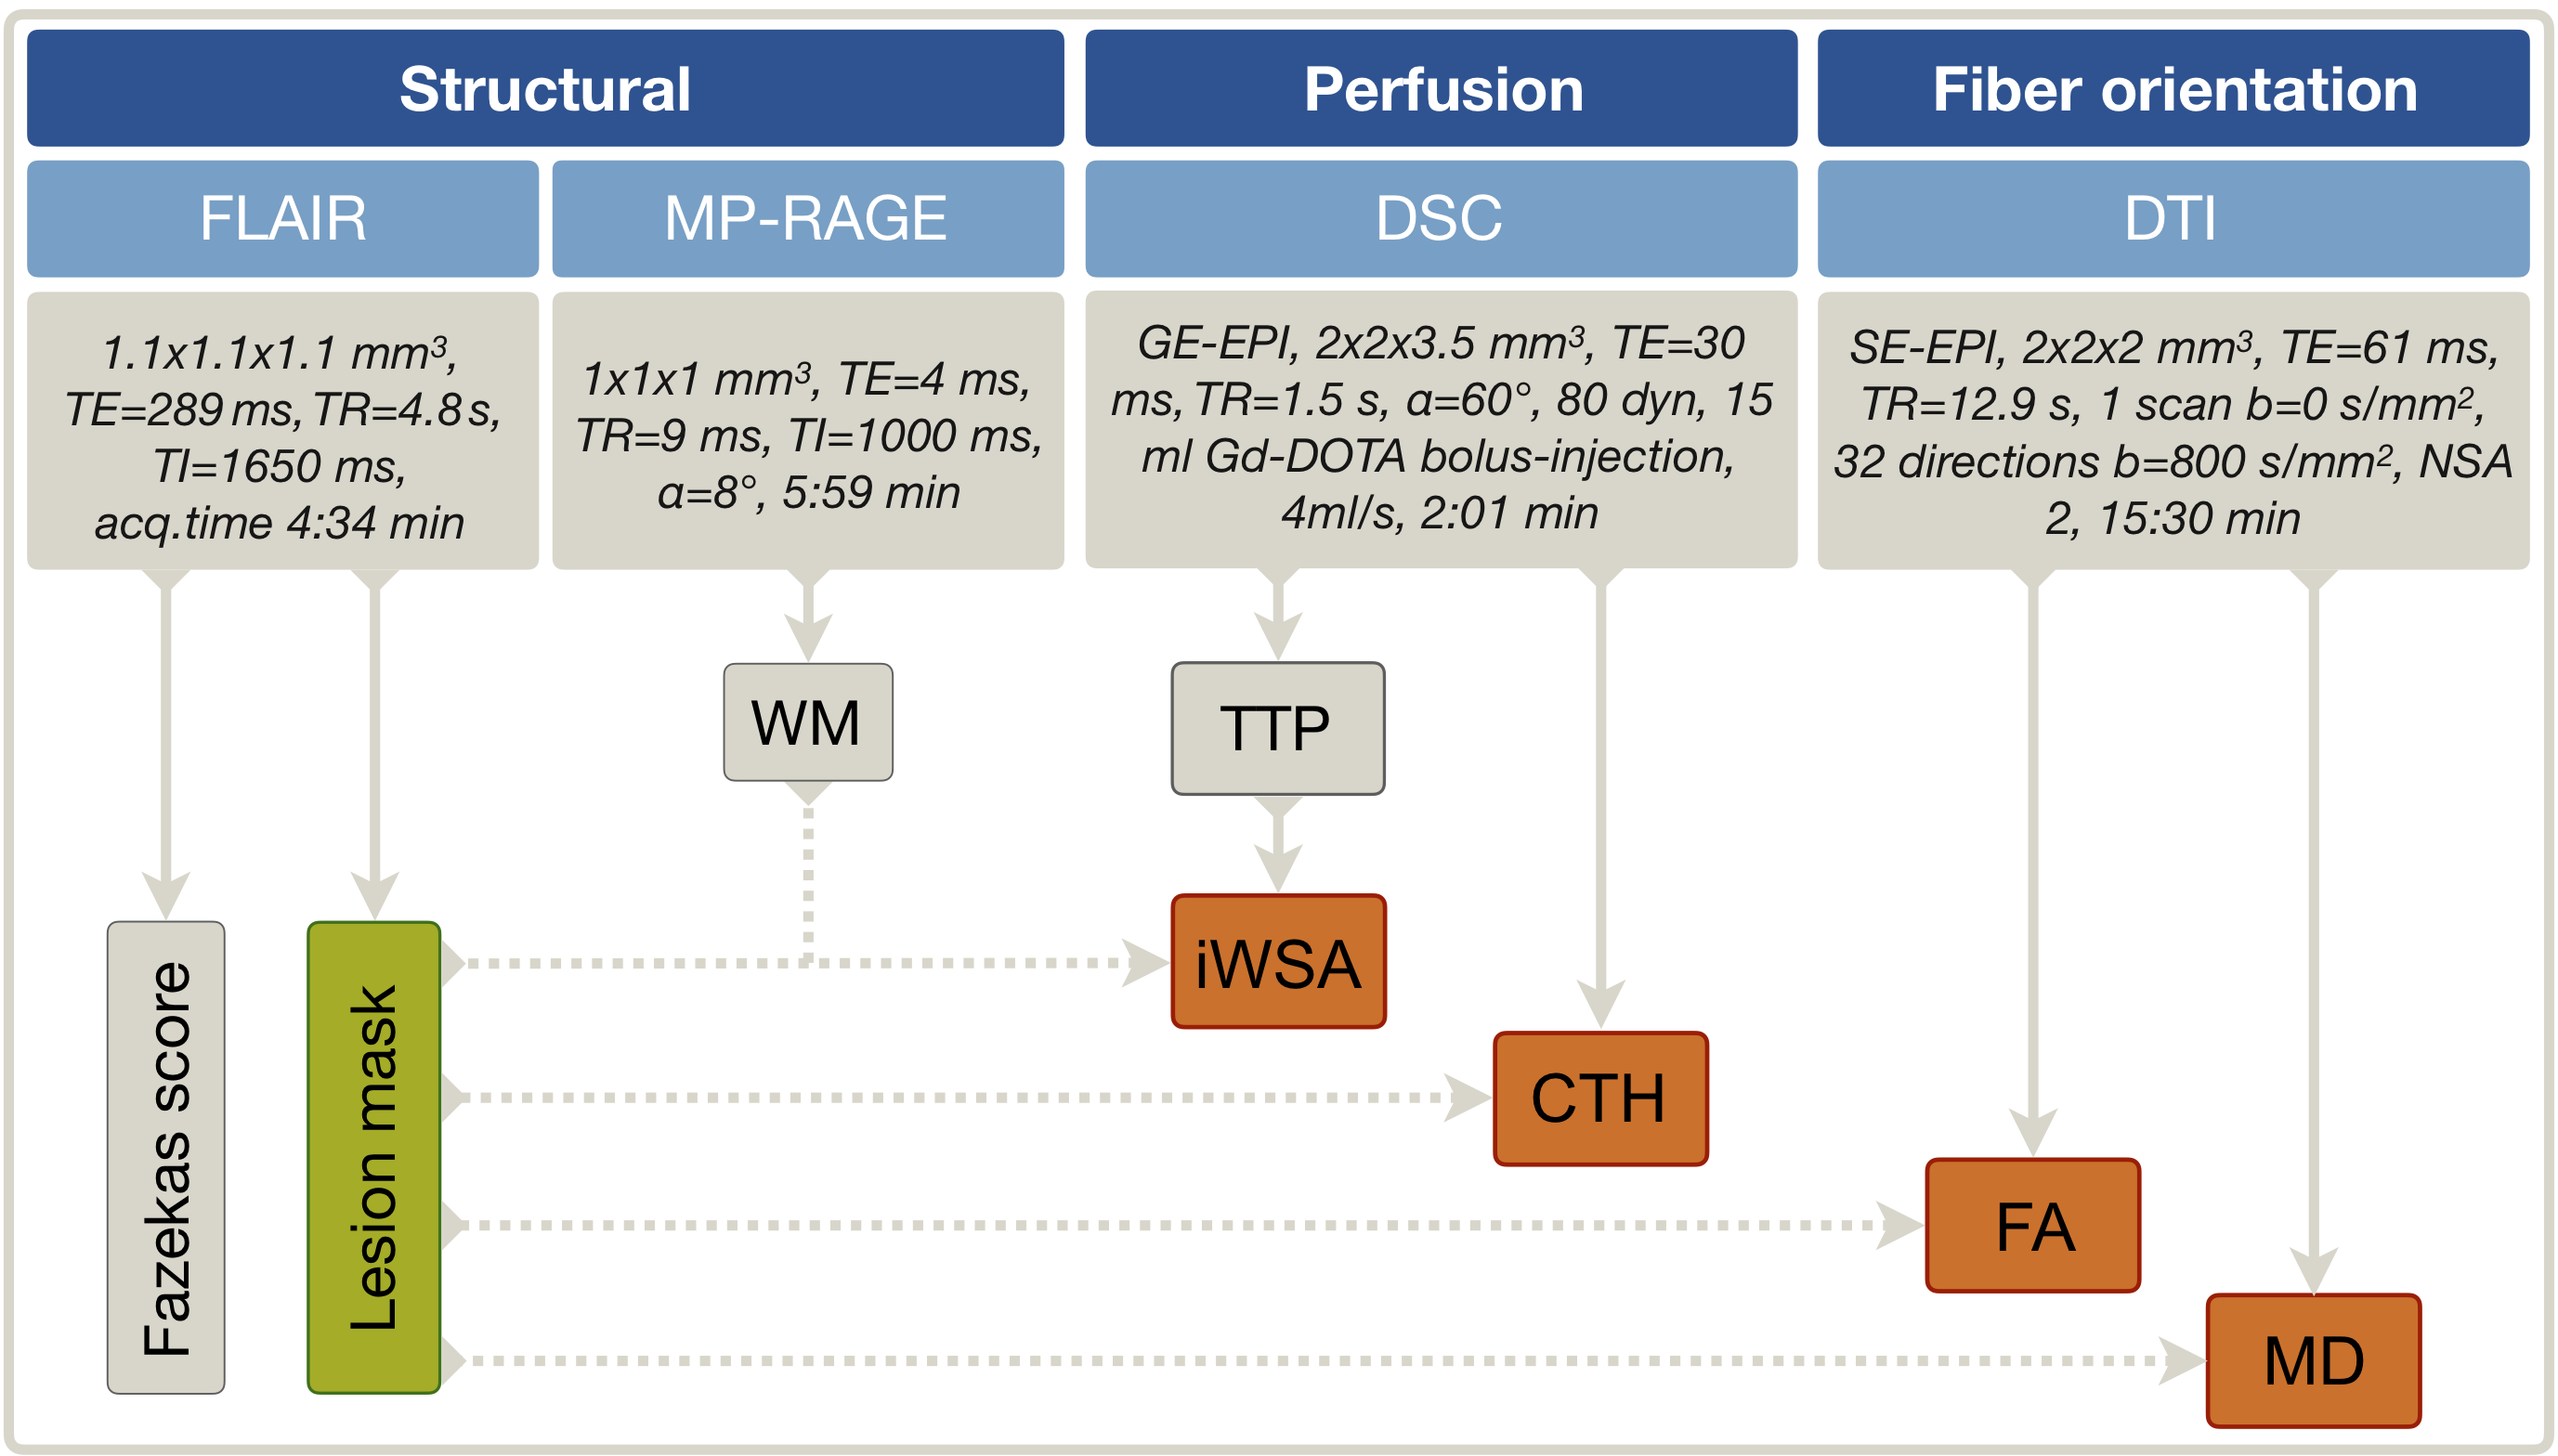
Fifty-nine participants (29 asymptomatic, unilateral ICAS-patients, age=70.1±4.8 y and 30 HC, age=70.3±7.3 y, without previous infarcts, see Tab.1) underwent MRI on a 3T Philips Ingenia (Philips Healthcare, Best, Netherlands) using a 16-channel head-neck-coil. The imaging protocol and derived parameters are summarized in Figure 1. WML-masks were generated by LST-toolbox segmentation18 of T2-weighted FLAIR images with a threshold of 0.3. For comparison, the common clinical lesion analysis by Fazekas-scoring was also applied (Fig.1).19 The iWSA masks16 and CTH maps9 were derived from DSC-MRI. Structural fractional anisotropy (FA) and mean diffusivity (MD) maps were based on DTI10,11. All parameter-maps were coregistered to each subject’s individual MP-RAGE. Processing was performed with SPM12,20 FSL21 and custom Matlab programs. Average parameter values were compared inside vs. outside WML. Two-sample t-tests were applied for statistical analyses and considered statistically significant at p<0.05.Results
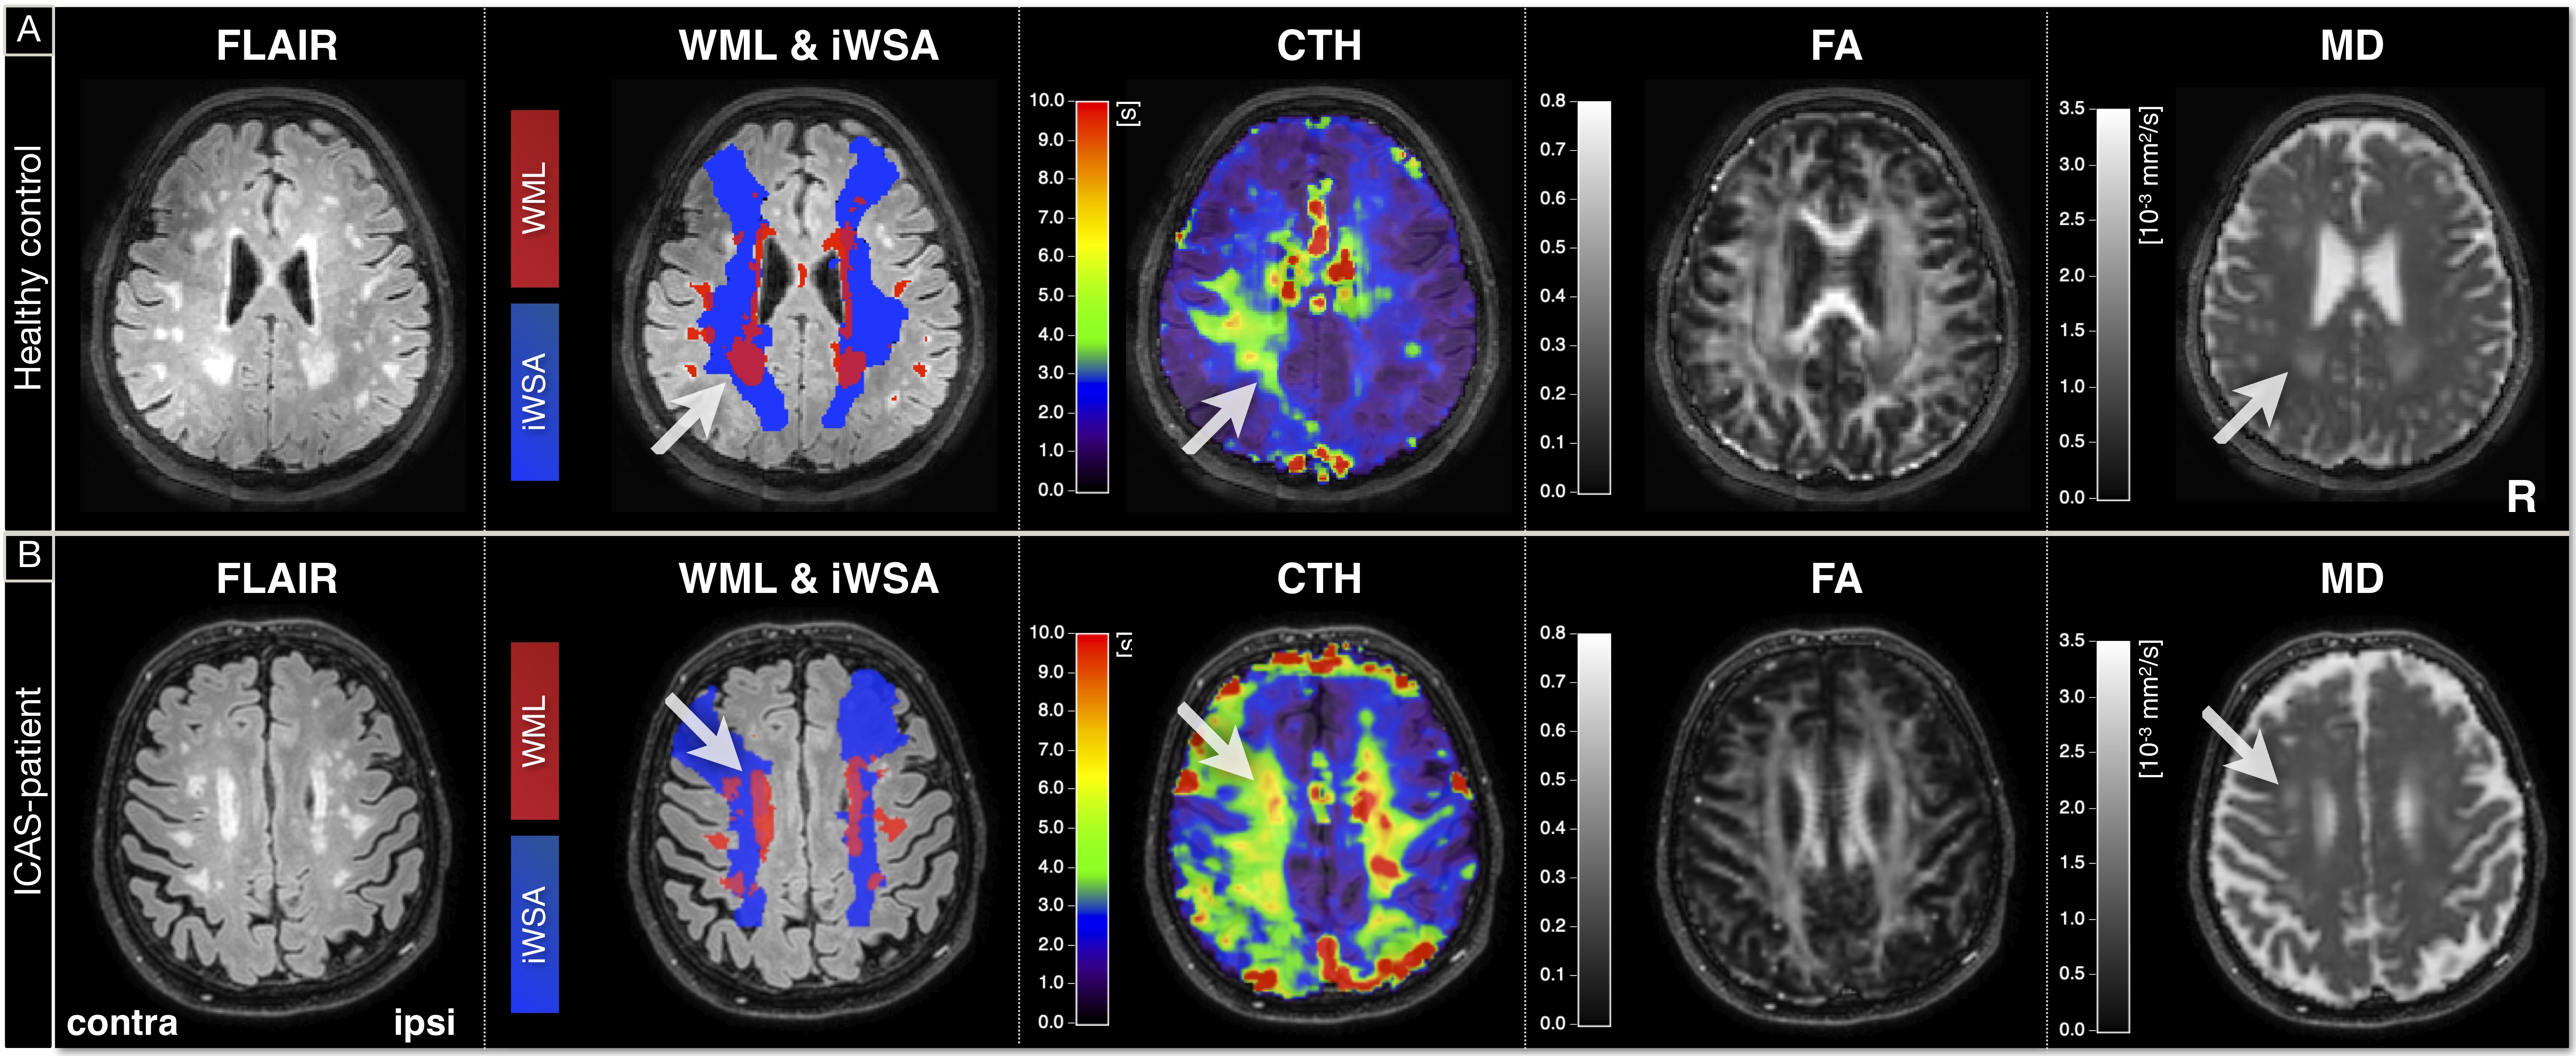
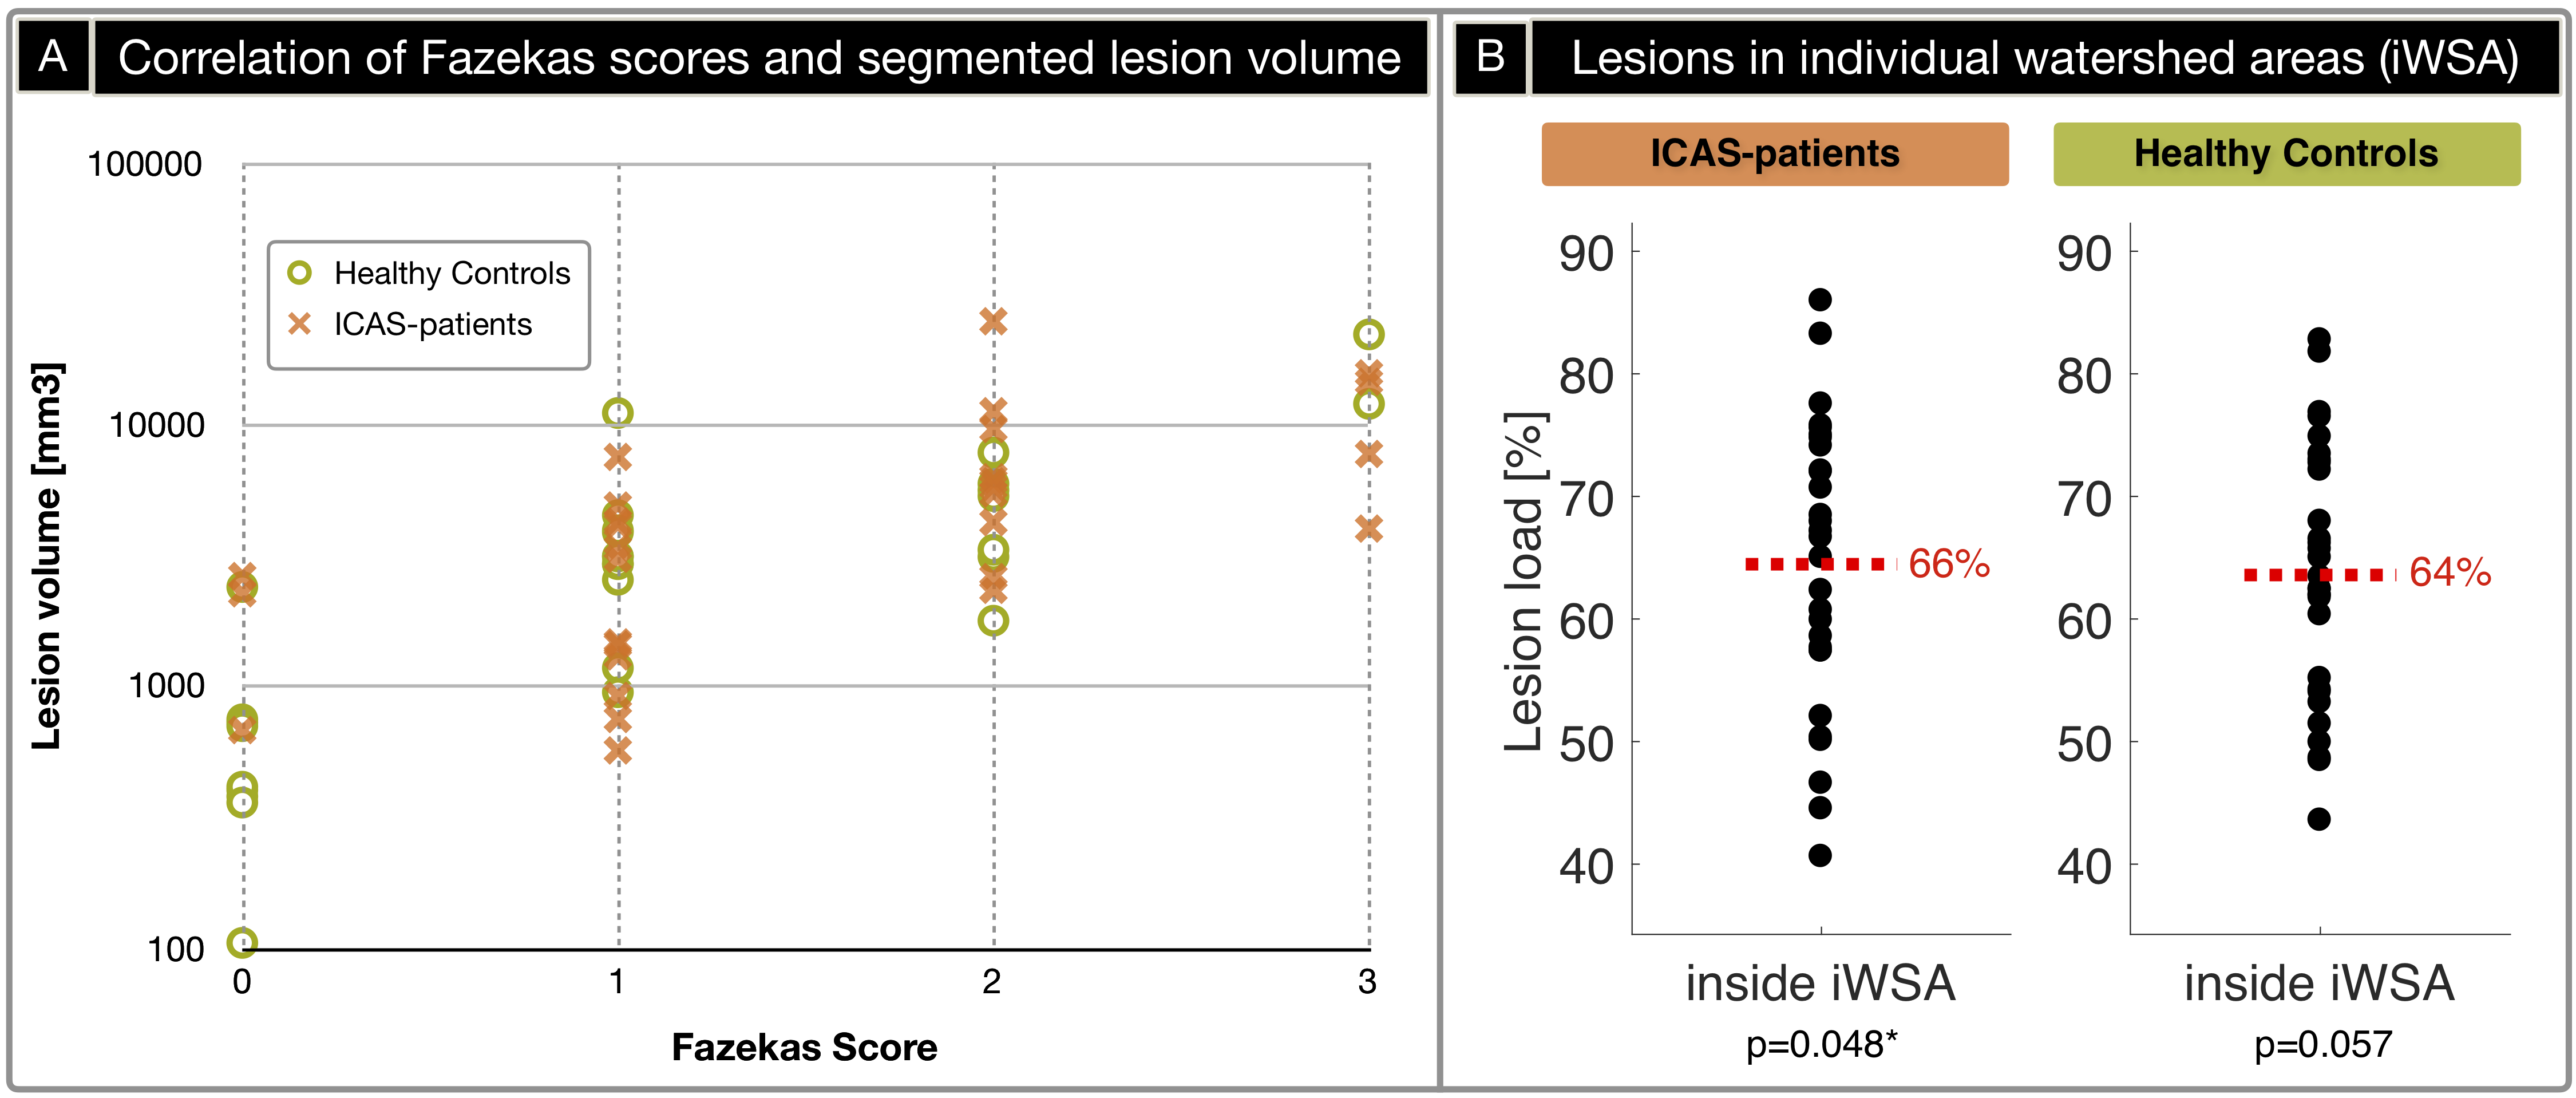
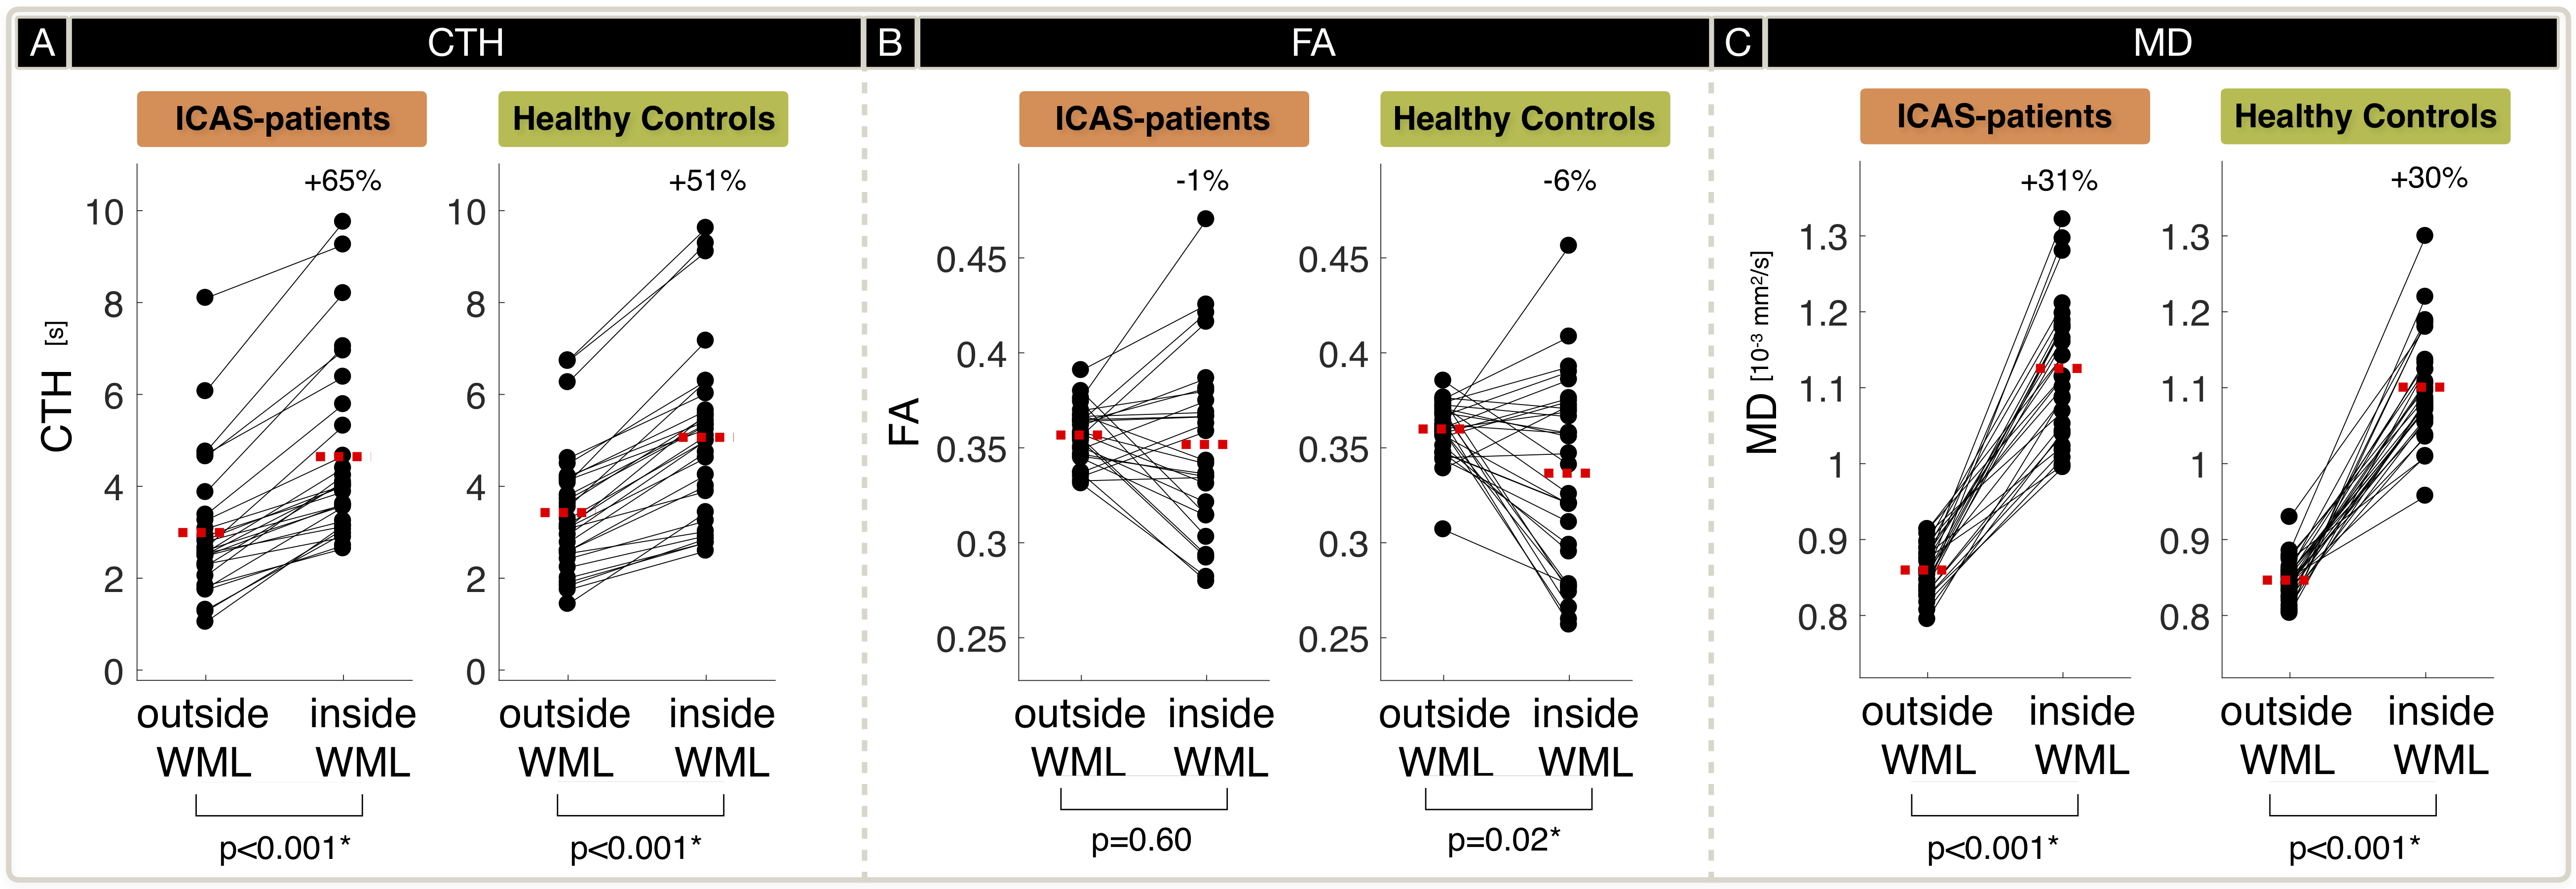
Exemplary imaging data of two participants is shown in Figure 2. On group level, Fazekas-scores and automated lesion segmentations correlate reasonably well (Fig.3A). We found increased WML load inside iWSA for ICAS-patients (p=0.048) and almost significant also for HC (p=0.057). The fraction of WML inside iWSA was similarly elevated for both groups (64% and 66%, respectively; Fig.3B). The average WML load was non-significantly increased in ICAS (mean±std: 5533±5421 mm3) compared to HC (3812±4599 mm3, p=0.19), consistent with Fazekas-scores (ICAS/HC: 1.41/1.00, Tab.1). While absolute WML hemispheric lateralisation was stronger in unilateral-ICAS compared to HC (1033 mm3 vs. 456 mm3, p=0.006), no significant side differences were found in ICAS (p=0.54).CTH in WM was elevated inside- compared to outside-WML for ICAS and HC (p<0.01, Fig.4A). CTH was increased inside WML by +65% in ICAS and +51% in HC. Structural analyses by DTI also revealed similar effects for ICAS-patients and healthy controls (Fig.4B,C). MD values were increased inside WML by +31% for ICAS-patients and +30% for HC (p<0.001, each, Fig.4C). While average FA values were similar inside vs. outside WML, but with increased standard deviations inside WML.
Discussion
The investigation of WML locations revealed increased lesion load inside iWSA, as hypothesized. Approximately 65% of WML were located in iWSA, even though iWSA constitute only 26% of the whole WM. Interestingly, the WML prevalence in iWSA was the same in ICAS and HC. A previous CT-MRI study found similar effect sizes in tumor patients, with 62% of lesions inside border zones, which constituted 29% of the area.3 In unilateral ICAS, we found no significant hemispherical lateralisation in agreement with the literature.15 Those findings suggest similar locations of WML in healthy ageing and different pathologies.The overall WML volumes and Fazekas scores in ICAS were slightly elevated compared to HC, but non-significant. A possible influencing factor in the known multifactorial WML pathogenesis2,8 is increased hypertension in our ICAS-patients (Tab.1).22 Fazekas-scores and lesion segmentation correlate well, given the comparably vague Fazekas-scaling.23 Our findings agree well with a previous study in asymptomatic ICAS, which proposed no causal role of ICAS in the development of WML.14
In HC as well as ICAS-patients, we found strong impairments of CTH inside WML, indicating an important role of capillary dysfunction in the development of lesions in both groups. Microstructural DTI measures showed increased MD inside WML for every participant pointing to axonal degeneration.11,24 In contrast, FA results were variable inside WML pointing to different influences with opposing effects. Those results further support age-related15 and ICAS-independent WML formation mechanisms.
Conclusion
As hypothesized, the lesion load was increased inside iWSA for both groups, which underlines the vulnerability of iWSA for structural damage in healthy ageing as well as disease. Furthermore, pronounced CTH elevations within WML imply an important role of capillary dysfunction in the WML pathogenesis. Interestingly, CTH as well as structural effects were largely comparable between ICAS and HC, which strengthens the assumption of WML formation being not primarily caused by ICAS, but mainly related to ageing effects.Acknowledgements
The authors highly appreciate the support of Mikkel Bo Hansen and Kim Mouridsen (Aarhus University) in the CTH map calculations. Furthermore, we acknowledge support by the Friedrich-Ebert-Stiftung, Dr.-Ing. Leonhard-Lorenz-Stiftung (grant SK 971/19) and the German research Foundation (DFG, grant PR 1039/6-1).References
1. Momjian-Mayor I, Baron JC. The pathophysiology of watershed infarction in internal carotid artery disease: review of cerebral perfusion studies. Stroke 2005;36:567-77.
2. Lin J, Wang D, Lan L, Fan Y. Multiple Factors Involved in the Pathogenesis of White Matter Lesions. Biomed Res Int 2017;2017:9372050.
3. Hwang TL, Close TP, Grego JM, Brannon WL, Gonzales F. Predilection of brain metastasis in gray and white matter junction and vascular border zones. Cancer 1996;77:1551-5.
4. de Groot JC, de Leeuw FE, Oudkerk M, et al. Cerebral white matter lesions and cognitive function: the Rotterdam Scan Study. Ann Neurol 2000;47:145-51.
5. Reginold W, Sam K, Poublanc J, Fisher J, Crawley A, Mikulis DJ. The efficiency of the brain connectome is associated with cerebrovascular reactivity in persons with white matter hyperintensities. Hum Brain Mapp 2019;40:3647-56.
6. Sam K, Conklin J, Holmes KR, et al. Impaired dynamic cerebrovascular response to hypercapnia predicts development of white matter hyperintensities. Neuroimage Clin 2016;11:796-801.
7. Sam K, Crawley AP, Poublanc J, et al. Vascular Dysfunction in Leukoaraiosis. AJNR Am J Neuroradiol 2016;37:2258-64.
8. Raz N, Yang Y, Dahle CL, Land S. Volume of white matter hyperintensities in healthy adults: contribution of age, vascular risk factors, and inflammation-related genetic variants. Biochim Biophys Acta 2012;1822:361-9.
9. Jespersen SN, Ostergaard L. The roles of cerebral blood flow, capillary transit time heterogeneity, and oxygen tension in brain oxygenation and metabolism. J Cereb Blood Flow Metab 2012;32:264-77.
10. Alexander AL, Lee JE, Lazar M, Field AS. Diffusion Tensor Imaging of the Brain. Neurotherapeutics : the journal of the American Society for Experimental NeuroTherapeutics 2007;4:316-29.
11. Alexander AL, Hurley SA, Samsonov AA, et al. Characterization of cerebral white matter properties using quantitative magnetic resonance imaging stains. Brain Connect 2011;1:423-46.
12. Berman SE, Wang X, Mitchell CC, et al. The relationship between carotid artery plaque stability and white matter ischemic injury. Neuroimage Clin 2015;9:216-22.
13. Kandiah N, Goh O, Mak E, Marmin M, Ng A. Carotid stenosis: a risk factor for cerebral white-matter disease. J Stroke Cerebrovasc Dis 2014;23:136-9.
14. Ammirati E, Moroni F, Magnoni M, et al. Relation between characteristics of carotid atherosclerotic plaques and brain white matter hyperintensities in asymptomatic patients. Sci Rep 2017;7:10559.
15. Potter GM, Doubal FN, Jackson CA, Sudlow CL, Dennis MS, Wardlaw JM. Lack of association of white matter lesions with ipsilateral carotid artery stenosis. Cerebrovasc Dis 2012;33:378-84.
16. Kaczmarz S, Griese V, Preibisch C, et al. Increased vaariability of watershed areas in patients with high-grade carotid stenosis. Neuroradiology 2018;60:311-23.
17. Mundiyanapurath S, Ringleb PA, Diatschuk S, et al. Capillary Transit Time Heterogeneity Is Associated with Modified Rankin Scale Score at Discharge in Patients with Bilateral High Grade Internal Carotid Artery Stenosis. PLoS One 2016;11:e0158148.
18. Schmidt P, Gaser C, Arsic M, et al. An automated tool for detection of FLAIR-hyperintense white-matter lesions in Multiple Sclerosis. Neuroimage 2012;59:3774-83.
19. Fazekas F, Chawluk JB, Alavi A, Hurtig HI, Zimmerman RA. MR signal abnormalities at 1.5 T in Alzheimer's dementia and normal aging. AJR Am J Roentgenol 1987;149:351-6.
20. SPM. Statistical Parametric Mapping software (SPM12) Version 6225: www.fil.ion.ucl.ac.uk/spm.
21. Woolrich MW, Jbabdi S, Patenaude B, et al. Bayesian analysis of neuroimaging data in FSL. Neuroimage 2009;45:S173-86.
22. Liao D, Cooper L, Cai J, et al. Presence and severity of cerebral white matter lesions and hypertension, its treatment, and its control. The ARIC Study. Atherosclerosis Risk in Communities Study. Stroke 1996;27:2262-70.
23. Guerrero R, Qin C, Oktay O, et al. White matter hyperintensity and stroke lesion segmentation and differentiation using convolutional neural networks. Neuroimage Clin 2018;17:918-34.
24. Feldman HM, Yeatman JD, Lee ES, Barde LH, Gaman-Bean S. Diffusion tensor imaging: a review for pediatric researchers and clinicians. J Dev Behav Pediatr 2010;31:346-56.
Figures