1445
Neurite density and myelination differences during normal aging assessed using multicomponent diffusion and relaxometry imaging1National Institute on Aging, Baltimore, MD, United States
Synopsis
While sensitive to microstructural changes, conventional quantitative MR techniques, such as diffusion tensor imaging, are not specific to underlying physiological mechanisms. Advanced multi-shell diffusion and multicomponent relaxometry analyses have been shown to provide more specific insights regarding microstructural differences with age and disease. In this study, we combined our multicomponent relaxometry method for myelin mapping and the neurite orientation dispersion and density imaging (NODDI) method to investigate neurite myelination and density in a cohort of cognitively unimpaired participants. Quadratic relationships were observed between neurite density and myelination, and age, in critical brain regions.
INTRODUCTION
Age is the main risk factor for degenerative central nervous system disease and associated cognitive and functional impairment. It is therefore of great interest to characterize microstructural changes in the brain that occur with normal aging. Conventional quantitative MRI techniques such as relaxation time measurement, DTI and magnetization transfer have provided pivotal insights into regional brain microstructural age-differences, but are not specific; this complicates interpretation of derived results. The development of MR methods based on multicomponent diffusion and relaxation to map neuronal density and myelination permit analyses that are much more specific to underlying biological processes. Our main goal in this study is to investigate age-related differences in neurite density and myelination in human brain. We combined BMC-mcDESPOT for mapping myelin water fraction (MWF) [1-3], a surrogate of myelin content, and NODDI for neurite density index (NDI) [4], to characterize the effect of age on white matter (WM) microstructure in a cohort of cognitively unimpaired subjects.METHODS
Subjects and Image AcquisitionFifty healthy volunteers (44.7±18.8 years, age range 21-83 years) including 27 males (47.5±19.7 years) and 23 females (42.4±17.9 years) were studied. Age was not statistically different between men and women. The imaging protocol consisted of:
· NODDI for NDI mapping: diffusion-weighted images (DWI) were acquired using a single-shot echo planar imaging sequence: TR/TE=10000/67 ms, two b-values of 700, and 2000 s/mm2 at 32 diffusion-weighting gradient directions with two b=0 images, acquisition voxel size 3×3×3 mm3.
· BMC-mcDESPOT for MWF mapping: ten 3D spoiled-gradient-recalled-echo (SPGR) images with flip angles (FAs) of [2 4 6 8 10 12 14 16 18 20]°, TR/TE=5/1.37 ms, and ten 3D balanced steady-state free-precession images with FAs of [2 7 11 16 24 32 40 60]°, TR/TE=5.8/2.8 ms, were acquired; radiofrequency excitation pulse phase increments of 0° or 180° were employed to account for off-resonance effects [5]. Images were acquired with a voxel size of 1.6×1.6×1.6 mm3. We used DAM to correct for B1 inhomogeneity [6]; this protocol consists of two fast spin-echo images acquired with FAs of 45° and 90°, TR/TE=3000/102 ms, and voxel size 2.6×2.6×4 mm3.
All images were obtained with a field-of-view of 240×208×150 mm3 and reconstructed to voxel size 2×2×2 mm3.
Image Processing and Statistical Analysis
NDI maps were derived from the NODDI dataset [4] while MWF maps were derived from the BMC-mcDESPOT datasets described above [1-3]. The averaged SPGR image over FAs was nonlinearly registered to the MNI space and the computed transformation matrix was then applied to the corresponding registered NDI and MWF maps using FSL software [7]. In addition to a whole brain WM mask, seven WM regions of interest (ROIs), including frontal, parietal, temporal and occipital lobes, cerebellum, internal capsule and corpus callosum, were selected from the MNI structural atlas [7]. To investigate age and sex effects on NDI and MWF in each ROI, linear regression analyses were performed using the mean value of NDI or MWF within each ROI as the dependent variable, and sex, age, and age2 as independent variables [8-10].
RESULTS & DISCUSSION
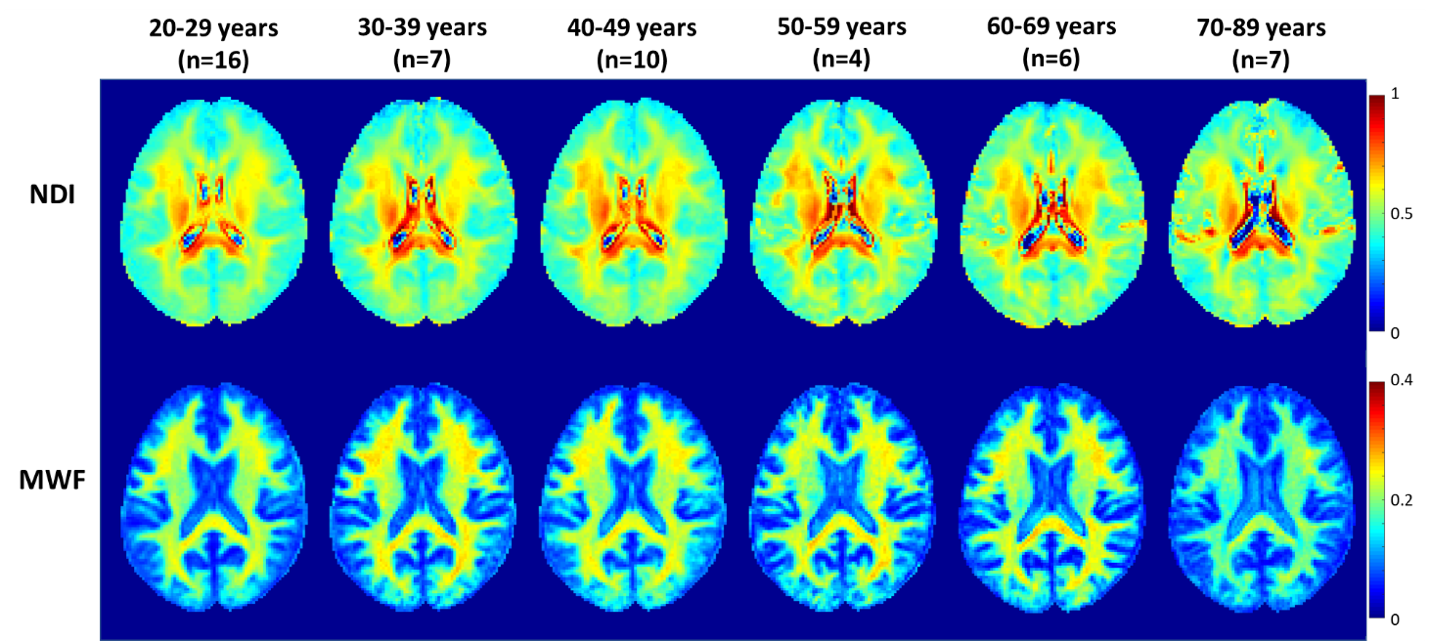
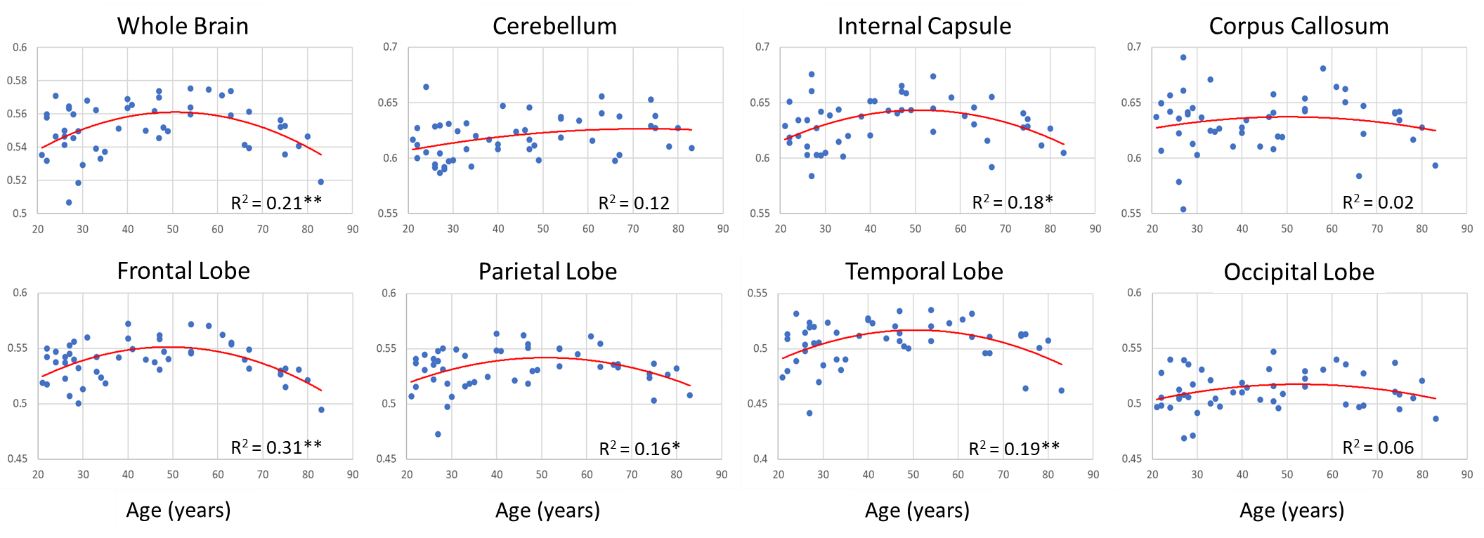
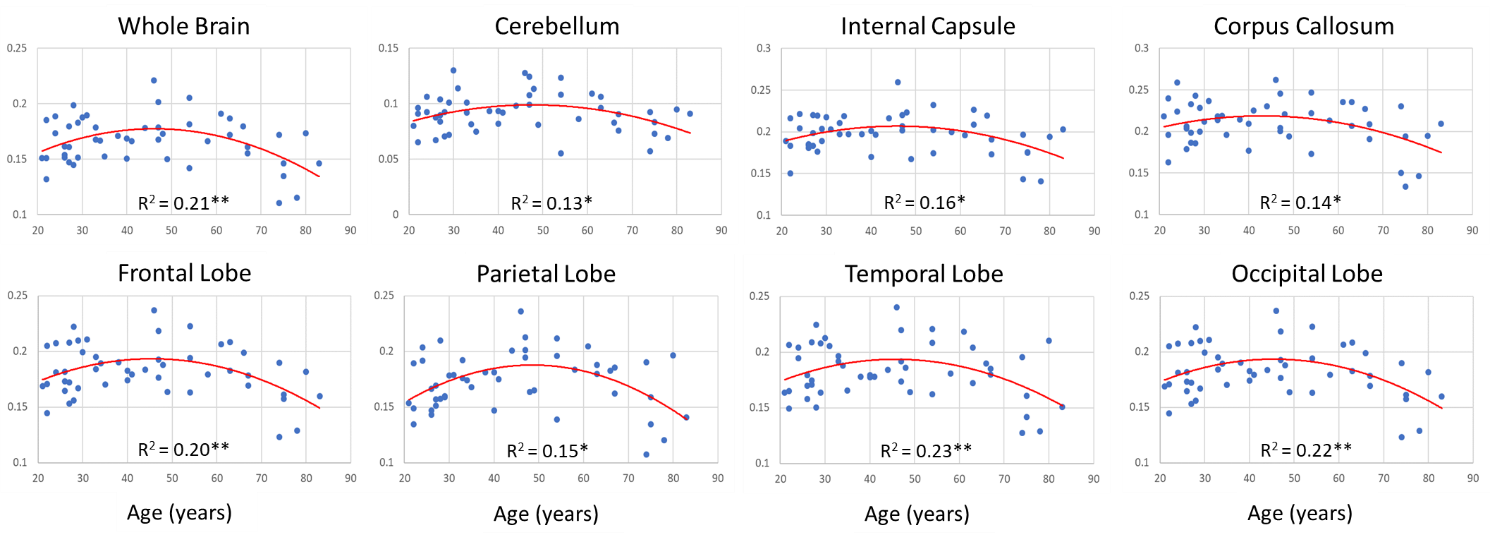
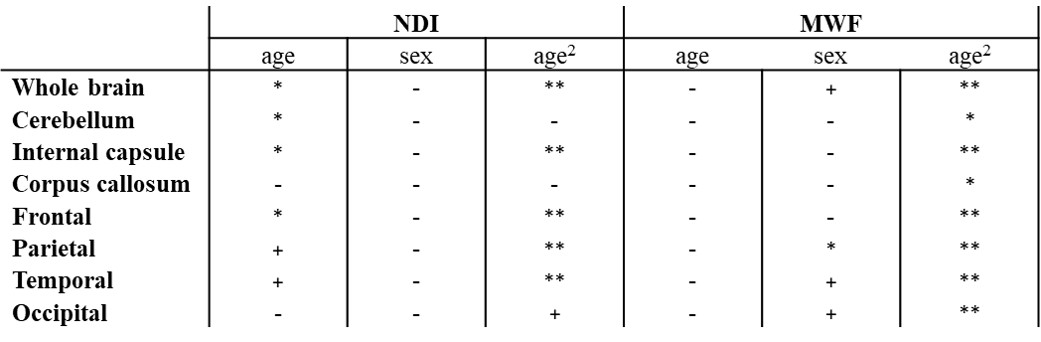
Figure 1 shows average NDI and MWF maps by age decade. Visual inspection indicates an increase in NDI and MWF values from early adulthood until middle age, followed by decreases in several brain regions. These results are quantified in Figures 2 and 3, showing NDI and MWF values as a function of age for the indicated WM regions. Similar age-related patterns were observed in all examined ROIs. The best-fit curves indicate that while the fundamental U-shaped relationships between NDI and MWF, and age, were consistent across ROIs, these patterns differed in detail among regions. Moreover, a significant age effect on NDI was found in most brain regions evaluated, in agreement with the literature [11, 12]. Similarly, the quadratic effect of age, age2, on NDI and MWF was significant (p < 0.05) or close to significance (p < 0.1) in most regions (Table 1). While the quadratic effect of age on MWF has been previously established [8, 10], to the best of our knowledge, the quadratic relationship between NDI and age has not been reported. These quadratic associations likely reflect brain maturation through middle age followed by a more rapid decrease in myelin and axonal density.No significant gender effect on NDI was found. In contrast, the effect of sex on MWF was significant or close to significance in several brain regions in which women exhibited greater myelin content. These consistent trends agree with previous literature [8, 10], indicating potential directions of exploration in larger cohorts. Indeed, the sex differences we observed in myelination are consistent with previous investigations on the gender difference of the regulation to oligodendrocytes and myelin proteins [13-16].
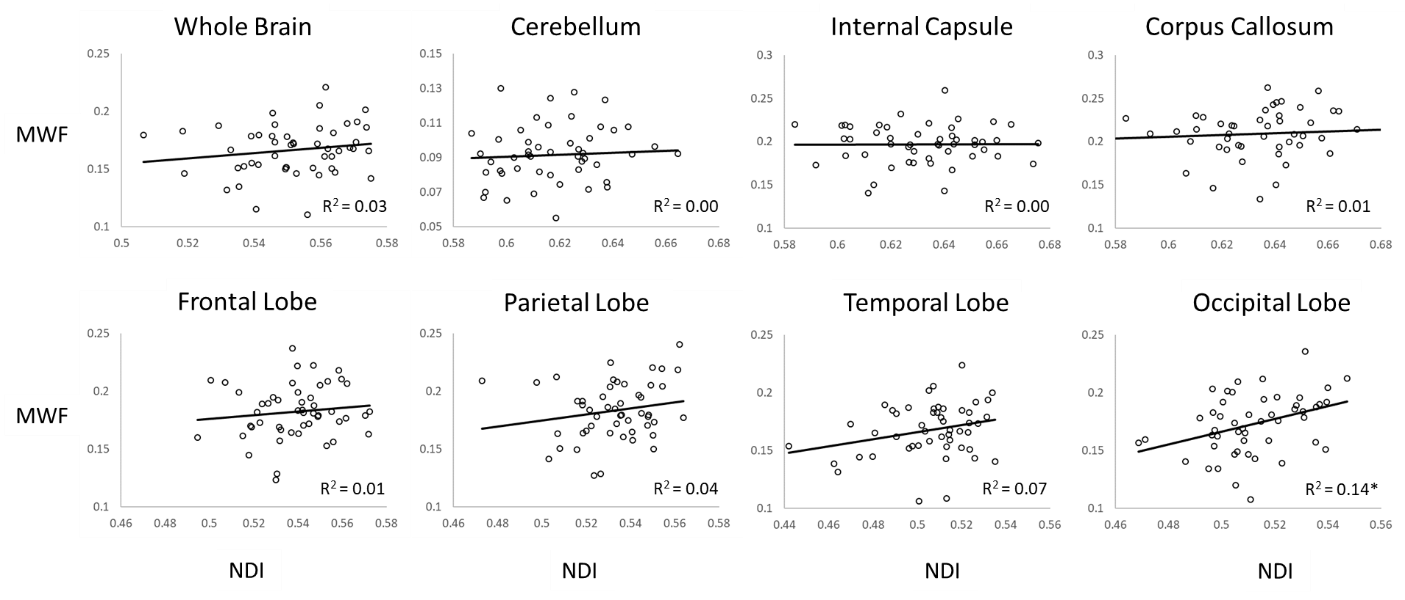
Figure 4 shows that the correlation between MWF and NDI is very limited throughout all ROIs. This illustrates the unique information these metrics provide and highlights the potential of NODDI and BMC-mcDESPOT to provide complementary insights.
CONCLUSIONS
We find that both neurite density and myelination follow quadratic, inverted U-shape, trends with age. NODDI and BMC-mcDESPOT provide complementary information regarding WM integrity.Acknowledgements
This work was supported by the Intramural Research Program of the National Institute on Aging of the National Institutes of Health.References
1. Bouhrara, M. and R.G. Spencer, Incorporation of nonzero echo times in the SPGR and bSSFP signal models used in mcDESPOT. Magn Reson Med, 2015. 74(5): p. 1227-35.
2. Bouhrara, M. and R.G. Spencer, Improved determination of the myelin water fraction in human brain using magnetic resonance imaging through Bayesian analysis of mcDESPOT. Neuroimage, 2016. 127: p. 456-471.
3. Bouhrara, M. and R.G. Spencer, Rapid simultaneous high-resolution mapping of myelin water fraction and relaxation times in human brain using BMC-mcDESPOT. Neuroimage, 2017. 147: p. 800-811.
4. Zhang, H., et al., NODDI: practical in vivo neurite orientation dispersion and density imaging of the human brain. Neuroimage, 2012. 61(4): p. 1000-16.
5. Deoni, S.C., Correction of main and transmit magnetic field (B0 and B1) inhomogeneity effects in multicomponent-driven equilibrium single-pulse observation of T1 and T2. Magn Reson Med, 2011. 65(4): p. 1021-35.
6. Stollberger, R. and P. Wach, Imaging of the active B1 field in vivo. Magn Reson Med, 1996. 35(2): p. 246-51.
7. Jenkinson, M., et al., FSL. Neuroimage, 2012. 62(2): p. 782-90.
8. Arshad, M., J.A. Stanley, and N. Raz, Adult age differences in subcortical myelin content are consistent with protracted myelination and unrelated to diffusion tensor imaging indices. Neuroimage, 2016. 143: p. 26-39.
9. Billiet, T., et al., Age-related microstructural differences quantified using myelin water imaging and advanced diffusion MRI. Neurobiol Aging, 2015. 36(6): p. 2107-21.
10. Bouhrara, M., et al., Adult brain aging investigated using BMC-mcDESPOT based myelin water fraction imaging. Neurobiology of Aging, 2019.
11. Merluzzi, A.P., et al., Age-dependent differences in brain tissue microstructure assessed with neurite orientation dispersion and density imaging. Neurobiol Aging, 2016. 43: p. 79-88.
12. Chang, Y.S., et al., White Matter Changes of Neurite Density and Fiber Orientation Dispersion during Human Brain Maturation. PLoS One, 2015. 10(6): p. e0123656.
13. Cerghet, M., et al., Proliferation and death of oligodendrocytes and myelin proteins are differentially regulated in male and female rodents. J Neurosci, 2006. 26(5): p. 1439-47.
14. Yang, S., et al., Sex differences in the white matter and myelinated nerve fibers of Long-Evans rats. Brain Res, 2008. 1216: p. 16-23.
15. Greer, J.M., et al., Effect of gender on T-cell proliferative responses to myelin proteolipid protein antigens in patients with multiple sclerosis and controls. J Autoimmun, 2004. 22(4): p. 345-52.
16. Marin-Husstege, M., et al., Oligodendrocyte progenitor proliferation and maturation is differentially regulated by male and female sex steroid hormones. Developmental Neuroscience, 2004. 26(2-4): p. 245-254.
Figures