1443
Effect of myelin integrity on rapid speed gait in normal aging1NIA, NIH, Baltimore, MD, United States
Synopsis
Microstructural
white matter (WM) degeneration has been shown to have a direct impact on mobility
performance. However, the association between speed gait and myelin changes is
less clear. This study examines the effect of myelin degeneration measured
using myelin water fraction (MWF), a specific proxy of myelin content, and
relaxation rates, sensitive but non-specific measures of myelin, on rapid gait
speed (RGS), which represents an integrated metric of physiologic function. Our
study is conducted on a large age-range cohort of cognitively unimpaired participants.
We show statistically significant correlations between MWF loss and RGS decline
in several WM structures.
PURPOSE
To investigate the potential correlation between demyelination and rapid gait speed (RGS) decline in a cohort of cognitively unimpaired subjects across a wide age range. We further evaluated correlations of different MRI metrics of myelin integrity (myelin water fraction, MWF, and longitudinal, R1, and transverse, R2, relaxation rates) to RGS differences in order to develop further insights into the effect of normal aging and myelin integrity on rapid walk performance, a well-known metric of integrated physical capability.METHODS
Subjects and MRIThe study cohort consisted of 72 participants (56.2±22.8years) of 35 women (51.3±20.7years) and 37 men (60.8±24.1years) spanning the age range between 22 and 94 years. Participants underwent a mini-mental state exam (MMSE score for women=28.8±1.6; MMSE men=28.1±1.7). Age and MMSE were not statistically different between men and women.
For each participant, ten 3D spoiled-gradient-recalled-echo (SPGR) images were acquired with flip angles (FAs) of [2 4 6 8 10 12 14 16 18 20]°, echo time of (TE) 1.37ms and repetition time (TR) of 5ms, and ten 3D balanced steady-state free-precession images were acquired with FAs of [2 7 11 16 24 32 40 60]°, TE of 2.8ms, TR of 5.8ms, and radiofrequency excitation pulse phase increments of 0o or 180o to account for off-resonance effects (1). All images were acquired with a voxel size of 1.6mm×1.6mm×1.6mm. Further, we used the DAM to correct for B1 inhomogeneity (2). The DAM protocol consists of two fast spin-echo images acquired with FAs of 45° and 90°, TE of 102ms, TR of 3s, and acquisition voxel size of 2.6mm×2.6mm×4mm. All images were obtained with a field-of-view of 240mm×208mm×150mm and reconstructed on the scanner to a voxel size of 1mm×1mm×1mm. The protocol for gait analysis used in our laboratory has been described elsewhere (3). Briefly, RGS was measured within three days of the MRI measurements; for this standardized test, participants are instructed to walk as quickly as possible over a 6m course in an uncarpeted straight corridor (3).
Image processing and statistical analysis
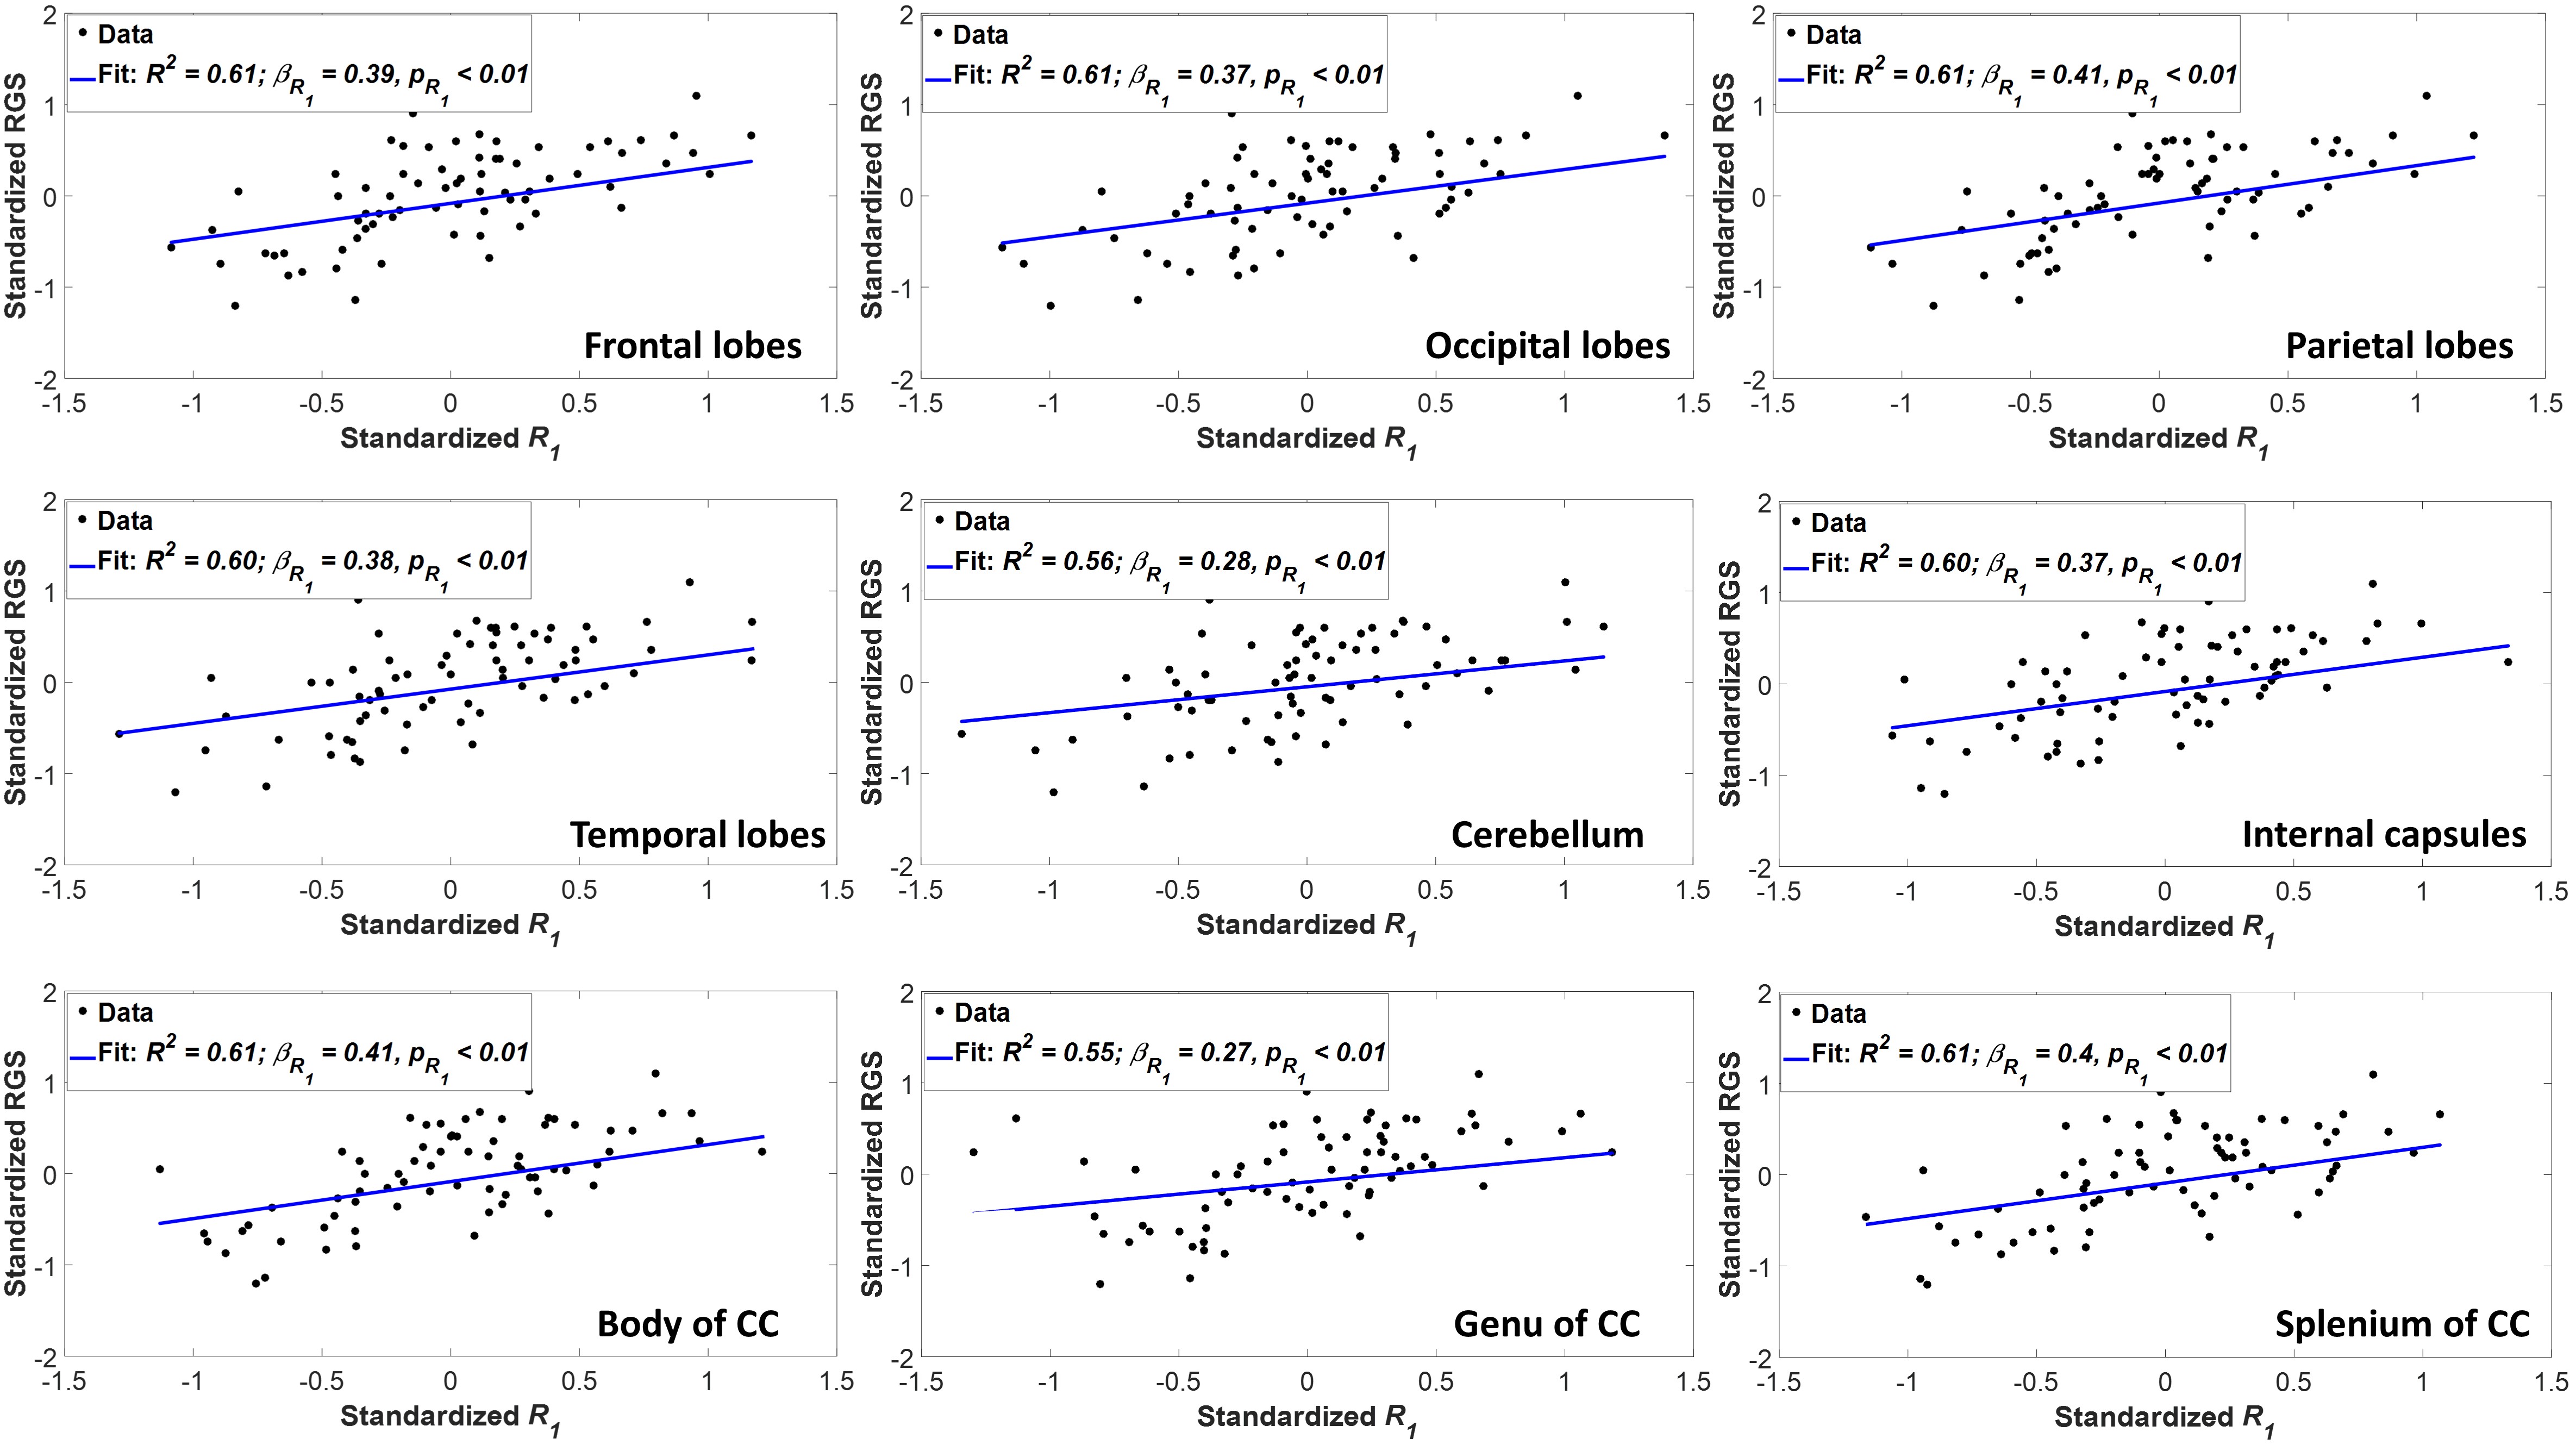
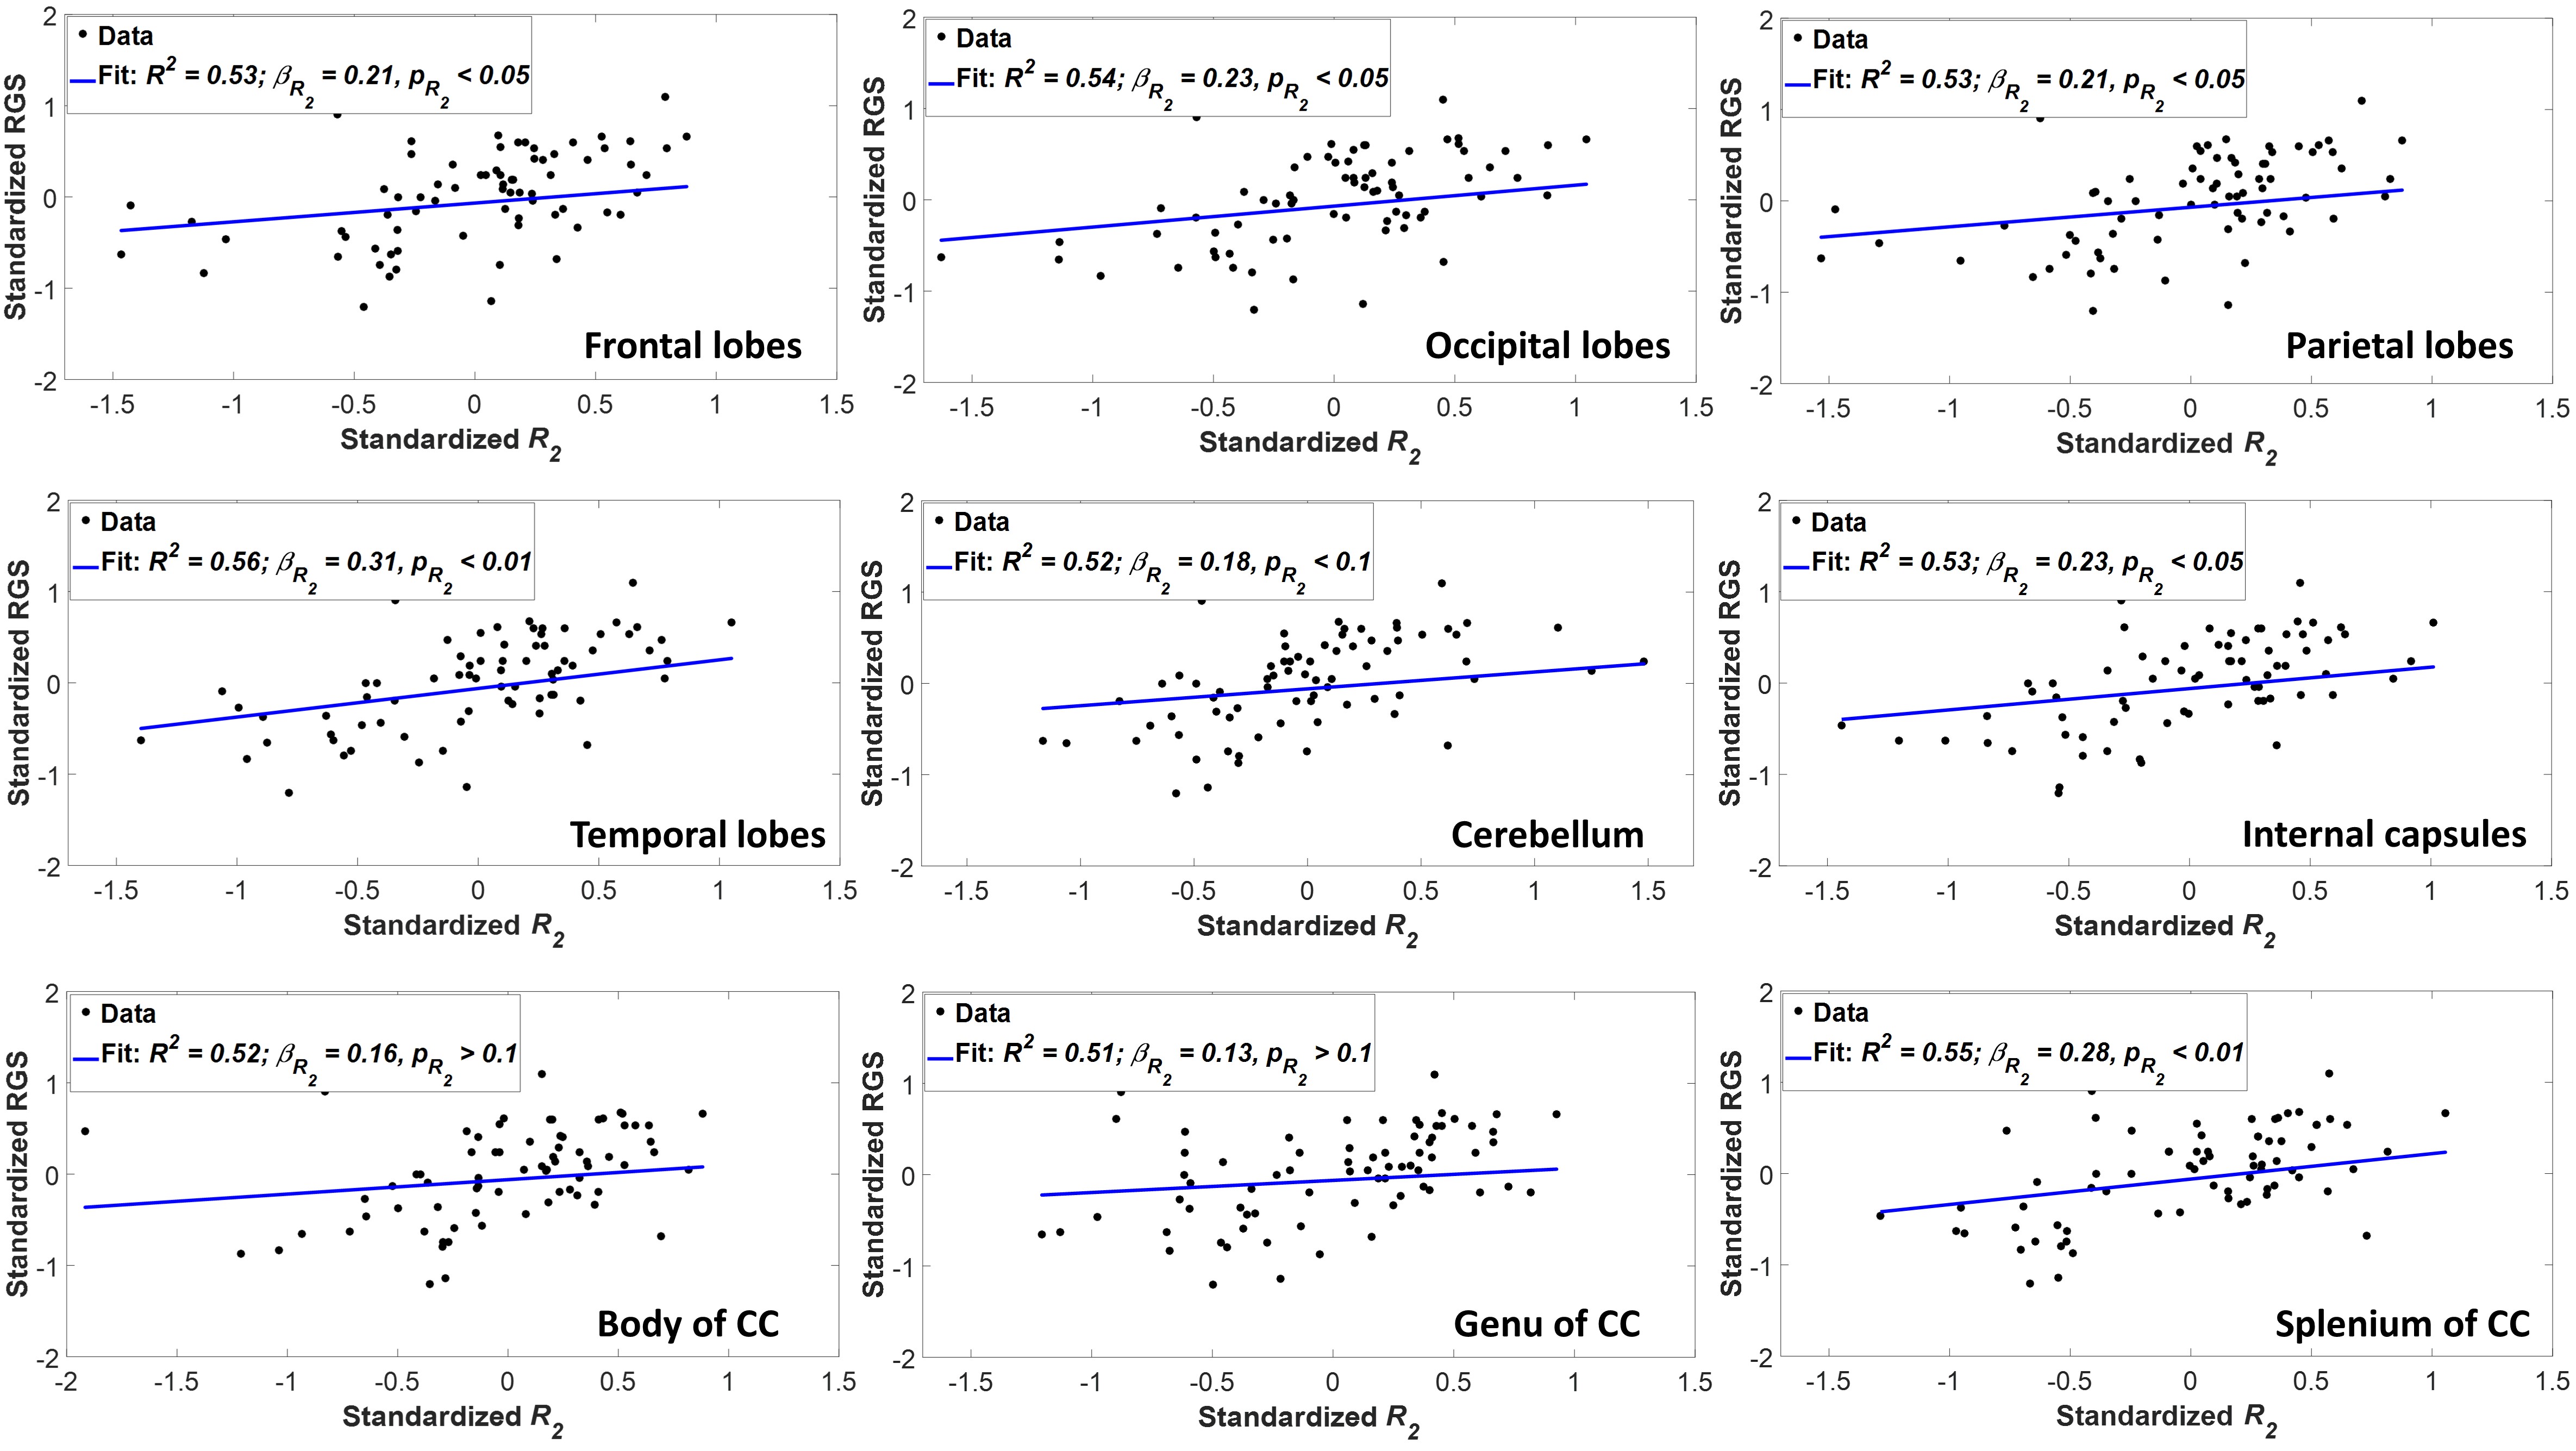
For each participant, a whole-brain MWF map was generated using the BMC-mcDESPOT analysis from the SPGR, bSSFP, an DAM images (4-6), an R1 map was generated from the SPGR and DAM images (7), and an R2 map was generated from the bSSFP and DAM images (7). Further, the averaged SPGR image over FAs was nonlinearly registered to the MNI space and the computed transformation matrix was then applied to the corresponding maps using FSL software (8). Nine WM regions of interest (ROIs) were defined from the MNI structural atlas (Fig. 1) (8). Finally, for each ROI, the effect of MWF, R1, or R2, on RGS was investigated using multiple linear regression with the mean RGS within the ROI as the dependent variable and the mean of MWF (R1 or R2) within the ROI as the independent variables, with sex, age, body mass index (BMI), and MMSE accounted for as covariates.
RESULTS & DISCUSSION
Figure 2 indicates the statistically significant positive correlation between RGS and MWF in most WM regions evaluated, indicating that decreases in MWF correspond to decreases in RGS. The results are in agreement with, and complementary to, previous DTI-based investigations showing that disrupted regional WM microstructural integrity affects stability and speed of walking in cognitively normal subjects (9-12). However, DTI-outcomes, including fractional anisotropy, while sensitive to microstructural changes, are not specific, so that potential microstructural correlates of the decline in RGS in these studies include not only myelin loss, but also axonal damage or other forms of neurodegeneration. Furthermore, most previous investigations focused on the association between WM microstructural changes and walking in patients with specific pathologies such as Parkinson’s disease, small vessel disease, and leukoaraiosis, with much more limited work conducted on persons free of overt neurological diseases. Therefore, our work adds new insights highlighting the specific implications of myelin loss for RGS decline.Overall, similar trends were observed between RGS and MWF, R1 and R2 (Figs. 2, 3 and 4). Unlike R1, R2 exhibited less significant correlations and moderate slopes in certain brain regions as compared to MWF-derived results (Fig. 2). This reflect the known sensitivity of R1 to lipids (13), the main constituent of myelin. This relationship between R1 and RGS serves as further evidence of the correlation between walking speed and myelination.
Our MWF and relaxation rates analyses indicate that brain structures other than the motor cortex can potentially affect walking speed; this is in agreement with previous studies (9-12). Indeed, the frontal, temporal, and occipital lobes, as well as the cerebellum and the internal capsules, are involved in processing and coordinating motor and sensory information, while the corpus callosum plays an essential role in integrating functions between hemispheres, including gait planning, and processing visuospatial information.
CONCLUSIONS
In this first study examining the association between myelin integrity and walking speed, we showed that decreases in myelination are associated with declining performance of RGS, a standardized integrative functional task, in a population subjects free of overt neurological diseases. MWF analysis of regional white matter integrity therefore provides significant insight into the pathophysiology of gait impairment in normative aging.Acknowledgements
This work was supported by the Intramural Research Program of the National Institute on Aging of the National Institutes of Health.References
1. Deoni SC. Correction of main and transmit magnetic field (B0 and B1) inhomogeneity effects in multicomponent-driven equilibrium single-pulse observation of T1 and T2. Magnetic resonance in medicine. 2011;65(4):1021-35.
2. Stollberger R, Wach P. Imaging of the active B1 field in vivo. Magnetic resonance in medicine. 1996;35(2):246-51.
3. Ko S, Ling SM, Winters J, Ferrucci L. Age-related mechanical work expenditure during normal walking: the Baltimore Longitudinal Study of Aging. Journal of biomechanics. 2009;42(12):1834-9.
4. Bouhrara M, Spencer RG. Incorporation of nonzero echo times in the SPGR and bSSFP signal models used in mcDESPOT. Magnetic resonance in medicine. 2015;74(5):1227-35.
5. Bouhrara M, Spencer RG. Improved determination of the myelin water fraction in human brain using magnetic resonance imaging through Bayesian analysis of mcDESPOT. NeuroImage. 2016;127:456-71.
6. Bouhrara M, Spencer RG. Rapid simultaneous high-resolution mapping of myelin water fraction and relaxation times in human brain using BMC-mcDESPOT. NeuroImage. 2017;147:800-11.
7. Deoni SC, Peters TM, Rutt BK. High-resolution T1 and T2 mapping of the brain in a clinically acceptable time with DESPOT1 and DESPOT2. Magnetic resonance in medicine. 2005;53(1):237-41.
8. Jenkinson M, Beckmann CF, Behrens TE, Woolrich MW, Smith SM. FSL. NeuroImage. 2012;62(2):782-90.
9. Tian Q, Ferrucci L, Resnick SM, Simonsick EM, Shardell MD, Landman BA, et al. The effect of age and microstructural white matter integrity on lap time variation and fast-paced walking speed. Brain imaging and behavior. 2016;10(3):697-706.
10. Poole VN, Wooten T, Iloputaife I, Milberg W, Esterman M, Lipsitz LA. Compromised prefrontal structure and function are associated with slower walking in older adults. NeuroImage: Clinical. 2018;20:620-6.
11. Ghanavati T, Smitt MS, Lord SR, Sachdev P, Wen W, Kochan NA, et al. Deep white matter hyperintensities, microstructural integrity and dual task walking in older people. Brain imaging and behavior. 2018;12(5):1488-96.
12. Bruijn SM, Van Impe A, Duysens J, Swinnen SP. White matter microstructural organization and gait stability in older adults. Frontiers in aging neuroscience. 2014;6:104-.
13. Deoni SC. Quantitative relaxometry of the brain. Topics in magnetic resonance imaging : TMRI. 2010;21(2):101-13.
Figures