1442
Evidence of association between regional cerebral blood flow deficits and demyelination in normal aging1NIA, NIH, Baltimore, MD, United States
Synopsis
Little is
known about the relationship between white matter (WM) perfusion and
microstructure across cognitively normal or impaired subjects. WM maintenance
through oligodendrocyte metabolism is an energy-intensive process, so that
myelin homeostasis is particularly sensitive to hypoxia, ischemia, or hypoperfusion.
In addition to substrate delivery, adequate cerebral blood flow (CBF) is
crucial for removal of metabolic byproducts. We investigated associations
between CBF deficits and myelin loss in multiple brain regions in a cohort of cognitively
unimpaired participants across a wide age range. We show significant correlations
between CBF deficits and myelin loss in critical brain structures.
PURPOSE
To investigate the potential association between CBF deficits and myelin loss in a cohort of cognitively unimpaired subjects across a wide age range. Our goals are to characterize regional associations between CBF decline, measured using the pseudo-continuous arterial spin labeling (pCASL) technique (1), and myelin content, measured using the BMC-mcDESPOT myelin water fraction (MWF) imaging technique (2-6) and longitudinal relaxation rate, R1, (7), in normal aging. These relationships provide further insights into the effect of normal aging and CBF deficits on myelin integrity.METHODS
Subjects and MRIThe study cohort consisted of 74 cognitively unimpaired participants (49.2±19.3 years, age range 22-88 years) consisted of 30 women (48.6±19.8 years) and 44 men (49.6±19.2 years). Age was not statistically different between men and women. The BMC-mcDESPOT and ASL protocols were as follow:
- BMC-mcDESPOT for MWF mapping and R1: ten 3D spoiled-gradient-recalled-echo (SPGR) images were acquired with flip angles (FAs) of [2 4 6 8 10 12 14 16 18 20]°, echo time of (TE) 1.37ms and repetition time (TR) of 5ms, and ten 3D balanced steady-state free-precession images were acquired with FAs of [2 7 11 16 24 32 40 60]°, TE of 2.8ms, TR of 5.8ms, and radiofrequency excitation pulse phase increments of 0o or 180o to account for off-resonance effects (8). All images were acquired with a voxel size of 1.6mm × 1.6mm × 1.6mm. The DAM was used to correct for B1 inhomogeneity (9). The DAM protocol consists of two fast spin-echo images acquired with FAs of 45° and 90°, TE of 102ms, TR of 3s, and acquisition voxel size of 2.6mm × 2.6mm × 4mm. All images were obtained with a field-of-view (FoV) of 240mm × 208mm × 150mm and reconstructed on the scanner to a voxel size of 1mm× 1mm × 1mm.
- pCASL for CBF mapping (1): control, labeled, and proton density (PD) images were acquired with incorporation of background suppression, FoV of 220mm x 210mm x 120mm, and spatial resolution of 2.5mmx2.5mmx5mm, and reconstruction to 1mmx1mmx1mm. Other experimental parameters were: TE of 15ms, TR of 7.5s, labeling duration of 1.8s, post-labeling duration of 2s, and 30 signal averages.
Image processing and statistical analysis
For each participant, a whole-brain MWF map was generated from the SPGR, bSSFP, and DAM datasets using BMC-mcDESPOT (4-6), a R1 map was generated from the SPGR and DAM datasets (7), and a CBF map was generated from the pCASL dataset using the NESMA analysis to improve accuracy and precision in CBF determination (10). Further, using the FSL software (11), the averaged SPGR image over FAs was nonlinearly registered to the MNI space and the computed transformation matrix was then applied to the corresponding MWF and R1 maps. Similarly, the PD image was nonlinearly registered to the MNI space and the computed transformation matrix was then applied to the corresponding CBF map. FAST segmentation was also performed to generate WM and cortical GM masks (11). Six regions of interest (ROIs) were defined from the MNI structural atlas corresponding to the whole brain, and the frontal, parietal, temporal and occipital lobes, and cerebellum. Within each ROI, the mean MWF, R1, and CBF values were calculated. Analysis was restricted to WM ROIs for MWF and to cortical GM or WM for CBF; this is due to the small amount of myelin in GM imposing a well-recognized challenge for accurate MWF determination. Finally, for each ROI, the effect of CBF on MWF or R1 was investigated using multiple linear regression with the mean MWF or R1 value as the dependent variable and the mean CBF value, sex, age, and age2 (12, 13) as the independent variables.
RESULTS & DISCUSSION
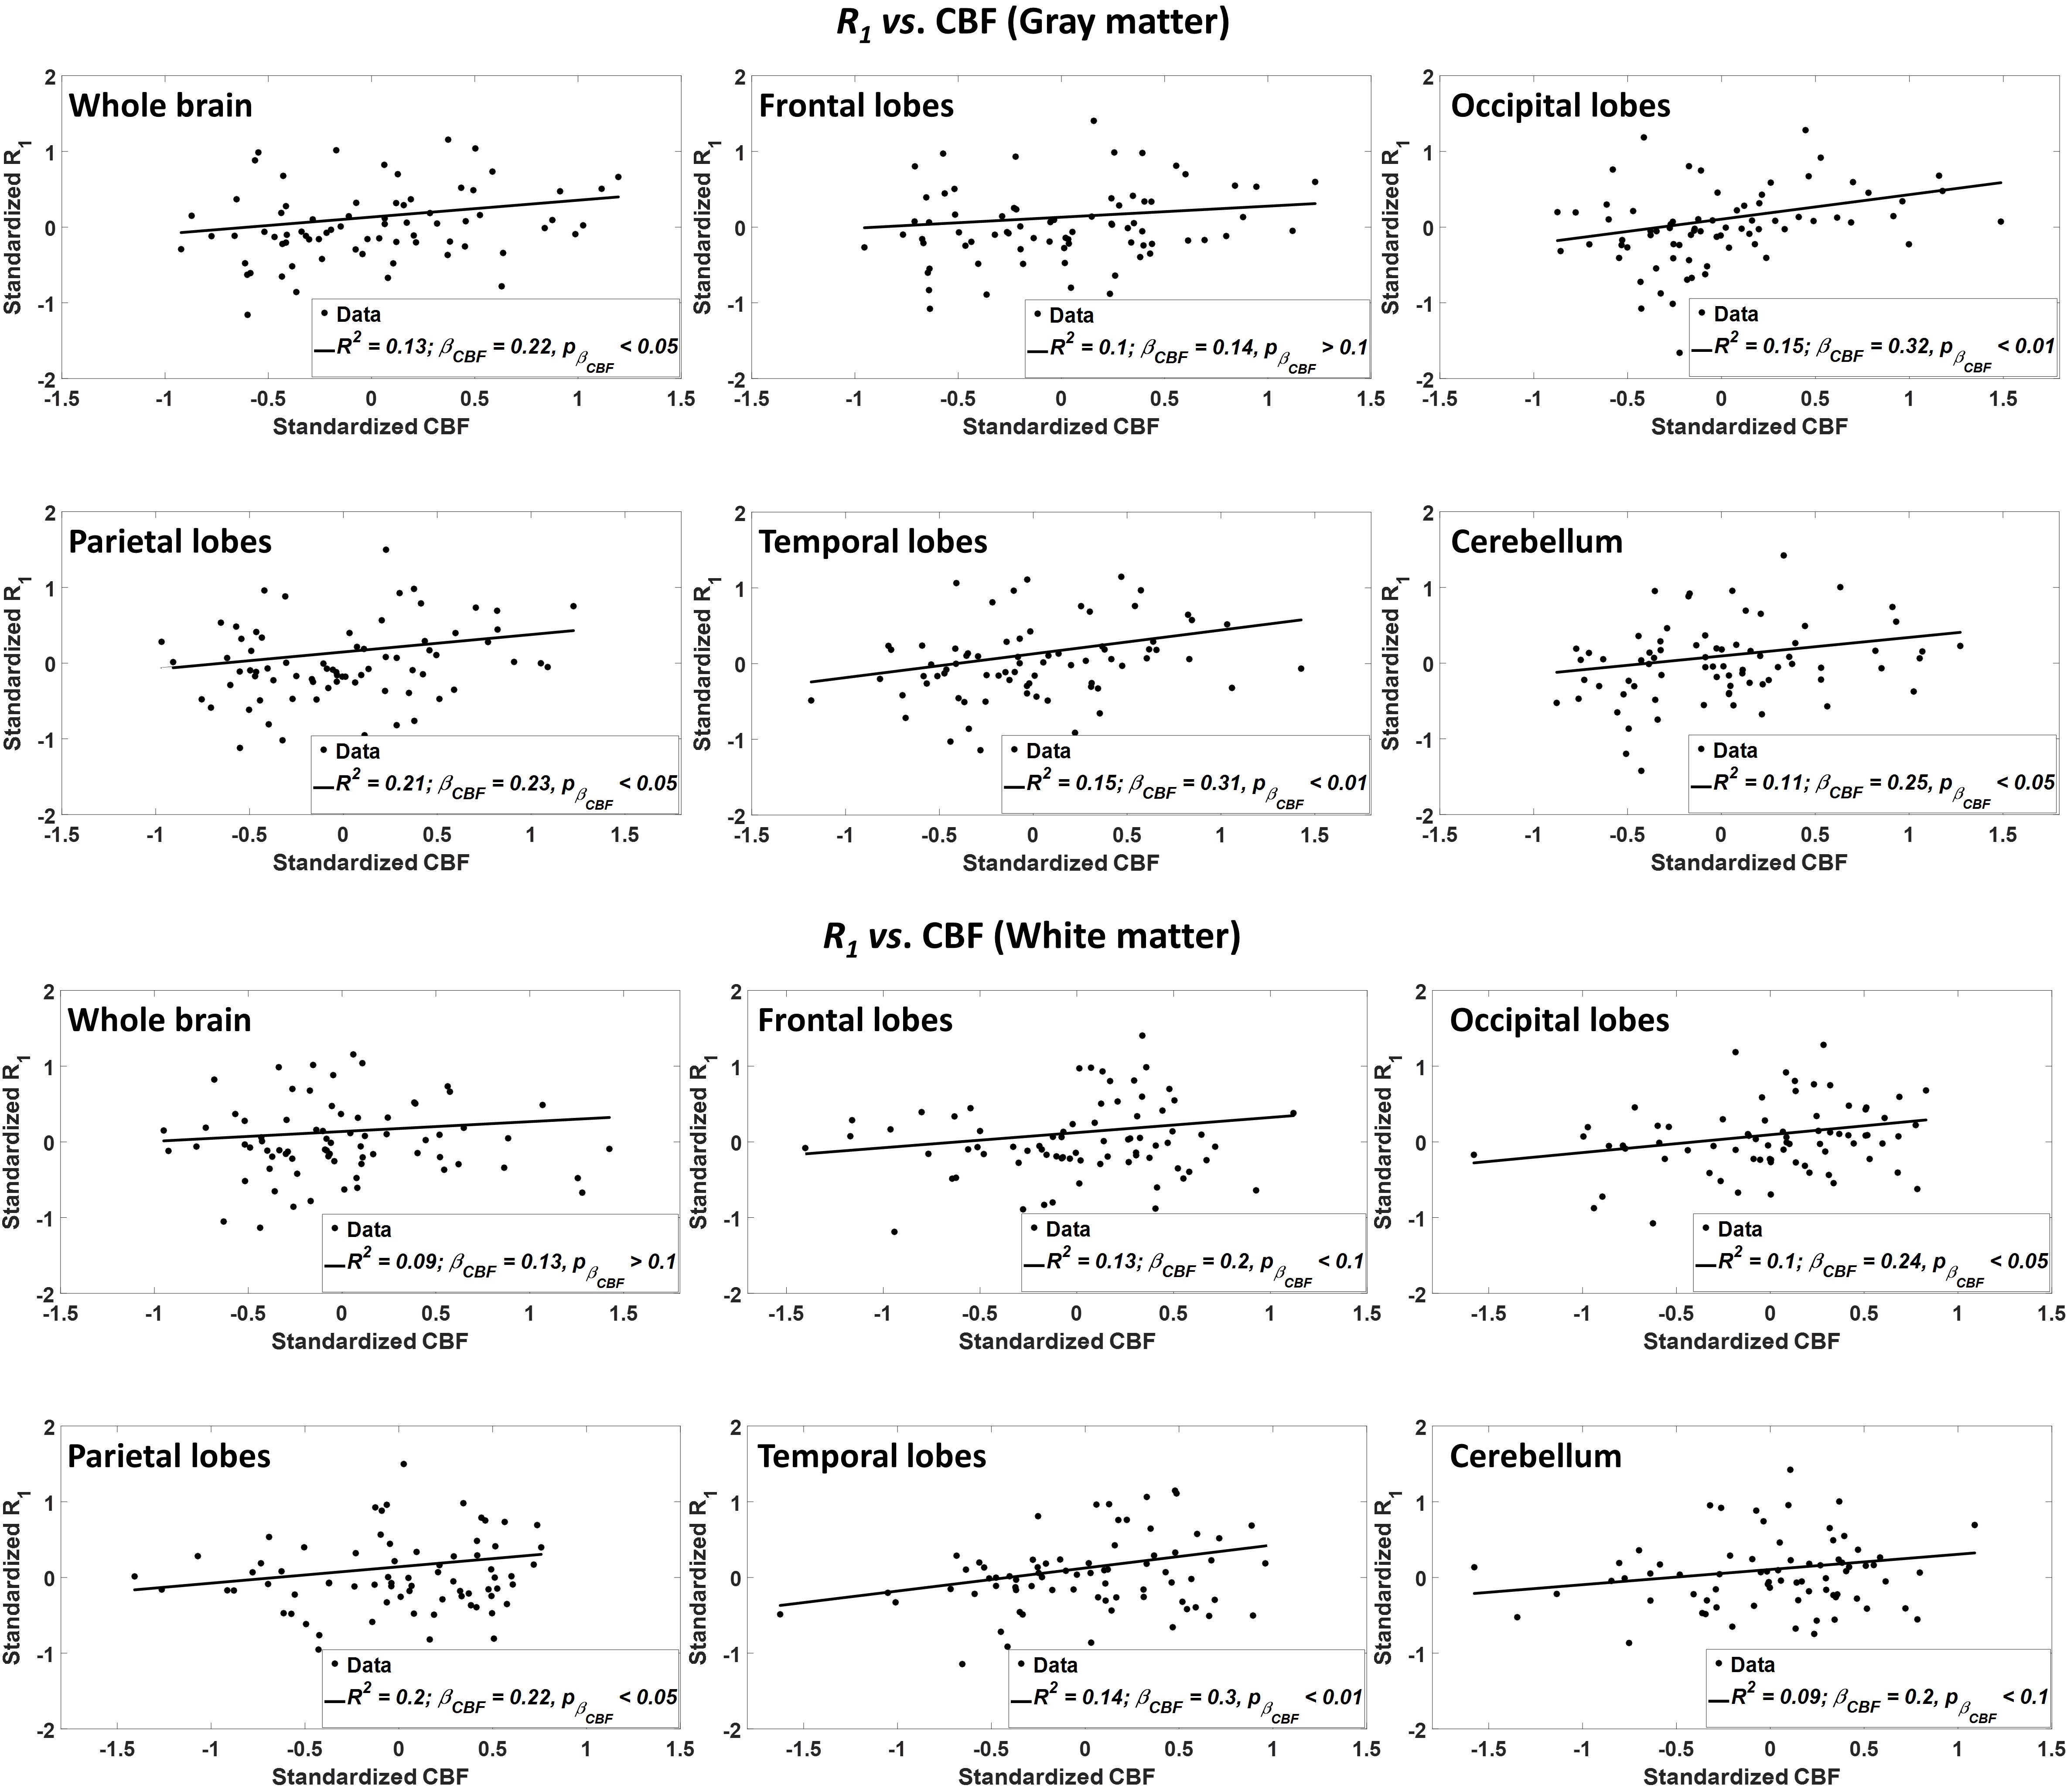
Figure 1 shows the regressions of MWF with CBF indicating a statistically significant positive correlation in most WM and GM brain regions studied. This indicates that decreased CBF corresponds to decreased MWF. These results agree with, and are complementary to, previous DTI-based investigations showing an association between reduced brain perfusion, and increased white matter lesion burden and decreased anisotropy of water diffusion. However, DTI-outcomes, including fractional anisotropy, while sensitive to microstructural changes, are not specific, so that potential microstructural correlates of the decline in CBF in these studies include not only myelin loss, but also axonal damage, or other forms of neurodegeneration. Our highlights the specific implication of CBF deficits for myelin loss. Indeed, this relationship between perfusion and myelination provides insights into the processes underlying demyelination and its potential role in neurodegenerative diseases, especially given the vulnerability of oligodendrocyte metabolism to local blood flow. These results indicate that interventions related to CBF may represent a novel therapeutic target in dementia.Figure 2 indicates the statistically significant decrease in R1 with CBF. This further supports our main hypothesis of a potential association between myelin breakdown with CBF decline (Fig. 1, CBF vs. MWF). Indeed, while not specific to myelin content, R1 is very sensitive to changes in lipid content (14), with lipid being the main constituent of myelin.
CONCLUSIONS
In this first study examining the association between CBF deficits and myelin integrity, we showed that myelin content declines with CBF across a wide age range of cognitively normal subjects.Acknowledgements
This work was supported by the Intramural Research Program of the National Institute on Aging of the National Institutes of Health.References
1. Alsop DC, Detre JA, Golay X, Günther M, Hendrikse J, Hernandez-Garcia L, et al. Recommended Implementation of Arterial Spin Labeled Perfusion MRI for Clinical Applications: A consensus of the ISMRM Perfusion Study Group and the European Consortium for ASL in Dementia. Magnetic resonance in medicine. 2015;73(1):102-16.
2. Bouhrara M, Reiter D, Bergeron C, Zukley L, Ferrucci L, Resnick S, et al. Evidence of demyelination in mild cognitive impairment and dementia using a direct and specific magnetic resonance imaging measure of myelin content. Alzheimer's & Dementia. 2018;14(8):998-1004.
3. Bouhrara M, Reiter DA, Celik H, Fishbein KW, Kijowski R, Spencer RG. Analysis of mcDESPOT- and CPMG-derived parameter estimates for two-component nonexchanging systems. Magnetic resonance in medicine. 2015.
4. Bouhrara M, Spencer RG. Incorporation of nonzero echo times in the SPGR and bSSFP signal models used in mcDESPOT. Magnetic resonance in medicine. 2015;74(5):1227-35.
5. Bouhrara M, Spencer RG. Improved determination of the myelin water fraction in human brain using magnetic resonance imaging through Bayesian analysis of mcDESPOT. NeuroImage. 2016;127:456-71.
6. Bouhrara M, Spencer RG. Rapid simultaneous high-resolution mapping of myelin water fraction and relaxation times in human brain using BMC-mcDESPOT. NeuroImage. 2017;147:800-11.
7. Deoni SC, Peters TM, Rutt BK. High-resolution T1 and T2 mapping of the brain in a clinically acceptable time with DESPOT1 and DESPOT2. Magnetic resonance in medicine. 2005;53(1):237-41.
8. Deoni SC. Correction of main and transmit magnetic field (B0 and B1) inhomogeneity effects in multicomponent-driven equilibrium single-pulse observation of T1 and T2. Magnetic resonance in medicine. 2011;65(4):1021-35.
9. Stollberger R, Wach P. Imaging of the active B1 field in vivo. Magnetic resonance in medicine. 1996;35(2):246-51.
10. Bouhrara M, Lee DY, Rejimon AC, Bergeron CM, Spencer RG. Spatially adaptive unsupervised multispectral nonlocal filtering for improved cerebral blood flow mapping using arterial spin labeling magnetic resonance imaging. Journal of Neuroscience Methods. 2018.
11. Jenkinson M, Beckmann CF, Behrens TE, Woolrich MW, Smith SM. FSL. NeuroImage. 2012;62(2):782-90.
12. Arshad M, Stanley JA, Raz N. Adult age differences in subcortical myelin content are consistent with protracted myelination and unrelated to diffusion tensor imaging indices. NeuroImage. 2016;143:26-39.
13. Bouhrara M, Rejimon AC, Cortina LE, Khattar N, Bergeron CM, Ferrucci L, et al. Adult brain aging investigated using BMC-mcDESPOT based myelin water fraction imaging. Neurobiology of aging. 2019.
14. Deoni SC. Quantitative relaxometry of the brain. Topics in magnetic resonance imaging : TMRI. 2010;21(2):101-13.
Figures