1441
Uncharted Waters: Insights From A 100-Subject Myelin Water Imaging Atlas1Physics and Astronomy, University of British Columbia, Vancouver, BC, Canada, 2Radiology, University of British Columbia, Vancouver, BC, Canada, 3International Collaboration on Repair Discoveries (ICORD), Vancouver, BC, Canada, 4Medicine (Neurology), University of British Columbia, Vancouver, BC, Canada, 5Pathology and Laboratory Medicine, University of British Columbia, Vancouver, BC, Canada, 6Biomedical Engineering, University of British Columbia, Vancouver, BC, Canada, 7Department of Physical Therapy, University of British Columbia, Vancouver, BC, Canada
Synopsis
Data from 100 healthy volunteers (58F/42M, mean age 41 years, range 20-78 years) scanned at 3.0T were used to create a structural template. Voxel-wise mean myelin water fraction (MWF) and intra/extracellular T2 (IET2) atlases were created, and 19 regions of interest were obtained using the joint label fusion framework. Pearson correlations with both age and sex were calculated for MWF and IET2. Mean MWF and IET2 demonstrated clear ranking between brain structures for different age groups, indicating that relative metric values are generally consistent between ROIs. There were no significant correlations between MWF or IET2 and sex.
Introduction
Myelin water imaging is a quantitative MRI technique that uses a multi-echo T2 relaxation experiment1 to characterise myelin. T2 relaxation in normal brain generally has three components: short T2 myelin water (T2<40ms), intermediate T2 intra/extracellular water (40ms < T2 < 200ms), and long T2 cerebrospinal fluid2. Myelin water fraction (MWF), the ratio of signal contribution from myelin water to total signal, has been histopathologically validated as an in-vivo biomarker for myelin3,4. The geometric mean T2 of intra/extracellular water (IET2) is sensitive to tissue water and iron, with higher values expected for higher water content5,6 and lower iron concentration6,7. Variation in MWF between white matter (WM) regions in the brain and between healthy individuals has been observed8,9.The purpose of this study was to investigate:
(1) the effect of age as an explanatory variable for the variation in MWF and IET2 between subjects and
(2) whether the ranking of MWF and IET2 between brain regions is consistent across age groups.
Methods
Data CollectionData was collected retrospectively from 100 healthy volunteers (58F/42M, mean age 41y, range 20-78y) scanned at 3.0T with an 8-channel head coil. Sagittal turbo field echo (3DT1) anatomical and 3D multi-echo gradient and spin-echo myelin water imaging (GRASE, TR/ΔTE=1073/8ms, 48 echoes, field-of-view 230x190x100mm3, acquired resolution 1x2x5mm3, reconstructed resolution 1x1x2.5mm3, time=7.5min) datasets were collected for each subject. T2 distributions were produced using regularized non-negative least-squares with stimulated echo correction10,11.
Atlas Creation
Advanced Normalization Tools (ANTs) software was used for atlas creation12. 3DT1 and GRASE echo 1 images underwent N4 bias field correction13 and brain extraction using Atropos n-tissue segmentation to refine the brain masks14. A structural template was created from unbiased co-registration of all 3DT1 brain images using iterative rigid, affine, and symmetric diffeomorphic normalization transformations. Rigid registration aligned GRASE echo 1 in 3DT1 space. GRASE-3DT1 and 3DT1-template transformations were concatenated to warp metric maps to template space, where voxel-wise mean MWF and IET2 atlases were created.
Analysis
Two subjects with incidental findings were excluded from the atlases and subsequent analyses. JHU-ICBM-DTI-81 WM labels were registered to each subject’s 3DT1 space15, then optimal regions of interest (ROIs) for our template were obtained using the joint label fusion framework16. Pearson correlations were calculated between age and mean metric values extracted from 18 WM ROIs, and 1 ROI encompassing deep and cortical grey matter (GM). Left/right ROI were combined because they did not differ significantly.
Results
Correlation coefficients between age and mean MWF and IET2 are presented in Table 1. Representative slices of the template and atlases are shown in Figure 1.MWF correlated significantly with age in the internal capsule (anterior r=0.359 p<0.001, posterior r=0.369 p<0.001, retro-lenticular r=0.306 p<0.01), external capsules (r=0.335 p<0.001), corpus callosum (body r=0.388 p<0.0001, splenium r=0.337 p<0.001), fornix (r=0.358 p<0.001), all WM ROIs combined (r=0.289 p<0.01), WM mask (r=0.326 p<0.01), and GM mask (r=0.403 p<0.0001).
IET2 correlated significantly with age in corpus callosum (genu r=0.623 p<0.0001, body r=0.437 p<0.0001, splenium r=0.290 p<0.01), corona radiata (all p<0.001), posterior thalamic radiation (r=0.478 p<0.0001), sagittal stratum (r=0.328 p<0.001), superior longitudinal fasciculus (r=0.469 p<0.0001), all WM ROIs combined (r=0.424 p<0.0001), and GM mask (r=-0.658 p<0.001).
For visual assessment, correlation values were assigned to their respective ROI mask and presented in Figure 2 for MWF and Figure 3 for IET2.
Mean MWF and mean IET2 from all subjects, grouped by decade of age, were plotted in Figure 4 to demonstrate the ranking of MWF and IET2 values between different ROI and age groups.
Discussion
Strong correlations between age and mean MWF (Table 1, Figure 2) are consistent with Billiet et al. investigating a smaller group9. Controlling for age can account for a significant amount of MWF and IET2 variation between subjects. Mean MWF and IET2 demonstrate clear ranking between brain structures for different age groups, indicating that relative metric values are generally consistent between ROIs. Offsets between ranking of subjects grouped by age further support the strength of the age-MWF and age-IET2 relationships.Excluding subjects aged <25 years (26 subjects) eliminated correlations in MWF but did not drastically change IET2 results. This suggests a rapid increase of MWF in the second decade of life, followed by a non-linear relationship when myelin content plateaus then decreases in later decades. Mean IET2 increases with age in most WM ROIs, possibly due to increased water content in the brain with age, and decreased in GM, possibly due to increasing iron concentration6,7. There were also generally no significant correlations between MWF or IET2 and sex, no significant differences in correlations between MWF and age when separated by the sexes, nor any significant multiple correlations between MWF or IET2, age, and sex.
Conclusion
This study demonstrates how age, but not sex, can be used to better characterise expected values for healthy subject MWF and IET2.Standardized collection of more demographic information, such as years of education, could prove similarly beneficial to developing expectations for myelin in the brain. These atlases provide templates for MWF and IET2 in healthy controls, which can be used to monitor myelin development or as a basis for comparison with demyelinating diseases, such as multiple sclerosis.
Acknowledgements
We would like to thank the participants for volunteering their time, and the UBC MRI Research Centre. Funding support for this study was provided by the MS Society of Canada and a Natural Sciences and Engineering Research Council of Canada (NSERC) Discovery Grant [F17-05113]. Taylor Swift-LaPointe was supported by an NSERC undergraduate student research award. Adam Dvorak is in receipt of a 4-Year Doctoral Fellowship from the University of British Columbia.References
1. MacKay, A., et al., In vivo visualization of myelin water in brain by magnetic resonance. Magn Reson Med, 1994. 31(6): p. 673-7.
2. Whittall, K.P., et al., In vivo measurement of T-2 distributions and water contents in normal human brain. Magnetic Resonance in Medicine, 1997. 37(1): p. 34-43.
3. Laule, C., et al., Myelin water imaging in multiple sclerosis: quantitative correlations with histopathology. Multiple Sclerosis, 2006. 12(6): p. 747-753.
4. Laule, C., et al., Myelin water imaging of multiple sclerosis at 7 T: Correlations with histopathology. Neuroimage, 2008. 40(4): p. 1575-1580.
5. Stanisz, G.J., et al., MR properties of excised neural tissue following experimentally induced inflammation. Magnetic Resonance in Medicine, 2004. 51(3): p. 473-479.
6. Whittall, K.P., et al., Normal-appearing white matter in multiple sclerosis has heterogeneous, diffusely prolonged T-2. Magnetic Resonance in Medicine, 2002. 47(2): p. 403-408.
7. Birkl, C., et al., The influence of brain iron on myelin water imaging. Neuroimage, 2019. 199: p. 545-552.
8. Faizy, T.D., et al., Age-Related Measurements of the Myelin Water Fraction derived from 3D multi-echo GRASE reflect Myelin Content of the Cerebral White Matter. Scientific Reports, 2018. 8.
9. Billiet, T., et al., Age-related microstructural differences quantified using myelin water imaging and advanced diffusion MRI. Neurobiology of Aging, 2015. 36(6): p. 2107-2121.
10. Prasloski, T., et al., Applications of stimulated echo correction to multicomponent T2 analysis. Magn Reson Med, 2012. 67(6): p. 1803-14.
11. Yoo, Y.J., et al., Fast Computation of Myelin Maps From MRI T-2 Relaxation Data Using Multicore CPU and Graphics Card Parallelization. Journal of Magnetic Resonance Imaging, 2015. 41(3): p. 700-707.
12. Avants, B.B., et al., A reproducible evaluation of ANTs similarity metric performance in brain image registration. Neuroimage, 2011. 54(3): p. 2033-2044.
13. Tustison, N.J., et al., N4ITK: Improved N3 Bias Correction. Ieee Transactions on Medical Imaging, 2010. 29(6): p. 1310-1320.
14. Avants, B.B., et al., An open source multivariate framework for n-tissue segmentation with evaluation on public data. Neuroinformatics, 2011. 9(4): p. 381-400.
15. Hua, K., et al., Tract probability maps in stereotaxic spaces: analyses of white matter anatomy and tract-specific quantification. Neuroimage, 2008. 39(1): p. 336-47.
16. Wang, H. and P.A. Yushkevich, Multi-atlas segmentation with joint label fusion and corrective learning-an open source implementation. Front Neuroinform, 2013. 7: p. 27.
Figures
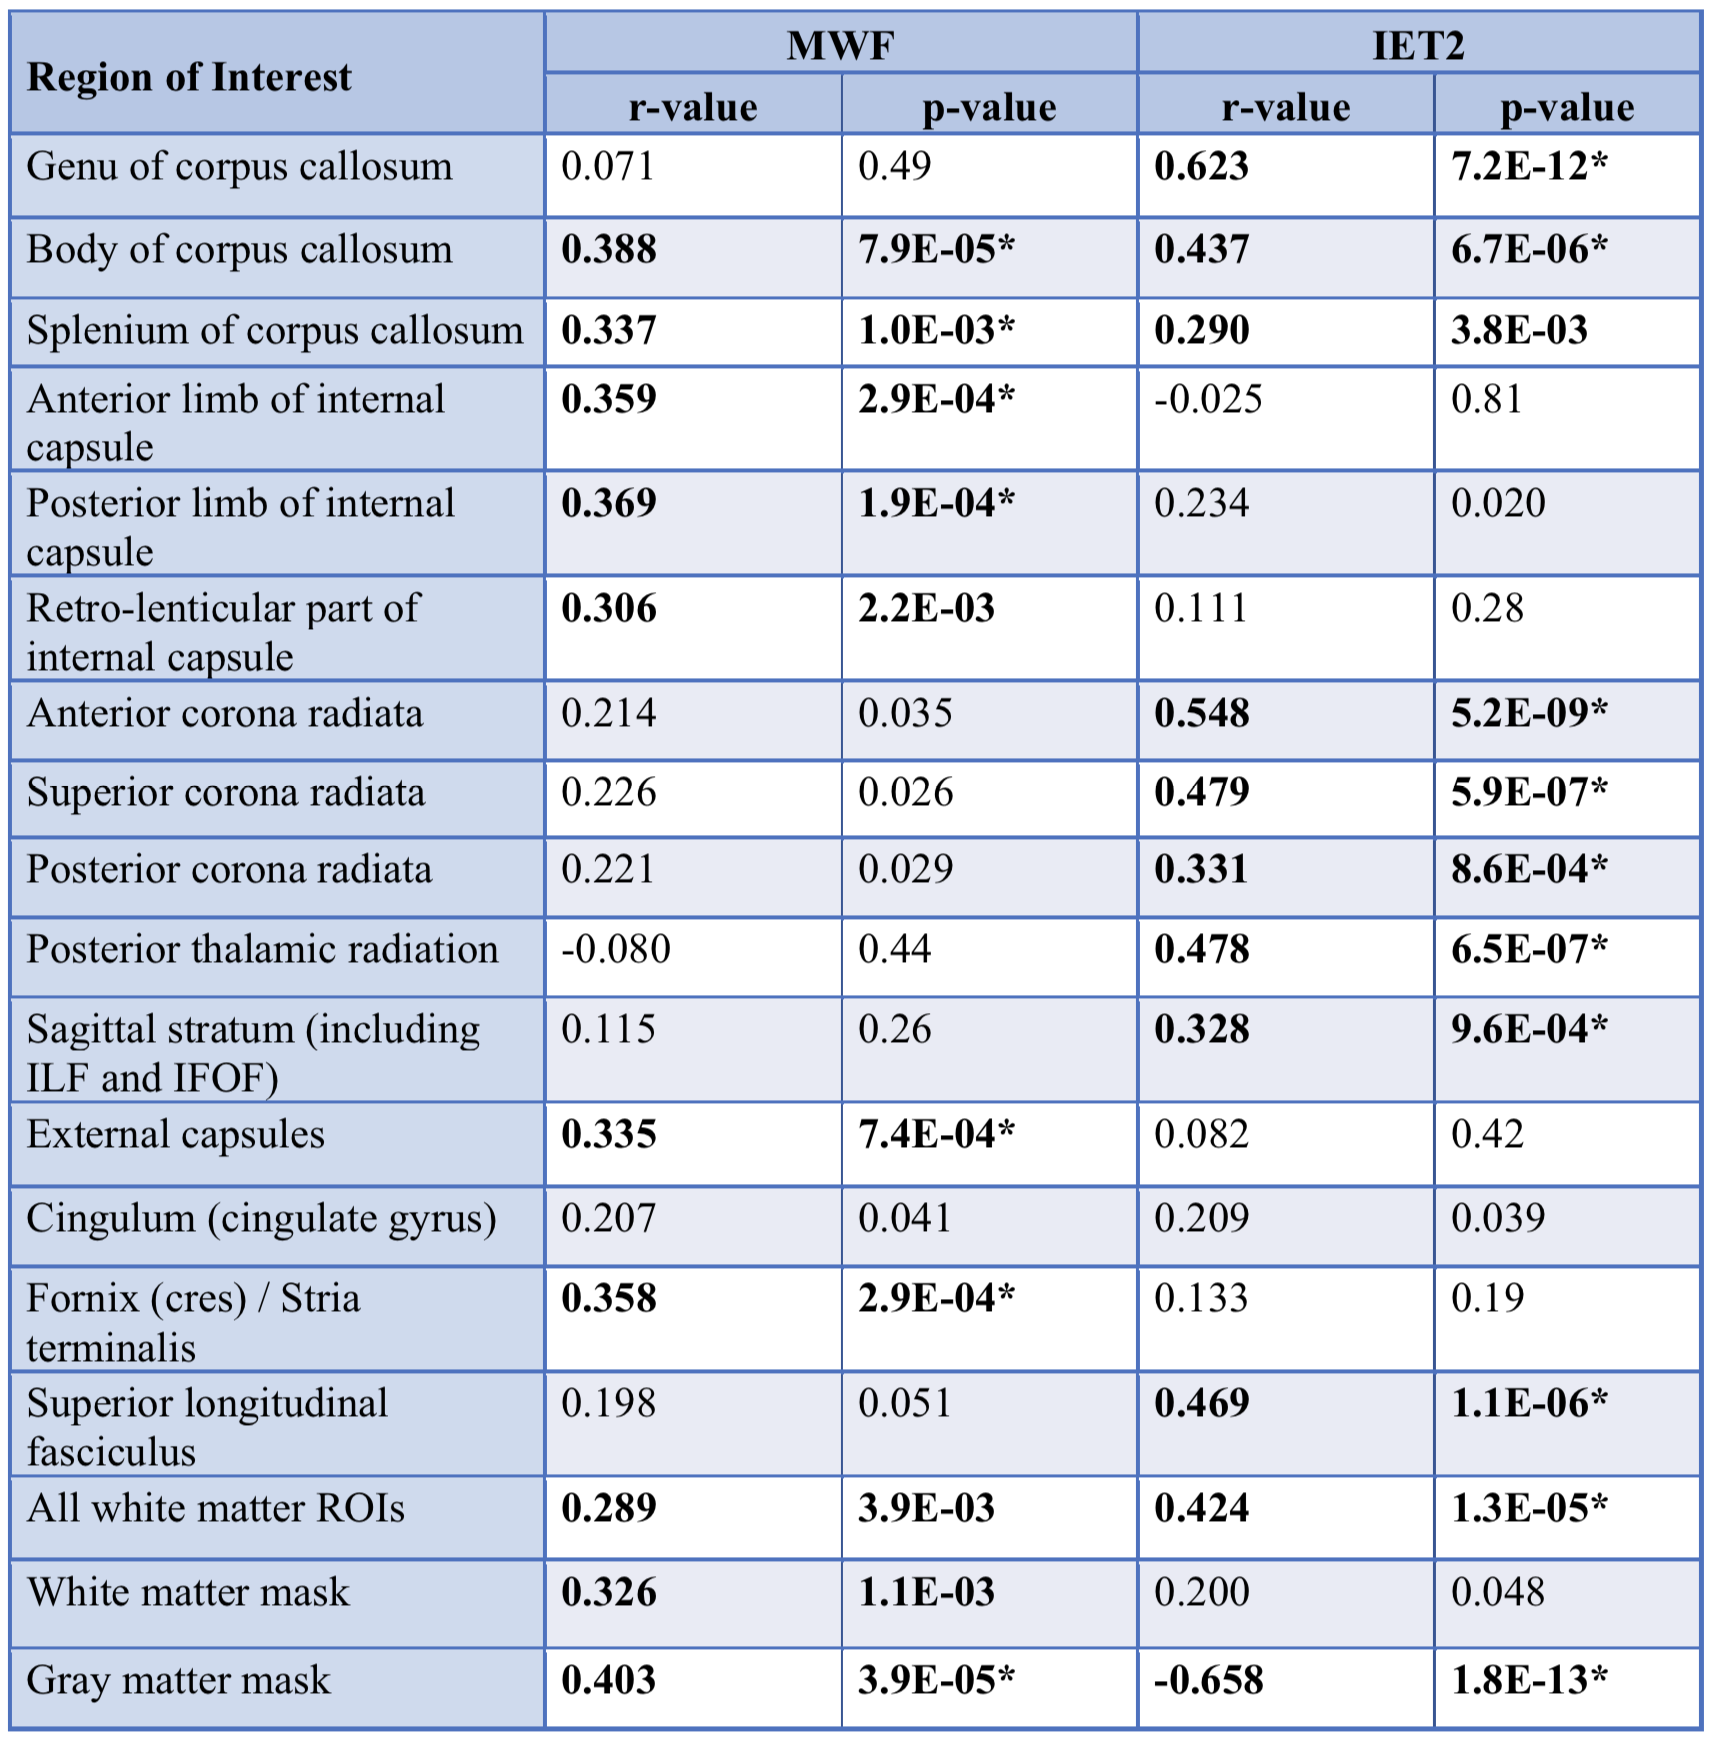
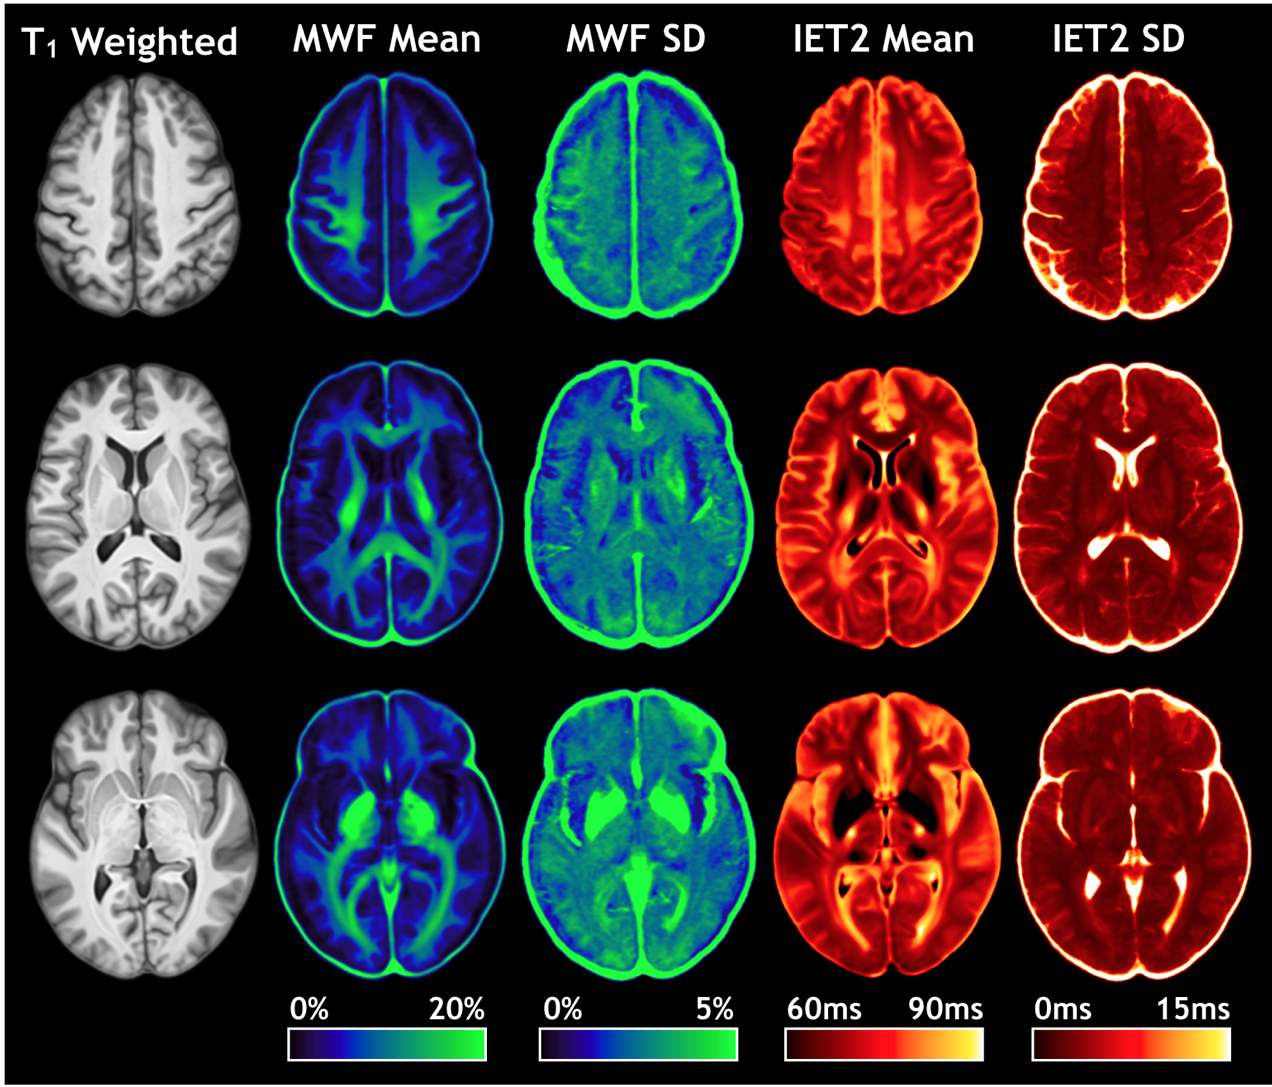
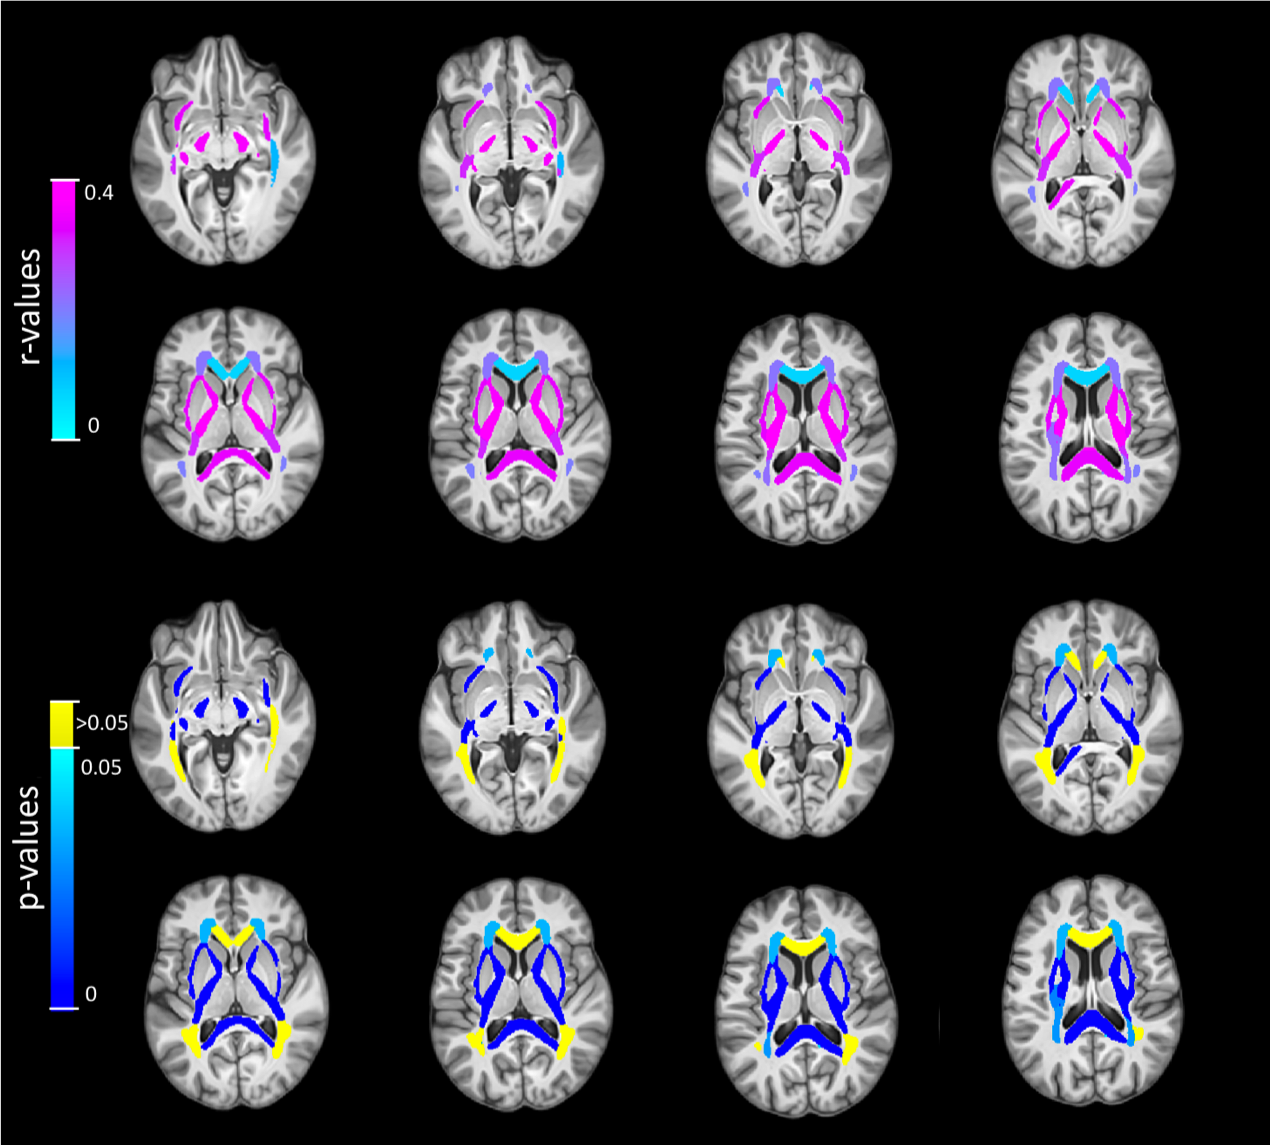
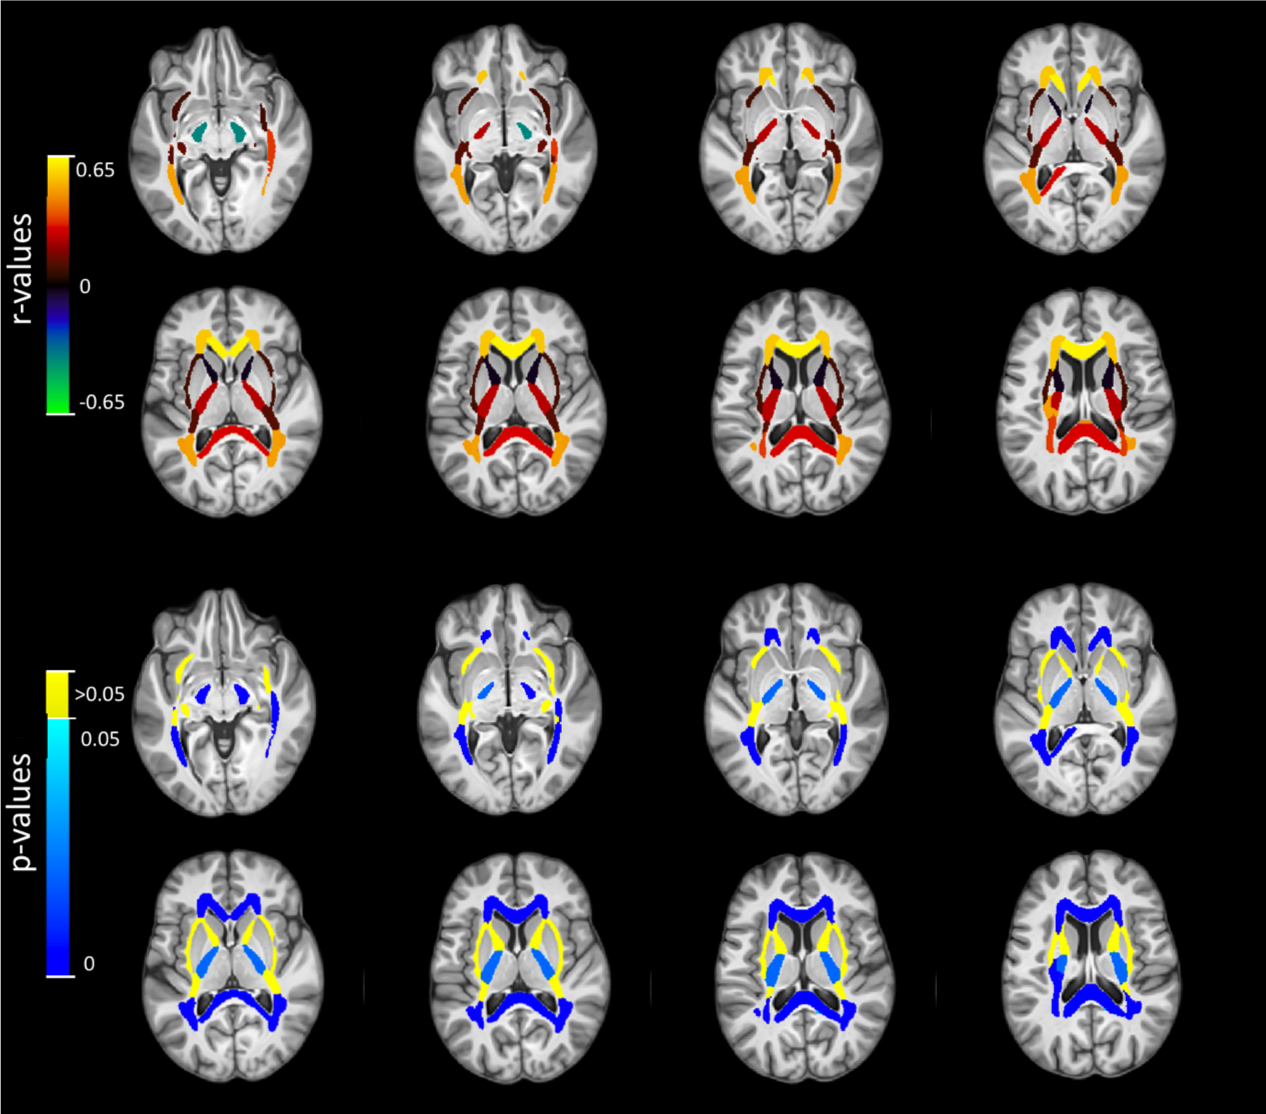
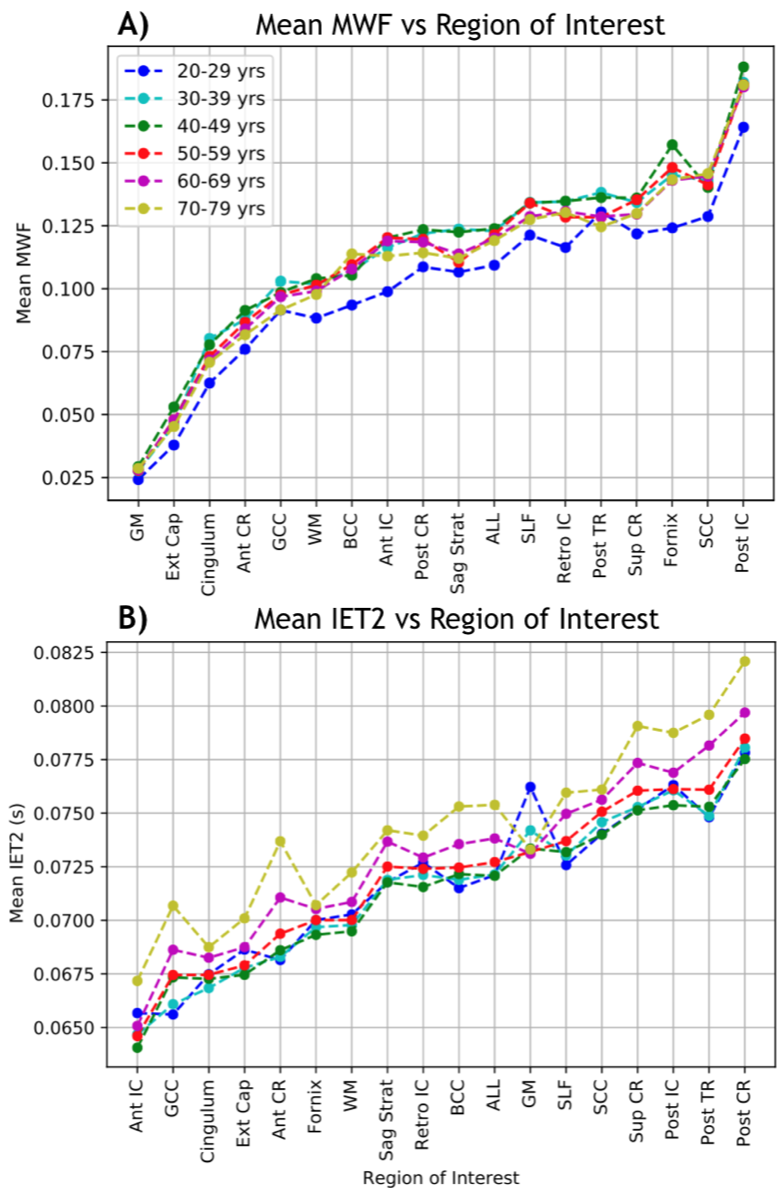
Figure 4: Rank of average A) myelin water fraction (MWF) and B) geometric mean T2 of intra/extra-cellular water (IET2) for subjects grouped by decade of age within:
gray/white matter (GM/WM), external capsules (Ext Cap), cingulum, anterior/posterior/superior corona radiata (Ant/Post/Sup CR), anterior/posterior/retrolenticular internal capsule (Ant/Post/Retro IC), sagittal stratum (Sag Strat), all JHU labels (ALL), superior longitudinal fasciculus (SLF), posterior thalamic radiation (Post TR), fornix (Fornix), and genu/body/splenium of corpus callosum (G/B/S CC).