1438
Longitudinal follow-up of MS active lesions with 3D inhomogeneous Magnetization Transfer (ihMT)1Aix-Marseille Univ, CNRS, CRMBM, Marseille, France, 2APHM, Hôpital Universitaire Timone, CEMEREM, Marseille, France, 3APHM, Hôpital Universitaire Timone, Service de neurologie, Marseille, France, 4Division of MR Research, Radiology, Beth Israel Deaconess Medical Center, Harvard Medical School, Boston, MA, United States
Synopsis
Assessment of lesion evolution in Multiple Sclerosis (MS) is critical to monitor the disease progression but remains challenging in clinical practice. Inhomogeneous magnetization transfer (ihMT) is a promising technique that has demonstrated sensitivity to demyelination in preclinical and clinical studies. In this work, a 3D ihMT technique was integrated as part of a multiparametric MRI protocol and applied to active MS lesion follow up over a period of six months. Variations of ihMT ratio were compared to those of conventional magnetization transfer imaging and diffusion tensor imaging often used in clinical research to assess demyelination.
Introduction
Despite the development of advanced quantitative MRI methods such as relaxometry-based imaging techniques1, magnetization transfer imaging2-4, susceptibility-based imaging techniques5,6 and diffusion tensor imaging7, the assessment of pathological brain tissues and the monitoring of lesion evolution in Multiple Sclerosis (MS) remain challenging in clinical practice8.The inhomogeneous magnetization transfer (ihMT) technique9 whose contrast relies on its capacity to isolate the contribution of dipolar order effects10,11, was previously proposed as a new myelin imaging technique12, sensitive to MS pathology13. In this work, we aim at evaluating the potential of a sensitivity-enhanced 3D ihMT-GRE14 sequence for monitoring and characterizing the evolution of active MS lesions, as part of a multiparametric MRI protocol. A comparison with a conventional clinical MT sequence and diffusion tensor imaging (DTI) was performed.
Materials and methods
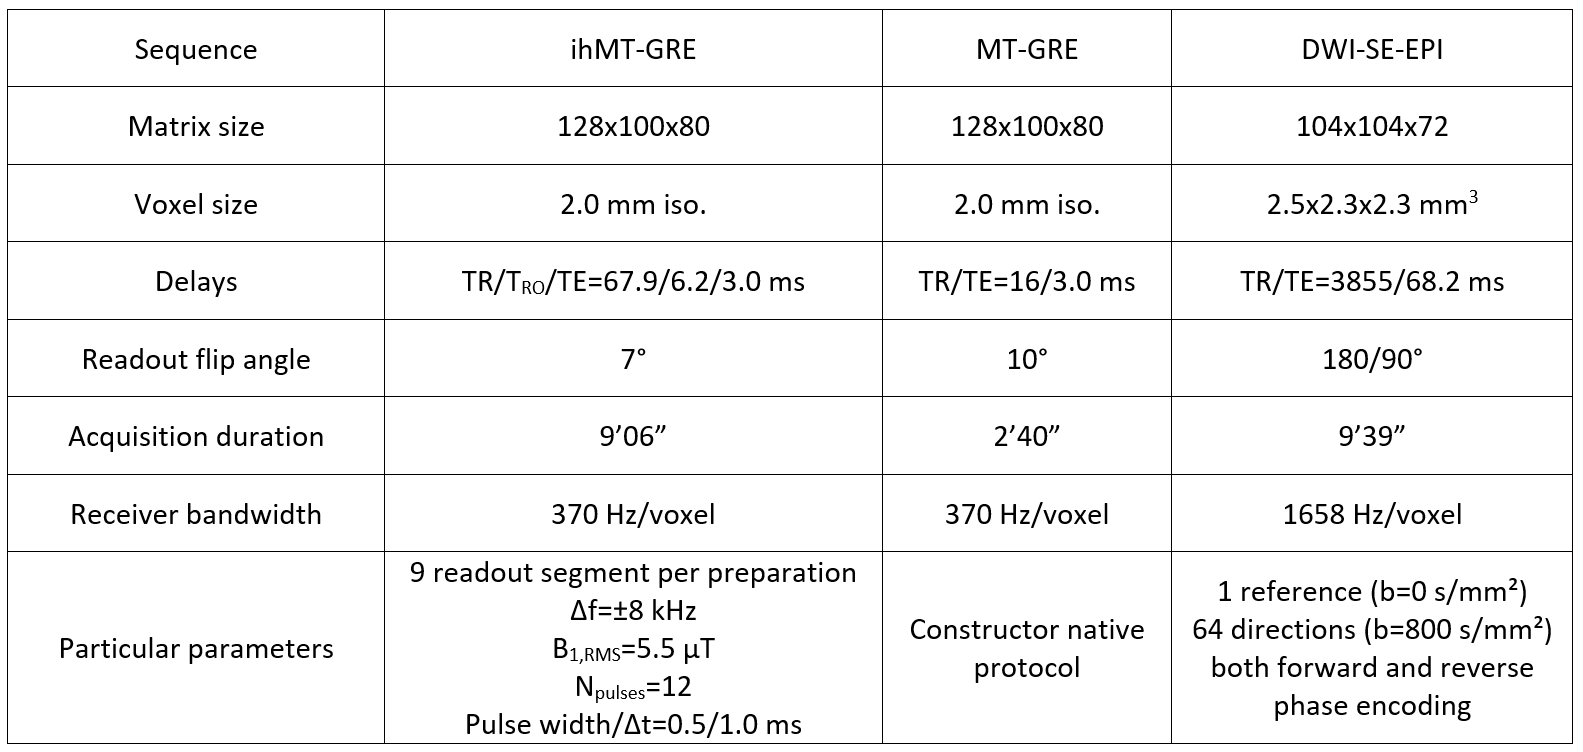
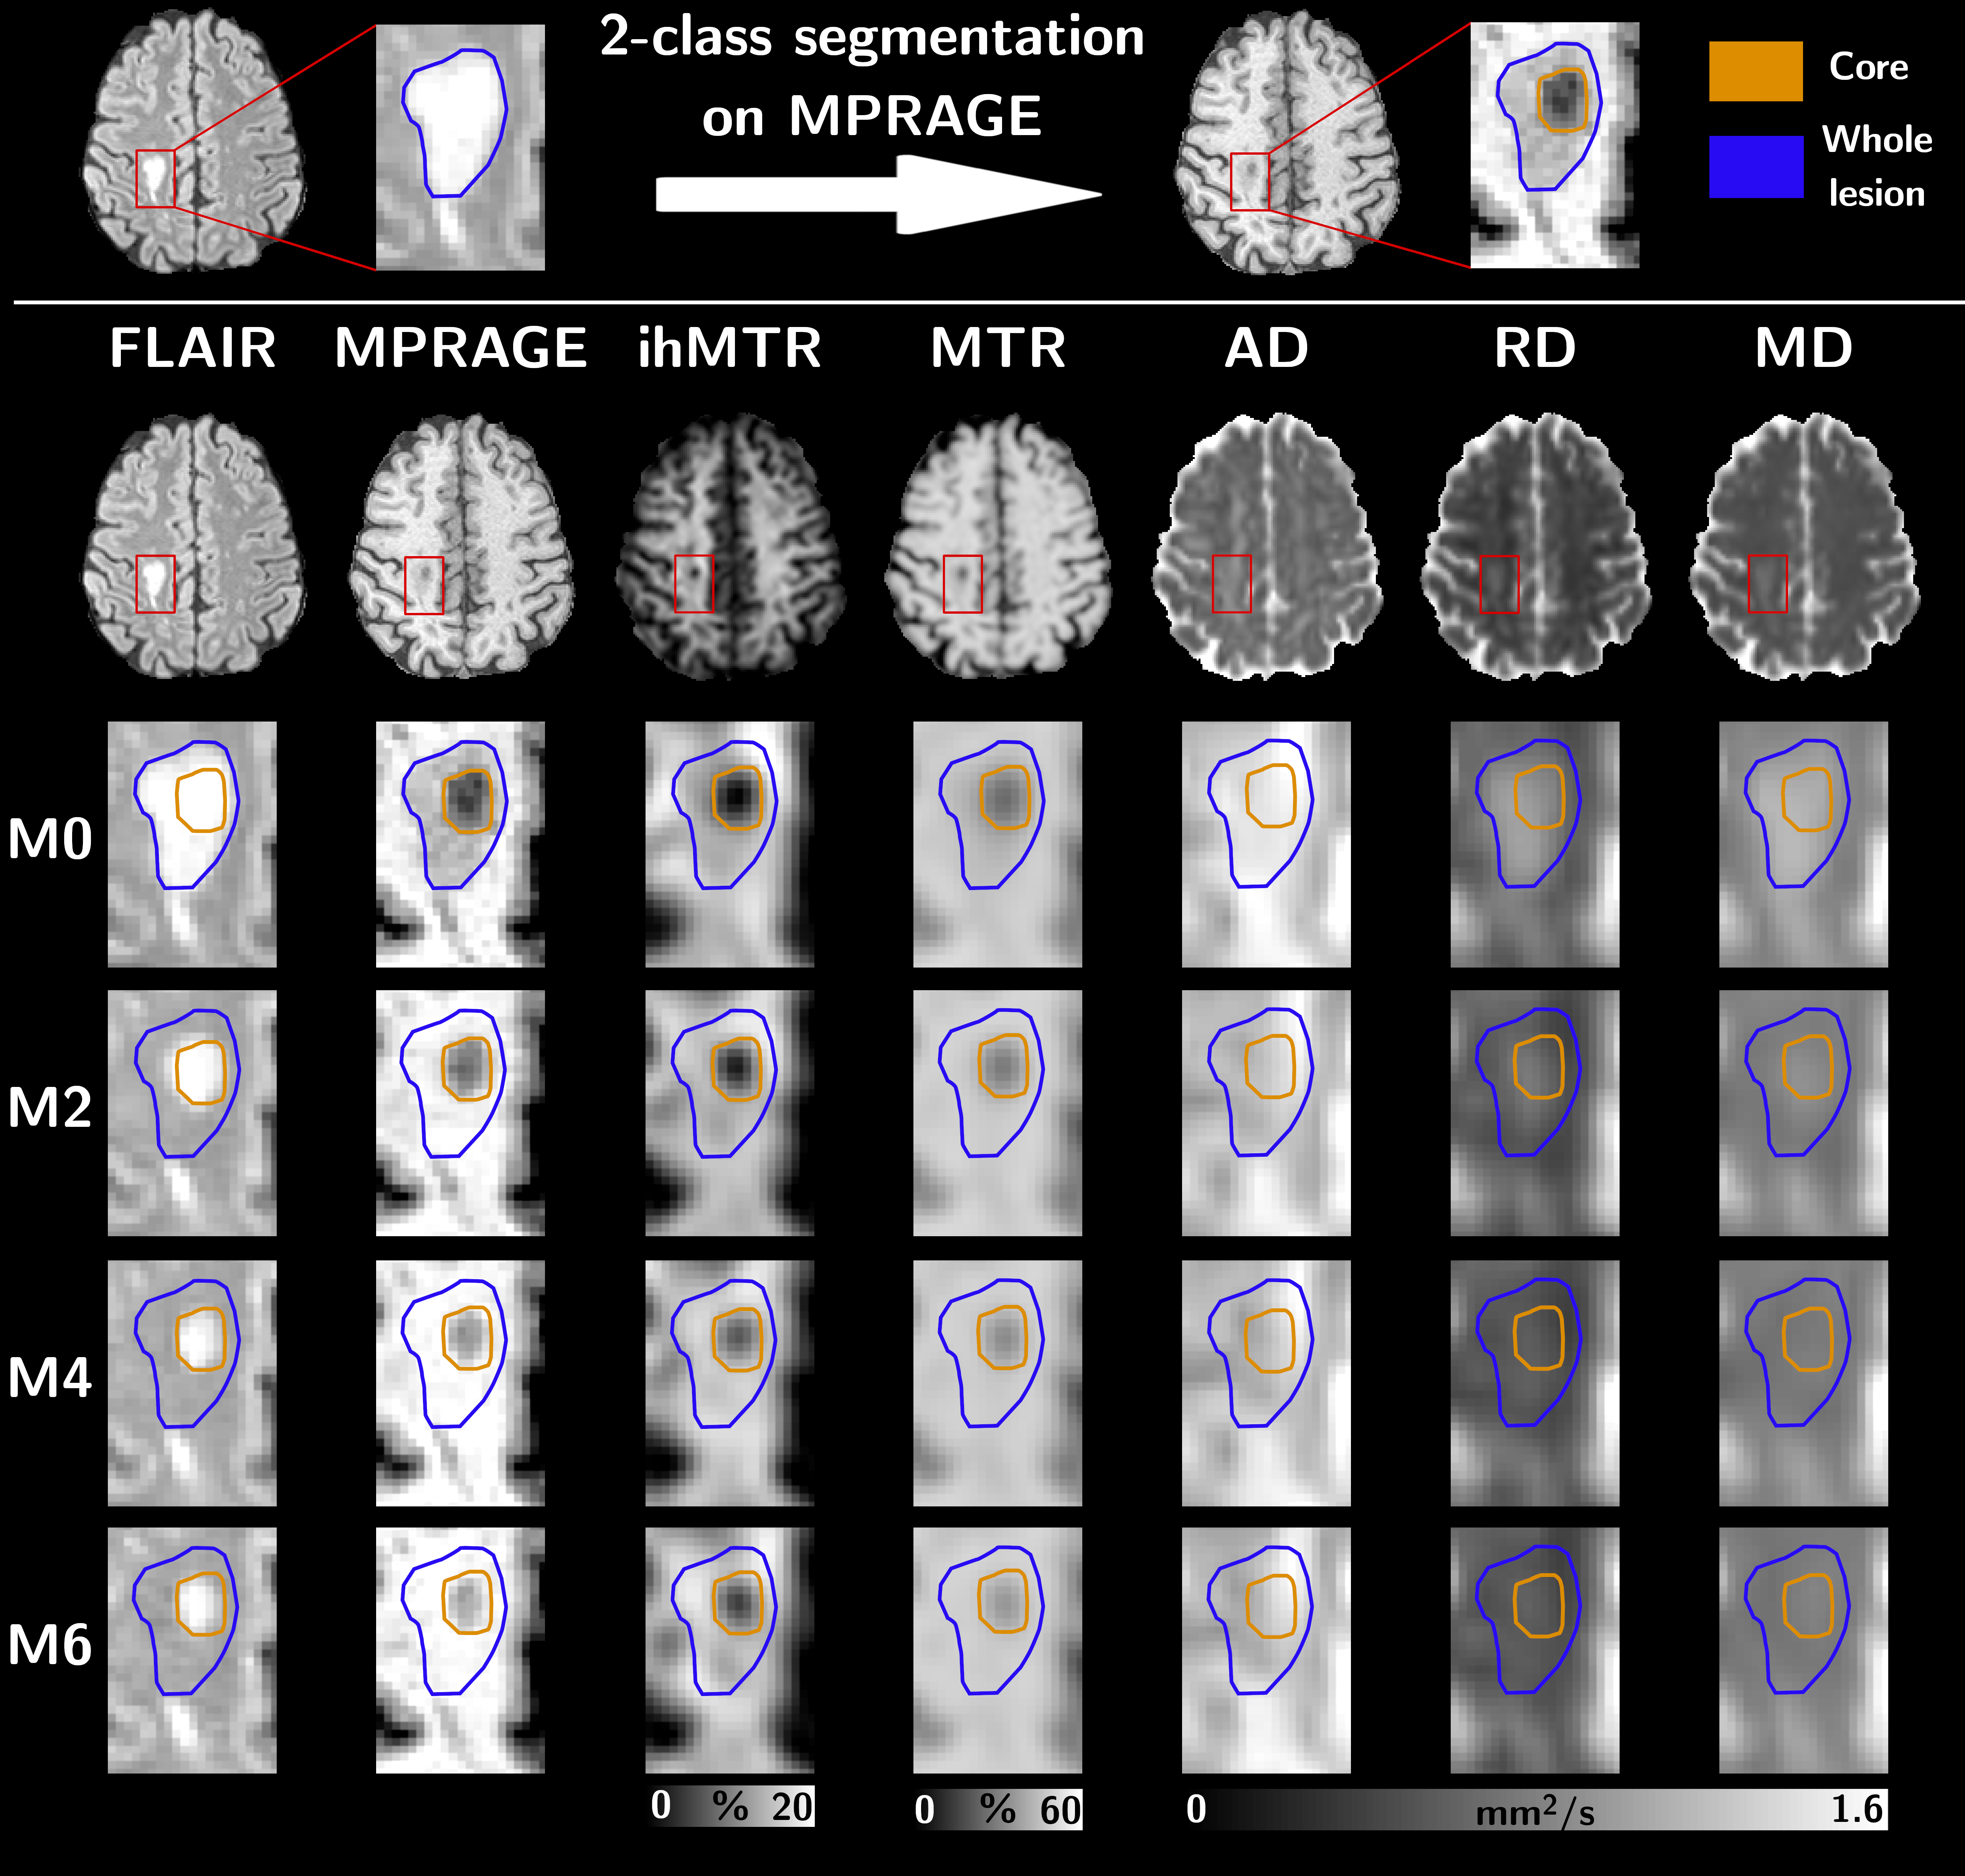
Six relapsing-remitting MS patients underwent a 3D MRI protocol every two months for six months (M0, M2, M4 and M6) on a 1.5T MRI system (Avanto, Siemens Healthineers, Erlangen, Germany) with body coil transmission and a 32-channel receive-only head coil. The protocol included high resolution T1-weighted (T1w) MPRAGE, T2-weighted (T2w) FLAIR and multiparametric imaging (Table 1). MS patients at the early phase of the disease (EDSS at M0 of 1.07±1.27; 0.64±0.85 at M6) were included based on the occurrence of brain active lesions on a contrast-enhanced T1-weighted scan acquired post Gadolinium injection.For each subject, all images were rigidly co-registered onto their respective anatomic T1w-MPRAGE volume using ANTs15. Active and non-active lesions masks were manually segmented by an expert using the T2w-FLAIR volumes at each time-point and the post-Gadolinium T1w volume at M0. All active lesion masks were further segmented into two classes using Atropos16 (k-means clustering) according to their signal intensities measured in MPRAGE at M017, defining the lesion cores as the cluster exhibiting the highest contrast with respect to the normal appearing white matter (NAWM), and the lesion edges as the other cluster. At each time-point, NAWM masks were computed from the MPRAGE using FreeSurfer18 and excluding all lesion masks.
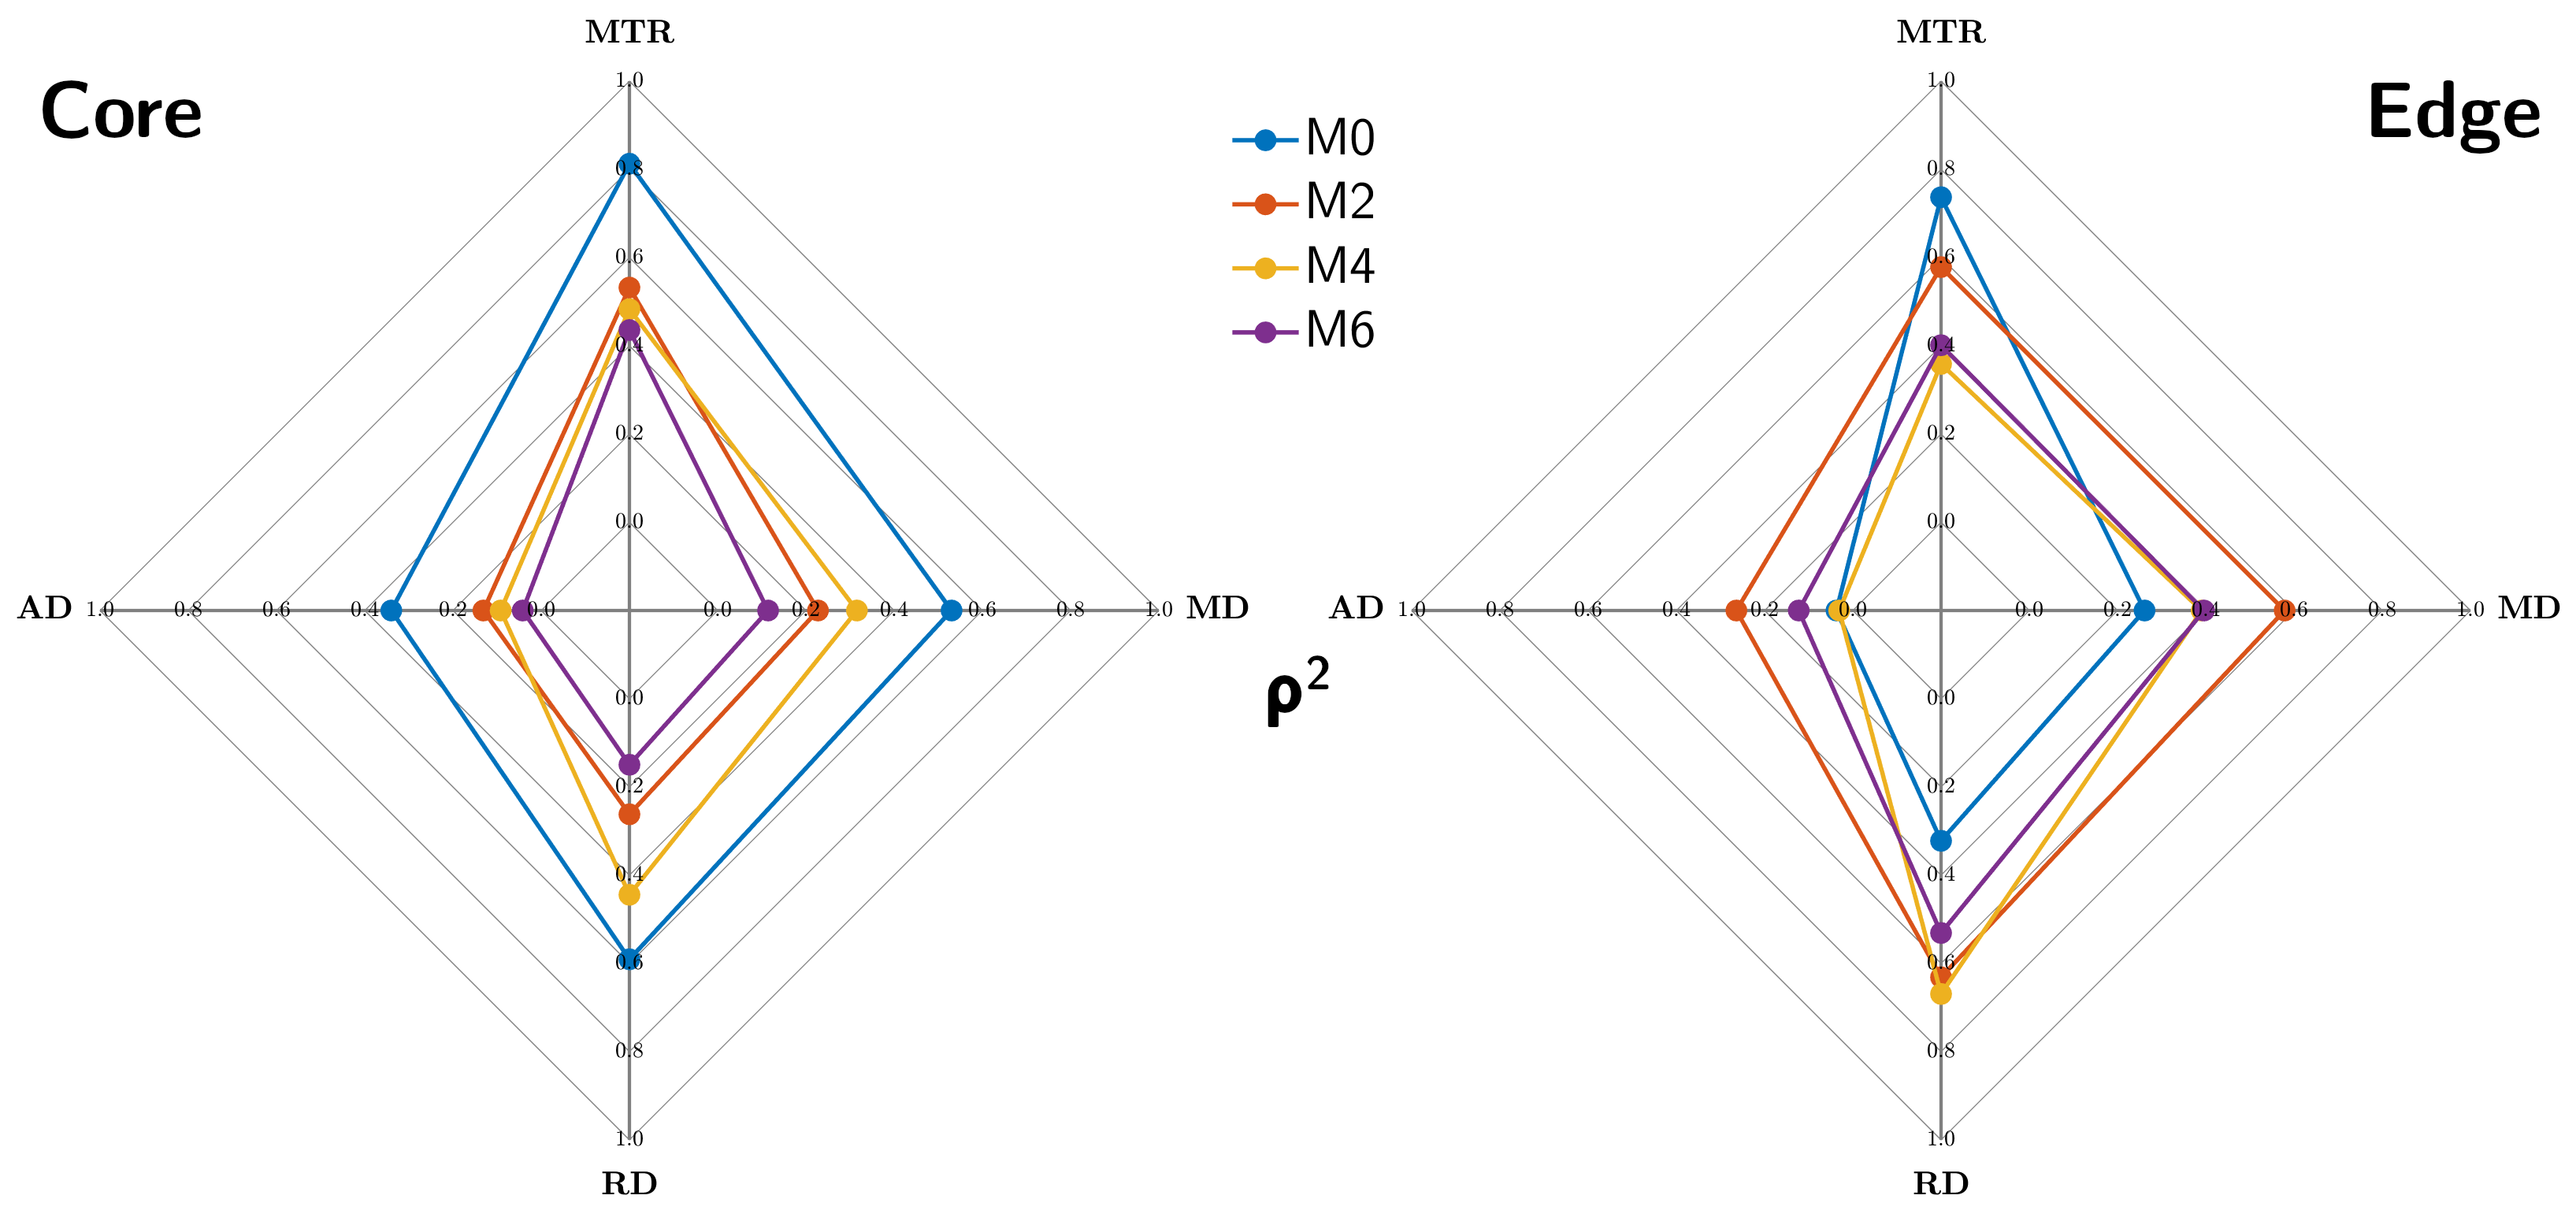
Twenty active lesions (volume > 150 mm3) were analyzed over time. The dynamics over 6 months of the averaged ihMT ratio (ihMTR), conventional MT ratio (MTR), axial diffusivity (AD), radial diffusivity (RD) and mean diffusivity (MD) values were studied in the core and edge of lesions. Values measured in NAWM were used as reference. Pearson correlation coefficient (ρ) was used to assess the relationship between ihMTR and other MR metrics at each time point, and Fisher r-to-z transformation and asymptotic z-test were used to test whether the differences between correlation coefficients measured at M0 and M2, M0 and M4, and M0 and M6 were significant.
Results
Figure 1 presents an illustrative dataset obtained with the proposed multimodal follow-up protocol, focusing on an exemplary lesion. Preliminary quantitative results averaged over all active lesions are summarized on Figure 2. Noteworthy the most important relative variations were obtained for ihMTR and RD in the core of lesions with respect to NAWM. Variations of all metrics in the core and edge of lesions tend to decrease with time, with a clear trend for stabilization after M4. This is also illustrated by multimodal radar plots showing MR metrics values in core/edge of lesions shifting toward NAWM values with time, with the exception of ihMTR in the edge of lesions for which no variation between M0 and M2 was observed. Regarding correlations between different MRI modalities, and focusing on the lesion cores, highest correlations of all MR metrics with ihMTR were obtained at M0 and were significantly different than that of other time points (p<0.05; Figure 3a). In the lesion edges, a similar result was found for MTR only (p<0.05), whereas for DTI metrics, correlations at M0 were the lowest (Figure 3b).Discussion and conclusion
The pronounced signal variations observed for all MRI metrics at M0 confirm their sensitivity to inflammation and/or demyelination processes occurring in active lesions19.In the lesion cores, the initial variations (M0-M4) and subsequent stabilization (>M4) of MR metrics sensitive to microstructure (RD, AD), microstructure and macromolecular-content (MTR and ihMTR) reflect a partial recovery of tissue, partly associated with remyelination processes. Consistently, the combined ihMTR increase and RD decrease is associated with a progressive loss of correlation between the two metrics, which have been previously shown to poorly correlate in normal white matter20.
In the lesion edges, the lower relative variations of ihMTR and RD, along with a low correlation of these metrics at M0, likely reflect a less pronounced demyelination than in the lesion cores19. Largest signal variations of metrics occurred between M0 and M2 (Figure 2, and Figure 1 for FLAIR and MPRAGE) except for ihMTR which remained unchanged. Assuming that ihMT is more specific to myelin than other metrics, this may suggest that damage to other tissue components exceeds demyelination at M0.
While this preliminary report illustrates the complementarity of all investigated metrics in the general aim of characterizing MS lesions with MRI, further investigations will be required to elucidate whether ihMT, as a highly specific myelin imaging technique12, may help in addressing the de/remyelination component of the disease.
Acknowledgements
This work was supported by the SATT Sud-Est (France), the French Association pour la Recherche sur la Sclérose En Plaques (ARSEP), Roche Research Foundation (Switzerland) and French National Research Agency, ANR [ANR‐17‐CE18‐0030]. This work was performed by a laboratory member of France Life Imaging network (grant ANR-11-INBS-0006).
References
1. Laule C, Kozlowski P, Leung E, Li DKB, MacKay AL, Moore GRW. Myelin water imaging of multiple sclerosis at 7 T: Correlations with histopathology. Neuroimage 2008;40:1575–1580 doi: 10.1016/j.neuroimage.2007.12.008 SMASH.
2. Yarnykh VL, Bowen JD, Samsonov A, et al. Fast Whole-Brain Three-dimensional Macromolecular Proton Fraction Mapping in Multiple Sclerosis. Radiology 2015;274:210–220 doi: 10.1148/radiol.14140528 SMASH.
3. Narayanan S, Francis SJ, Sled JG, et al. Axonal injury in the cerebral normal-appearing white matter of patients with multiple sclerosis is related to concurrent demyelination in lesions but not to concurrent demyelination in normal-appearing white matter. Neuroimage 2006;29:637–642 doi: 10.1016/j.neuroimage.2005.07.017 SMASH.
4. Schmierer K, Tozer DJ, Scaravilli F, et al. Quantitative magnetization transfer imaging in postmortem multiple sclerosis brain. J. Magn. Reson. Imaging 2007;26:41–51 doi: 10.1002/jmri.20984 SMASH.
5. Cronin MJ, Wharton S, Al-Radaideh A, et al. A comparison of phase imaging and quantitative susceptibility mapping in the imaging of multiple sclerosis lesions at ultrahigh field. Magn. Reson. Mater. Physics, Biol. Med. 2016;29:543–557 doi: 10.1007/s10334-016-0560-5 SMASH.
6. Haacke EM, Makki M, Ge Y, et al. Characterizing iron deposition in multiple sclerosis lesions using susceptibility weighted imaging. J. Magn. Reson. Imaging 2009;29:537–44 doi: 10.1002/jmri.21676 SMASH.
7. Kealey SM, Kim Y, Whiting WL, Madden DJ, Provenzale JM. Determination of Multiple Sclerosis Plaque Size with Diffusion-Tensor MR Imaging: Comparison Study with Healthy Volunteers. Radiology 2005;236:615–620 doi: 10.1148/radiol.2362040014 SMASH.
8. Filippi M, Rocca MA, Rovaris M. Clinical trials and clinical practice in multiple sclerosis: Conventional and emerging magnetic resonance imaging technologies. Curr. Neurol. Neurosci. Rep. 2002;2:267–276 doi: 10.1007/s11910-002-0086-2 SMASH.
9. Girard OM, Prevost VH, Varma G, Cozzone PJ, Alsop DC, Duhamel G. Magnetization transfer from inhomogeneously broadened lines (ihMT): Experimental optimization of saturation parameters for human brain imaging at 1.5 Tesla. Magn. Reson. Med. 2015;73:2111–2121 doi: 10.1002/mrm.25330 SMASH.
10. Swanson SD, Malyarenko DI, Fabiilli ML, Welsh RC, Nielsen J-F, Srinivasan A. Molecular, dynamic, and structural origin of inhomogeneous magnetization transfer in lipid membranes. Magn. Reson. Med. 2017;77:1318–1328 doi: 10.1002/mrm.26210 SMASH.
11. Varma G, Girard OM, Prevost VH, Grant AK, Duhamel G, Alsop DC. Interpretation of magnetization transfer from inhomogeneously broadened lines (ihMT) in tissues as a dipolar order effect within motion restricted molecules. J. Magn. Reson. 2015;260:67–76 doi: 10.1016/j.jmr.2015.08.024 SMASH.
12. Duhamel G, Prevost VH, Cayre M, et al. Validating the sensitivity of inhomogeneous magnetization transfer (ihMT) MRI to myelin with fluorescence microscopy. Neuroimage 2019;199:289–303 doi: 10.1016/j.neuroimage.2019.05.061 SMASH.
13. Van Obberghen E, Mchinda S, le Troter A, et al. Evaluation of the Sensitivity of Inhomogeneous Magnetization Transfer (ihMT) MRI for Multiple Sclerosis. Am. J. Neuroradiol. 2018;39:634–641 doi: 10.3174/ajnr.A5563 SMASH.
14. Mchinda S, Varma G, Prevost VH, et al. Whole brain inhomogeneous magnetization transfer (ihMT) imaging: Sensitivity enhancement within a steady-state gradient echo sequence. Magn. Reson. Med. 2018;79:2607–2619 doi: 10.1002/mrm.26907 SMASH.
15. Avants BB, Tustison N, Song G. Advanced Normalization Tools (ANTS). Insight J. 2 2009:1–35.
16. Avants BB, Tustison NJ, Wu J, Cook PA, Gee JC. An Open Source Multivariate Framework for n-Tissue Segmentation with Evaluation on Public Data. Neuroinformatics 2011;9:381–400 doi: 10.1007/s12021-011-9109-y SMASH.
17. Thaler C, Faizy T, Sedlacik J, et al. T1- Thresholds in Black Holes Increase Clinical-Radiological Correlation in Multiple Sclerosis Patients Ramagopalan S V., editor. PLoS One 2015;10:e0144693 doi: 10.1371/journal.pone.0144693 SMASH.
18. Dale AM, Fischl B, Sereno MI. Cortical Surface-Based Analysis. Neuroimage 1999;9:179–194 doi: 10.1006/nimg.1998.0395 SMASH.
19. Rovira À, Auger C, Alonso J. Magnetic resonance monitoring of lesion evolution in multiple sclerosis. Ther. Adv. Neurol. Disord. 2013;6:298–310 doi: 10.1177/1756285613484079 SMASH.
20. Ercan E, Varma G, Mädler B, et al. Microstructural correlates of 3D steady-state inhomogeneous magnetization transfer (ihMT) in the human brain white matter assessed by myelin water imaging and diffusion tensor imaging. Magn. Reson. Med. 2018;80:2402–2414 doi: 10.1002/mrm.27211 SMASH.
Figures