1437
Tract-Specific Myelin Content Mapping of the Corticospinal Tract Predicts Impairment in Patients with Multiple Sclerosis
Richard Dortch1 and Francesca Bagnato2,3
1Barrow Neurological Institute, Phoenix, AZ, United States, 2Department of Neurology, Vanderbilt University Medical Center, Nashville, TN, United States, 3Neuroimaging Unit/Neuroimmunology Division, Vanderbilt University Medical Center, Nashville, TN, United States
1Barrow Neurological Institute, Phoenix, AZ, United States, 2Department of Neurology, Vanderbilt University Medical Center, Nashville, TN, United States, 3Neuroimaging Unit/Neuroimmunology Division, Vanderbilt University Medical Center, Nashville, TN, United States
Synopsis
Quantitative magnetization transfer using the selective inversion recovery method yields indices [macromolecular-to-free water pool-size-ratio (PSR) and longitudinal spin-lattice relaxation rate (R1f)] that report on myelin content in the brain. In this study, SIR indices were estimated in the corticospinal tract (CST) of patients with multiple sclerosis for comparison to clinical disability measures [Expanded Disability Status Scale (EDSS) and Timed 25-Foot Walk T25FW)]. Significant correlations were observed between SIR indices (PSR/R1f) and disability scores (EDSS/T25FW). The strongest correlation was between PSR and EDSS, suggesting that measurements of PSR in the CST may report on myelin damage and/or repair in multiple sclerosis.
Introduction
Neurodegeneration, featured by myelin and axonal damage, is a key element of multiple sclerosis (MS) pathology and a primary source of patients’ functional deterioration1. The magnetization transfer ratio (MTR)2 provides an assay of this myelin damage3, but is also sensitive to non-physiological parameters (i.e., hardware, RF power, and sequence timings), which makes it challenging to deploy for large-scale, multiple-site clinical trials4-5. By removing these confounding features, quantitative MT (qMT) methods5 provide indices with improved tissue-specificity, such as the macromolecular-to-free water pool-size-ratio (PSR) and the R1 of the free water pool (R1f). We previously developed6-9 a selective inversion recovery (SIR) qMT sequence that: i) simplifies the complicated acquisition/analysis associated with standard qMT methods (e.g., need for independent measures of T1, B1, and B0) and ii) reduces scan times9. In this study, we evaluated the relationship between the resulting SIR-derived indices (PSR and R1f) in the corticospinal tract (CST) and clinical disability. The CST was chosen for study herein because: i) previous work10 has shown that tract-specific quantitative MRI is more predictive of disability than whole-brain analyses and ii) the CST plays a significant role in motor function.Methods
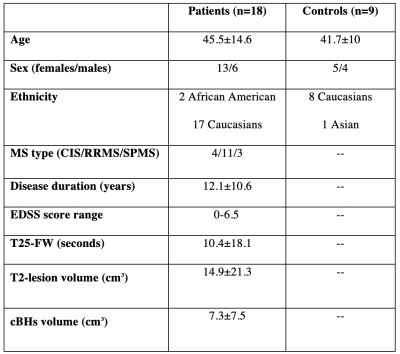
Subjects/Study Overview: A retrospective cohort study of multiple sclerosis patients (n=18) and age- and sex-matched healthy controls (n=9) was performed. MRI was acquired in all subjects as described in the following section. In addition, clinical data, including the Expanded Disability Status Scale (EDSS) and Timed 25-Foot Walk Test (T25FW) test, was acquired in all patients for comparison to MRI findings. A summary of the demographic, clinical, and anatomical MRI characteristics of the study cohort are given in Fig. 1. Together, these data suggest that cohort studied herein is representative of the typical MS phenotype.MRI Acquisitions: All scans were acquired using a whole-body 3T Achieva MRI scanner (Philips Healthcare, Cleveland, OH) equipped with a volume transmit and 32-channel receive head coil (NOVA Medical, Wilmington, MA). The scanning protocol included conventional anatomical scans (T1-weighted MP-RAGE, T2-weighted TSE, and T2-weighted FLAIR) along with DTI and SIR acquisitions. SIR data were acquired using an inversion recovered prepared TSE sequence at four different optimization combinations of TI={10,10,278m1007} ms an TD={684,4171,2730,10} ms. Additional parameters included: resolution=2x2x4 mm3, TE=80 ms, TSE factor=26, echo-spacing=5.9 ms, SENSE factor=2.2, and scan time=15-30 minutes (depending on the number of independently acquired slices). To identify the CST, whole-brain DTI data were acquired with multi-slice PGSE sequence and the following parameters: TR/TE=13.5 s/74 ms, b-values={0,1000} s/mm2, 45 diffusion directions, SENSE factor=2, resolution=2x2x2 mm3, and scan time=10 mins.
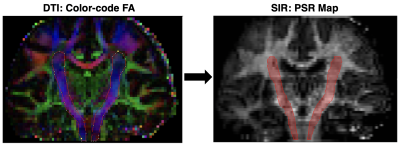
Analysis: All volumes were co-registered to the MP-RAGE volume via FSL (FMRIB Software Library v6.0). SIR parameter maps (PSR and R1f) were then estimated in MATLAB (2017a) by fitting SIR data with a two-pool model of the MT effect as previously described9. The corticospinal tract was manually defined using color-coded FA maps generated with the Medical Image Processing, Analysis, and Visualization (MIPAV v7.3) software package. The resulting CST masks were then overlaid onto the co-registered SIR parameter maps as shown in Fig. 2. Manually defined white matter lesions and black holes were subtracted from these CST masks and mean PSR/R1f values in normal-appearing CST were estimated for each subject. Linear regressions were performed between SIR parameters and disability scores, and these relationships were assessed via Pearson’s correlation coefficient. In addition, unpaired student t-tests were performed to test for differences in PSR/R1f between patients and controls.
Results and Discussion
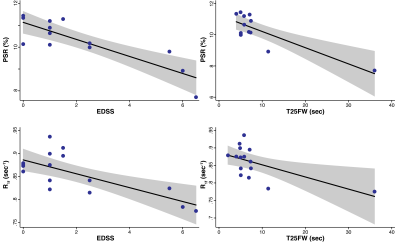
As shown in Fig. 3, significant correlations were observed between SIR-derived R1f values in the CST and both EDSS (p=0.0016, r2=0.52) and T25FW (p=0.016, r2=0.37). Stronger correlations were observed between PSR values EDSS (p=0.0002, r2=0.72) and T25FW (p=0.001, r2=0.68), suggesting PSR may be a more specific measure of myelin content that R1f. This is consistent with our comparisons of SIR parameters between multiple sclerosis patients and controls, which found significant differences in PSR values (p=0.049) between patients (10.3 ±1.1%) and controls (11.3 ±1.1%), but not for R1f values (p=0.26) between patients (0.86 ±0.05 s-1) and controls (0.88 ±0.03 s-1). Note that the reported findings were independent of the exclusion/inclusion of white matter lesions and/or black holes in the CST due to the small volumes of these lesions relative to the overall volume of the normal-appearing CST. The small volume of lesions within the CST of this cohort precluded any asymmetry analysis.Conclusions
The results herein suggest that SIR-derived measures of PSR in the CST may be viable biomarkers of myelin content and patient disability in MS. R1f provides complementary information on myelin content, although R1f is additionally sensitive to inflammation/edema as well as iron accumulation within lesions and macrophages. Future work includes deploying these SIR protocols in larger longitudinal studies to determine the responsiveness of PSR to change over time. If successful, SIR-derived measures, especially PSR, may be able to detect white matter damage and repair earlier than is currently achievable through conventional MRI.Acknowledgements
R01 NS097821for funding and Brian Thurber for assistance in data analysis.References
- Mahad DH, Trapp BD, Lassmann H. Pathological mechanisms in progressive multiple sclerosis. Lancet Neurol. 2015;14:183-93.2.
- Wolff SD, Balaban RS. Magnetization transfer contrast (MTC) and tissue water proton relaxation in vivo. Magn Reson Med. 1989;10:135-44.3.
- Odrobina EE, Lam TY, Pun T, Midha R, Stanisz GJ. MR properties of excised neural tissue following experimentally induced demyelination. NMR Biomed. 2005;18:277-84.4.
- Berry I, Barker GJ, Barkhof F, et al. A multicenter measurement of magnetization transfer ratio in normal white matter. J Magn Reson Imaging. 1999;9:441-65.
- Henkleman RM, Huang X, Xiang Reson Med. 1993;29:759-66.6.
- Dortch RD, Li K, Gochberg DF, et al. Quantitative magnetization transfer imaging of human brain at 3T via selective inversion recovery. Magn Reson Med. 2011;65:1346-52.7.
- Dortch RD, Moore J, Li K, et al. Quantitative magnetization transfer imaging of human brain at 7T. Neuroimage. 2013;64:640-98.
- Bagnato F, Hametner S, Franco G, et al. Selective inversion recovery quantitative magnetization transfer brain MRI at 7T: clinical and post-mortem validation in multiple sclerosis. J Neuroimaging 2018. Apr 19. doi: 10.1111/jon.12511.9.
- Dortch RD, Bagnato F, Gochberg DF, et al. Optimization of selective inversion recovery magnetization transfer imaging for macromolecular content mapping in the human brain. Magn Reson Med. 2018. Mar 24. doi: 10.1002/mrm.27174.10.
- Reich DS, Smith SA, Jones CK, et al. Quantitative Characterization of the Corticospinal Tract at 3 Tesla. AJNR. 2006;27:2168-2178.
Figures

Fig. 1. Demographic, clinical, and MRI characteristics of study cohort. Data are expressed in mean±SD unless otherwise indicated. Legend: cBHs=chronic black hole; CIS=clinically isolated syndrome, EDSS=Expanded Disability Status Scale, RRMS=relapsing remitting multiple sclerosis, SPMS=secondary progressive multiple sclerosis, and T25-FW=Timed 25-Foot Walk Test.

Fig. 2 .(Left) Coronal color-coded FA used to manually define the CST (red outline), which is oriented primarily in the foot-head direction as indicated by the blue color of the tract (red = right-left, green=anterior-posterior). (Right) CST ROI (red) overlaid onto the SIR-derived PSR map.

Fig. 3. Linear regression between SIR (top=PSR/bottom=R1f) and clinical measures (left=EDSS/right=T25FW). The black line represents the fitted line, while the gray area represents the 95% confidence interval of the fit. We note the presence of an outlier patient in the T25FW. The correlation obtained without this outlier was still significant, although the p-value of the association was smaller when the outlier subject was excluded.