1436
Assessing MRI-Based Myelin Measures in Multiple Sclerosis and Healthy Brain White Matter1McConnell Brain Imaging Centre, Montreal Neurological Institute and Hospital, Department of Neurology and Neurosurgery, McGill University, Montreal, QC, Canada, 2Techna Institute, University Health Network, Toronto, ON, Canada, 3Department of Biomedical Engineering, McGill University, Montreal, QC, Canada
Synopsis
We comparatively evaluated non-corrected Magnetization Saturation (MTSat), B1-corrected MTsat, wave-CAIPI direct Visualization of Short myelin Transverse component (wave-CAIPI ViSTa), and multi-atlas probabilistic tissue classification in multiple sclerosis (MS) lesions and white matter tracts of healthy and MS subjects. The relationship between ViSTa myelin water fraction (MWF) and MTSat myelin volume fraction (MVF) was altered in MS normal appearing white matter (NAWM) compared NAWM of controls. This may reflect specific alterations in the macromolecular and myelin water pool fractions observed in demyelinating tissue. ViSTa MWF was more sensitive in detecting pathological differences between the MS and control groups.
Introduction
Reproducible in vivo quantification of white matter (WM) microstructure is a current goal of MRI research due to its relevance to healthy brain development and progression in demyelinating diseases. Multiple techniques exist for myelin imaging in the human brain, including Quantitative Magnetization Transfer (1,2), Magnetization Transfer Saturation (MTsat) (3), and Myelin Water Fraction (MWF) mapping (4-7). However, comparative evaluations of these measures in healthy human brain and diseased tissue are limited.In this work, we evaluated MTsat and wave-CAIPI direct Visualization of Short myelin Transverse component (wave-CAIPI ViSTa) (8) as measures of myelin in major WM tracts of multiple sclerosis (MS) and healthy human brain tissue. We compared wave-CAIPI ViSTa MWF with MTsat derived myelin measures. Additionally, a multi-atlas probabilistic tissue classification (9) was applied to assess the correspondence between the WM classification and quantitative myelin measures.
Methods
Eleven clinically confirmed MS patients and three healthy control subjects underwent MRI scans as part of a larger study. Two patients returned for follow-up after 6 months. Patients were enrolled if they were greater than 18 years of age and had been diagnosed with MS by a neurologist at the Montreal Neurological Institute. Subjects included in our study were either untreated or on a stable (at least six months) disease-modifying therapy. Control subjects were enrolled provided they have not been diagnosed with a neurological disease.Wave-CAIPI ViSTa, T1-weighted structural, and Magnetization Transfer Saturation (MTsat) acquisitions were carried out using a 3T Prisma MRI scanner (Siemens, Germany) with parameters similar to (10). Additionally, B1-maps were acquired for correction of transmit field bias in the MTsat maps (11-13). PD-, T2-weighted and FLAIR images were also acquired for use in automatic WM tissue classification.
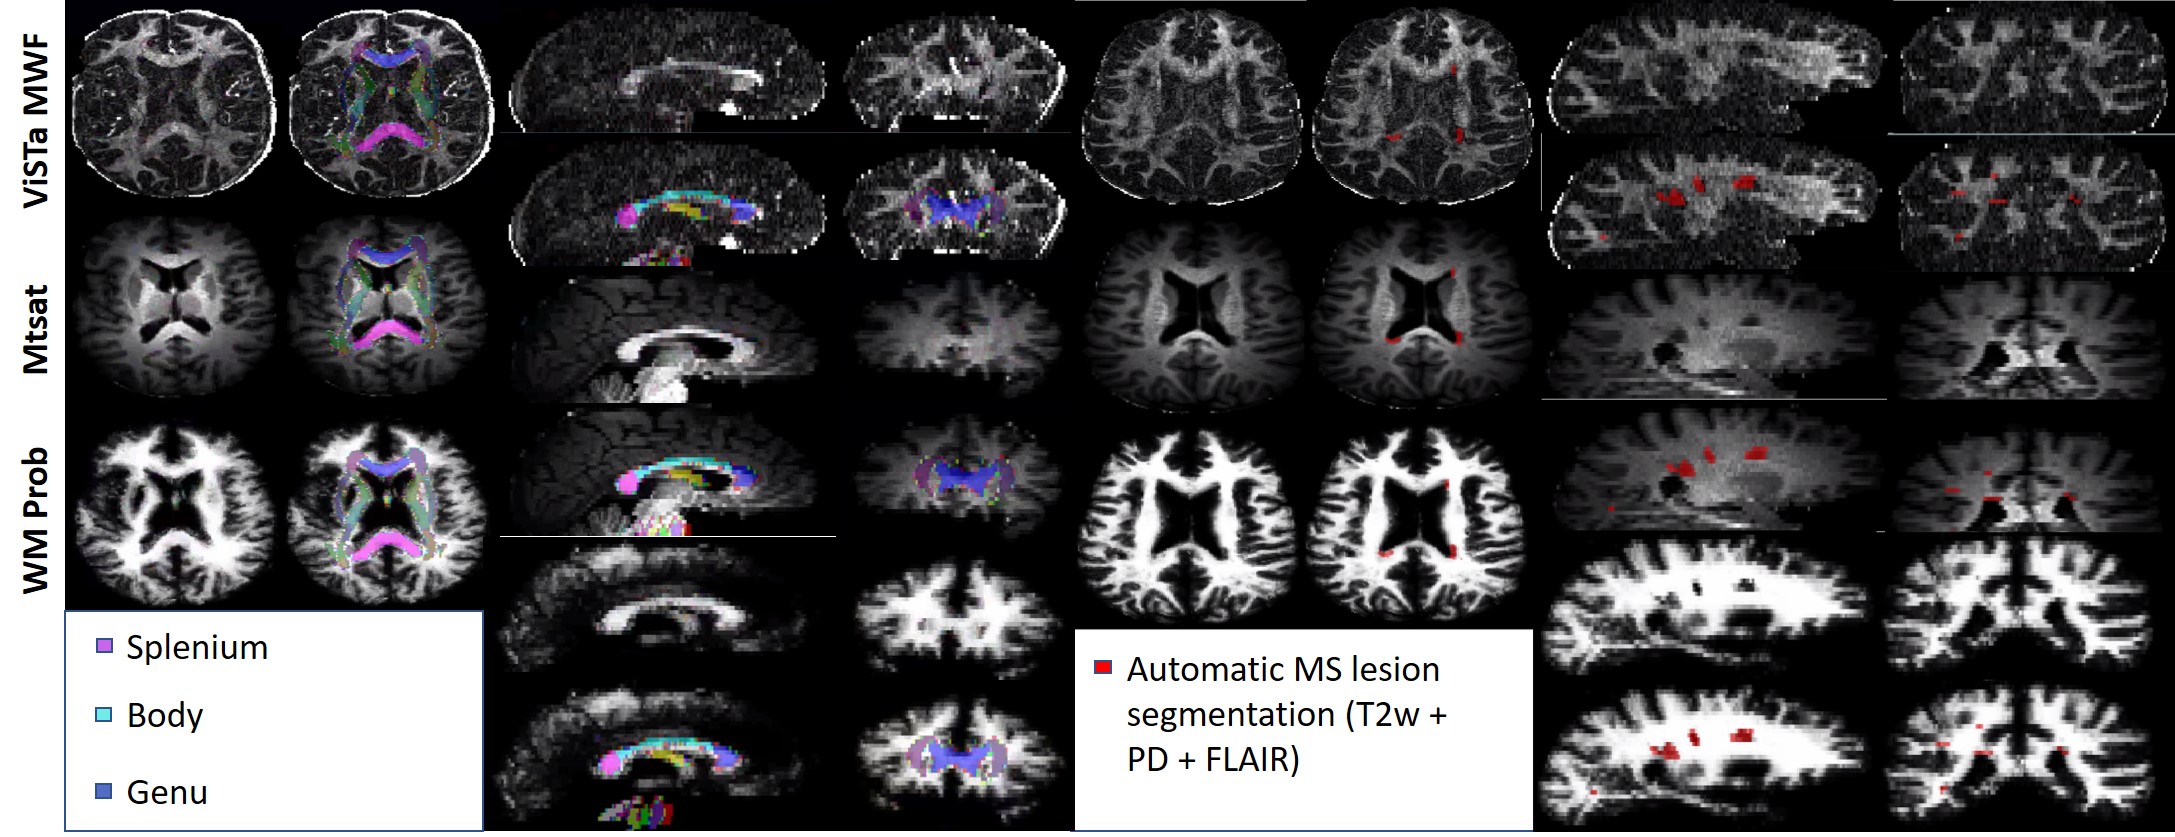
All images were downsampled and registered to ViSTa native space. The JHU 1 mm isotropic resolution ICBM labels were used as WM masks (14). Each mask was visual appraised for accuracy after registration by a trained physician with 9 years of experience in neuroimaging (D.F.). Lesion masks were computed using an automatic Bayesian lesion segmentation (15) that exploited T1-, T2-, PD-weighted, and FLAIR images (Figure 1). Extended phase graph modeling of the ViSTa signal (10) was used to partially recover myelin water signal lost due to magnetization transfer and diffusion effects. WM probabilistic masks were computed using supervised multi-atlas label fusion (9) of FLAIR, T1-, T2-, PD-weighted images.
Mean values of MTsat MVF, B1-corrected MTsat MVF, ViSTa MWF, and WM probability within normal appearing WM tracts labels were computed. Next, a Pearson’s linear regression was conducted to evaluate the quantitative relationship between white matter imaging techniques in major white matter tracts and lesion voxels. Separate Mann-Whitney tests were conducted to evaluate tract-wise differences in myelin measures between MS and controls. All statistical analyses were conducted with a threshold of α=0.05.
Results & Discussion
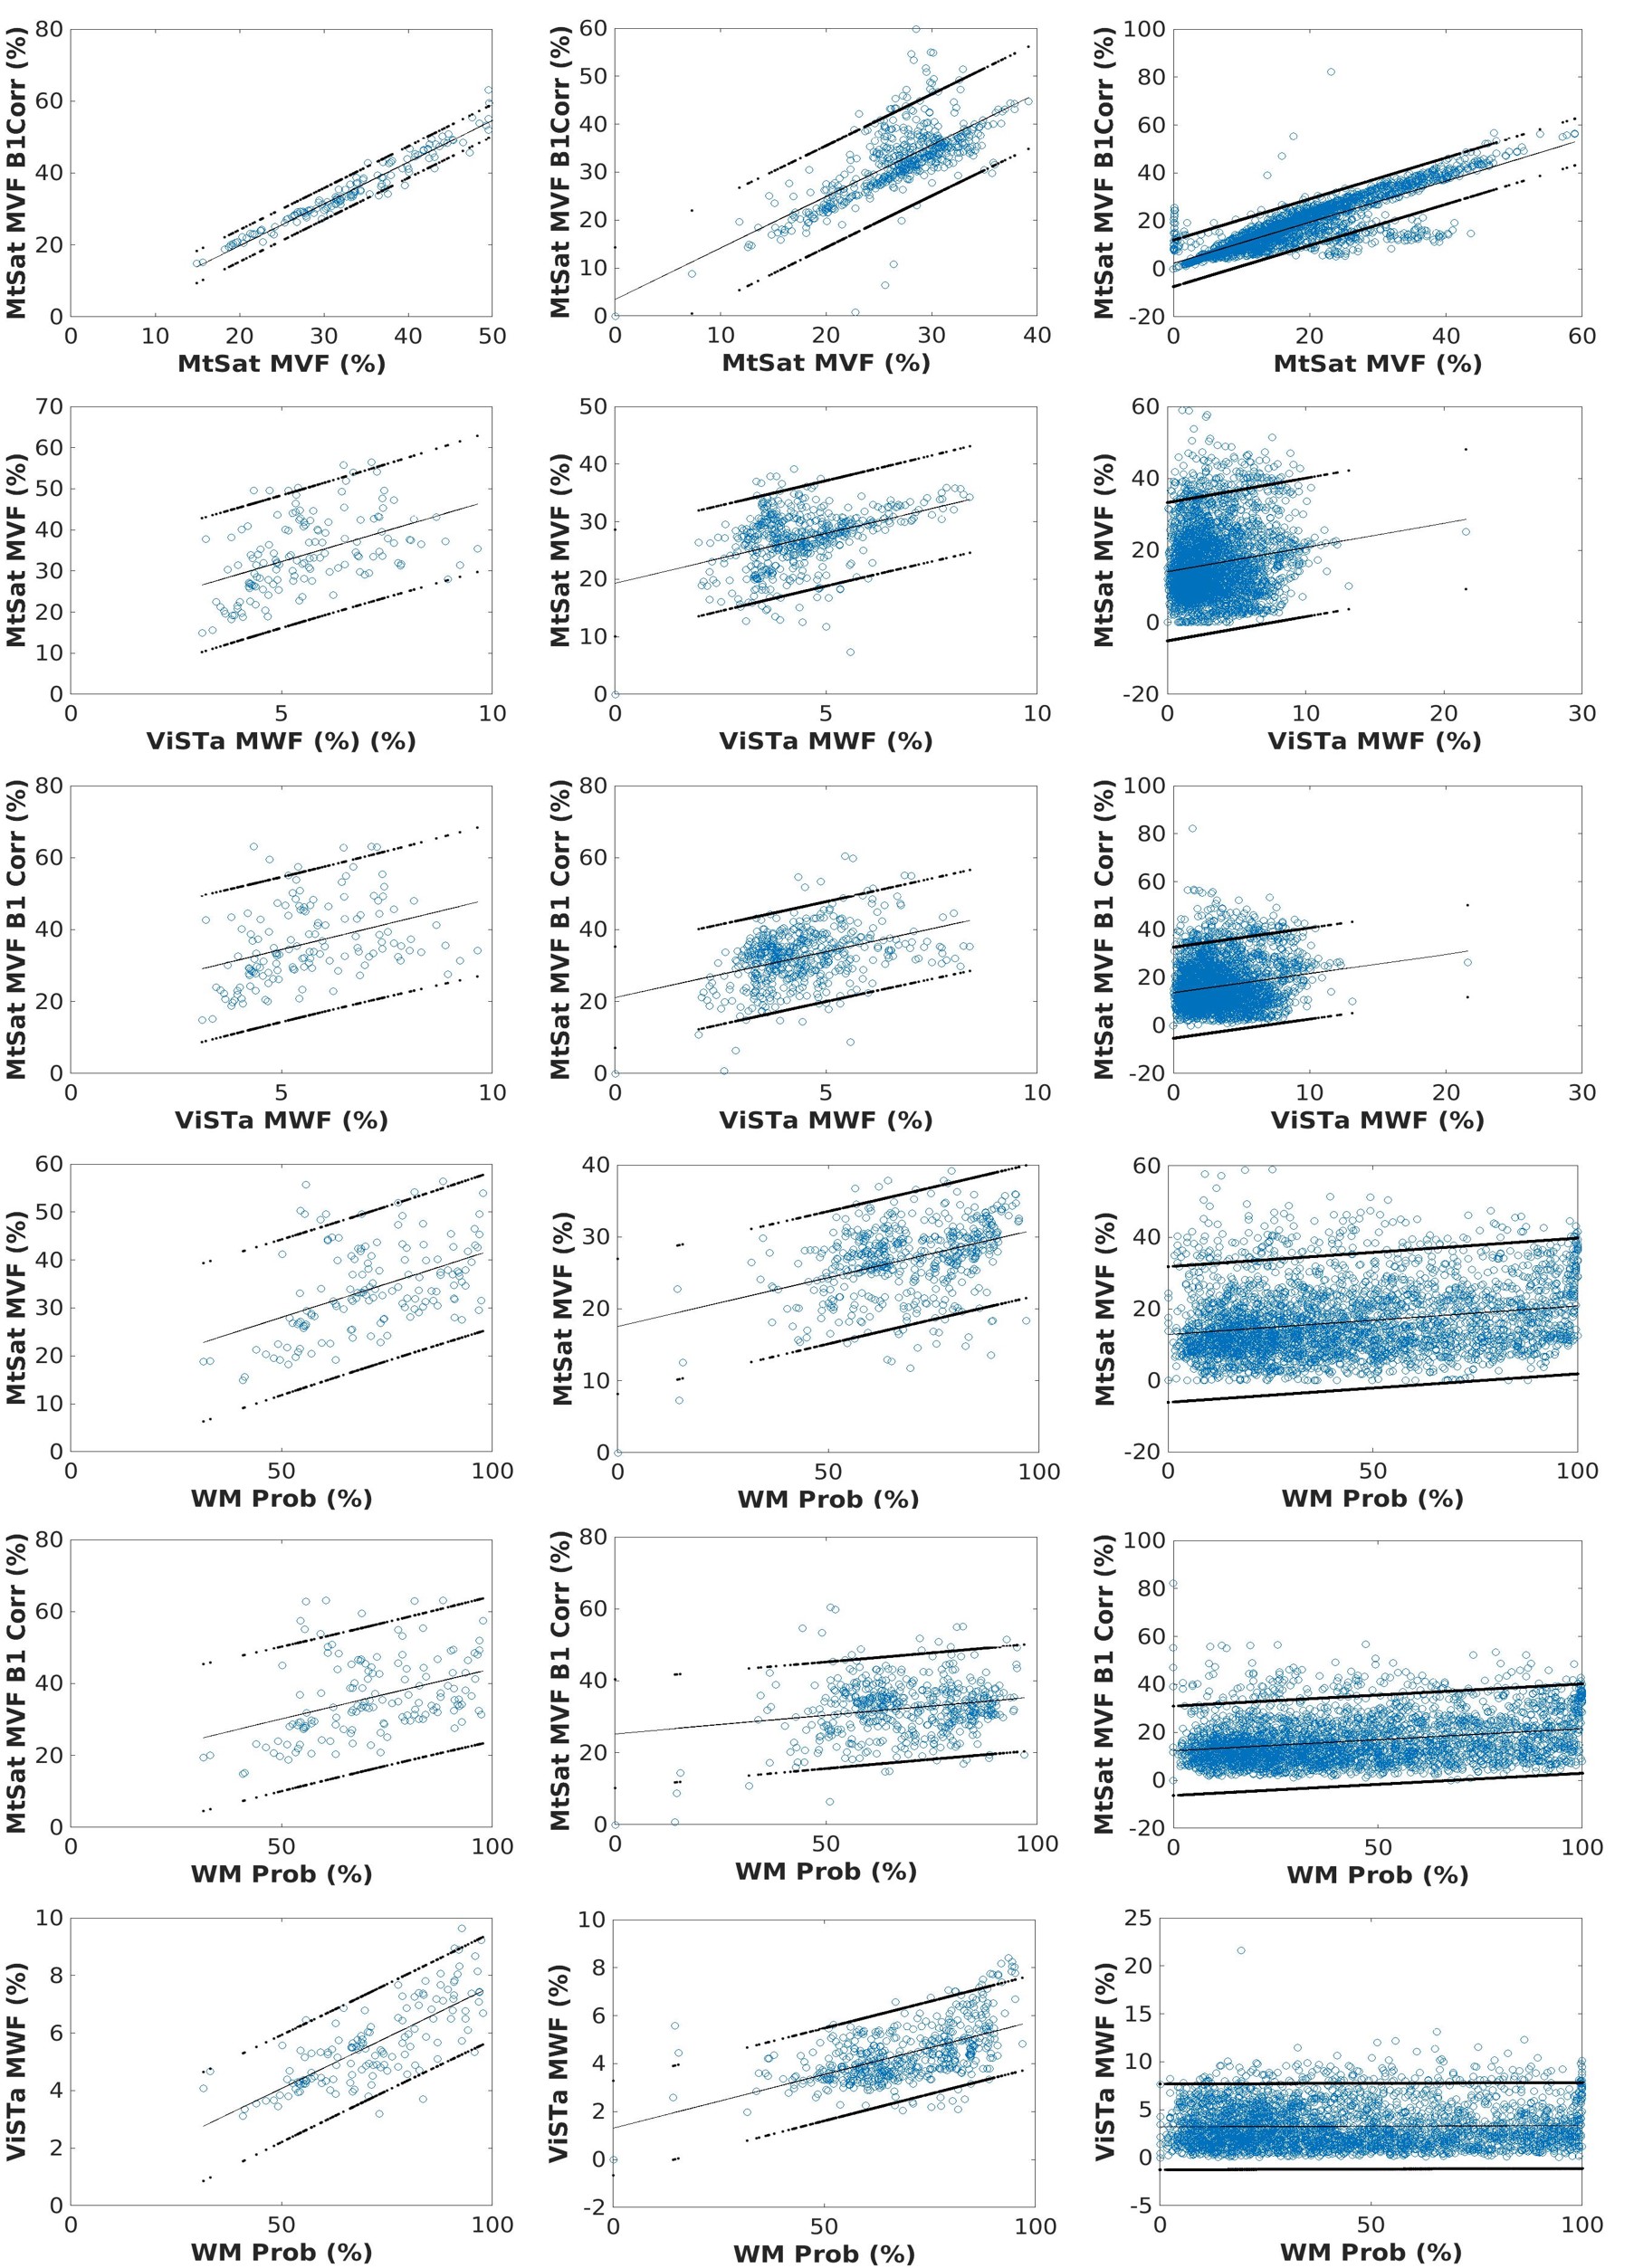
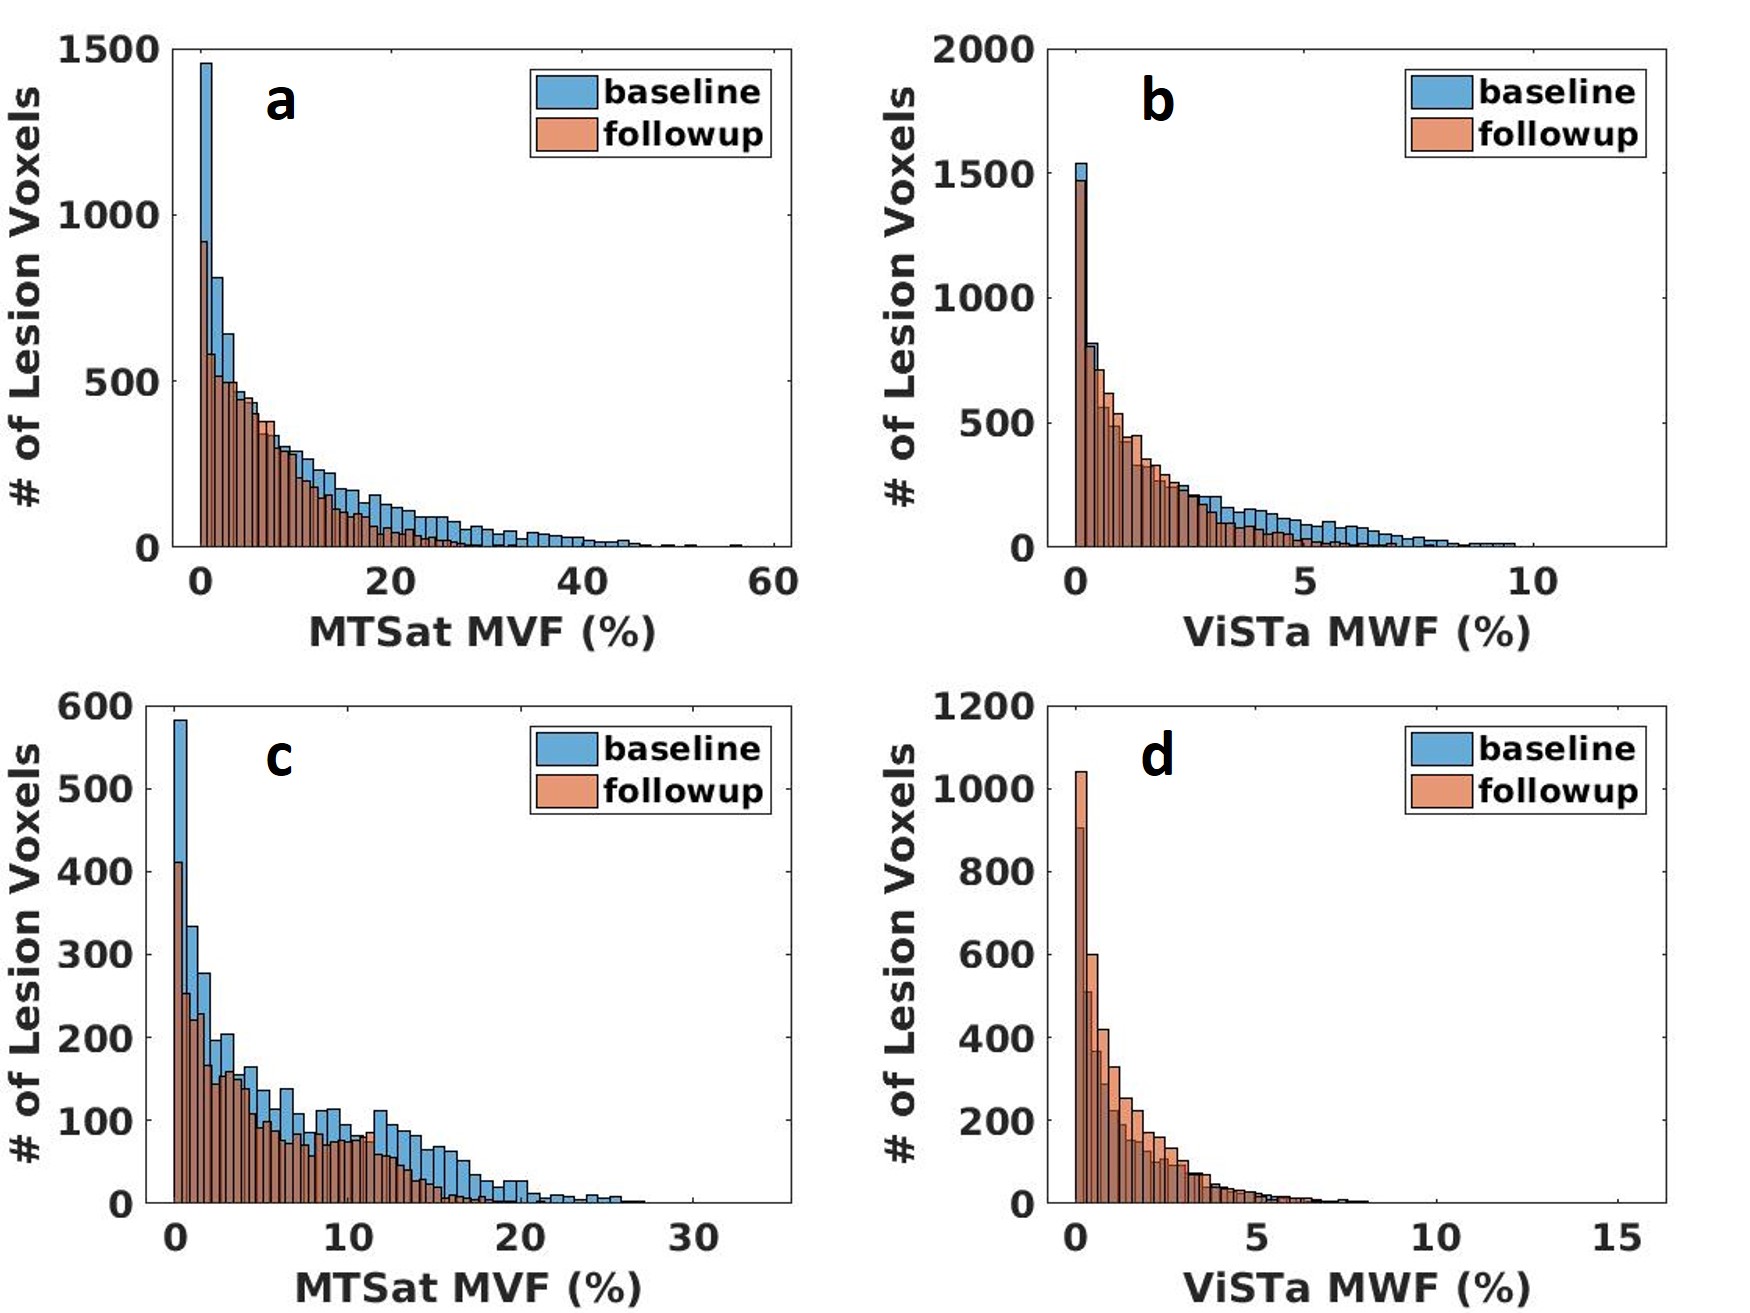
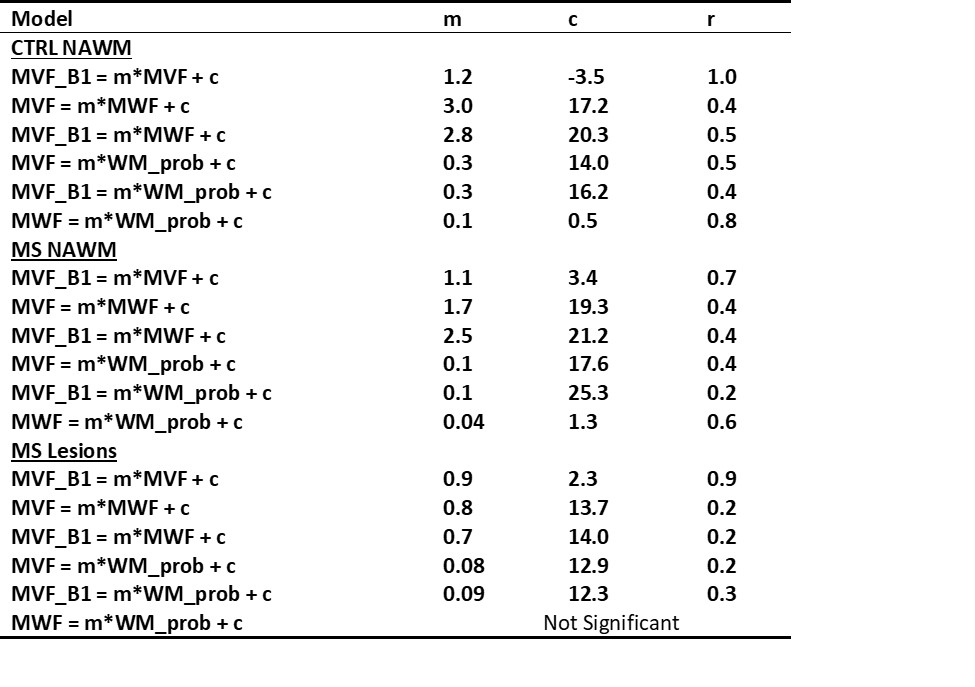
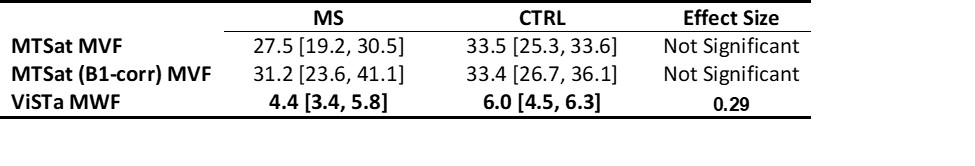
We investigated wave-CAIPI ViSTA as a novel technique for calculating MWF and measuring demyelination in MS subjects. Wave-CAIPI ViSTa MWF has been recently demonstrated to correlate both with conventional T2-based MWF (16) and with MTsat (10). The regression slopes between ViSTa MWF and MTsat-derived MVF was higher than previously reported calibrations of histological MVF to MWF derived from T2W multi-exponential fitting (5,7). This was true for both patients and controls in our study (Figure 2, Table 1). We also observed significant differences in ViSTa MWF between MS and controls in normal-appearing WM (NAWM). These differences were not detectable with MTsat, which underscores the different contrast mechanisms of the two modalities. This suggests that ViSTa MWF may be more sensitive to MS related WM changes (Table 2). This feature is also confirmed by longitudinal analysis of lesion MWF (Figure 3).B1-correction using the double-angle method was applied to remove transmit field bias in MTsat images. This correction only slightly affected the relationship between MTsat MVF vs. VisTA MWF in controls but increased the slope by 57% in MS patients. Thus, proper B1 correction may be important for application of MTsat to measure demyelination in MS. The linear relation between MTsat and ViSTa MWF in lesion voxels has a non-zero intercept which may be related to the contribution of the exchanging WM macromolecular compartment in lesions (17).
The relationship between the quantitative MRI-derived myelin measures and WM probability was lower in MS compared to controls. This suggests Bayesian WM classification is affected by demyelination in NAWM (Figure 2, Table 1).
Conclusions
The relationship between ViSTa MWF and MTSat MVF is altered in MS NAWM compared NAWM of controls. This may reflect specific alterations in the macromolecular and myelin water pool fractions observed in demyelinating tissue. ViSTa MWF was more sensitive in detecting pathological differences between the MS and control groups.Acknowledgements
The authors gratefuly acknowledge funding support from the Canadian Institute for Health Research and scholarship support (A.E.) from MITACS.References
1. Cercignani M, Giulietti G, Dowell NG, et al. Characterizing axonal myelination within the healthy population: a tract-by-tract mapping of effects of age and gender on the fiber g-ratio. Neurobiol Aging 2017:49:109-118.
2. Stikov N, Campbell JS, Stroh T, et al. In vivo histology of the myelin g-ratio with magnetic resonance imaging. Neuroimage 2015:118:397-405.
3. Mohammadi S, Carey D, Dick F, et al. Whole-brain in-vivo measurements of the axonal g-ratio in a group of 37 healthy volunteers. Frontiers in neuroscience 2015:9:441.
4. Dean III DC, O'Muircheartaigh J, Dirks H, et al. Mapping an index of the myelin g-ratio in infants using magnetic resonance imaging. Neuroimage 2016:132:225-237.
5. Jung W, Lee J, Shin H, et al. Whole brain g-ratio mapping using myelin water imaging (MWI) and neurite orientation dispersion and density imaging (NODDI). Neuroimage 2018:182:379-388.
6. Thapaliya K, Vegh V, Bollmann S & Barth M. Assessment of microstructural signal compartments across the corpus callosum using multi-echo gradient recalled echo at 7 T. Neuroimage 2018:182:407-416.
7. West KL, Kelm ND, Carson RP, Gochberg DF, Ess KC & Does MD. Myelin volume fraction imaging with MRI. Neuroimage 2018:182:511-521.
8. Wu Z, Bilgic B, He H, et al. Wave‐CAIPI ViSTa: highly accelerated whole‐brain direct myelin water imaging with zero‐padding reconstruction. Magnetic resonance in medicine 2018:80:1061-1073.
9. Sabuncu MR, Yeo BT, Van Leemput K, Fischl B & Golland P. A generative model for image segmentation based on label fusion. IEEE Trans Med Imaging 2010:29:1714-1729.
10. Z. Wu, I. R. Leppert and D. A. Rudko. Direct Myelin Volume Fraction Mapping with Correction for Magnetization Transfer and Diffusion Effects Using a Four-pool White Matter Model . In: ISMRM 27th Annual Meeting & Exhibition, Montreal, QC, Canada, 2019.
11. Cunningham CH, Pauly JM & Nayak KS. Saturated double‐angle method for rapid B1 mapping. Magnetic Resonance in Medicine. 2006:55:1326-1333.
12. Helms G, Dathe H & Dechent P. Modeling the influence of TR and excitation flip angle on the magnetization transfer ratio (MTR) in human brain obtained from 3D spoiled gradient echo MRI. Magnetic resonance in medicine 2010:64:177-185.
13. Helms G, Dathe H, Kallenberg K & Dechent P. Erratum to: Helms, dathe, kallenberg and dechent, high‐resolution maps of magnetization transfer with inherent correction for rf inhomogeneity and T 1 relaxation obtained from 3D FLASH MRI. Magn Reson Med 2008 Dec; 60 (6): 1396–1407. Magnetic Resonance in Medicine. 2010:6:1856-1856.
14. Hua K, Zhang J, Wakana S, et al. Tract probability maps in stereotaxic spaces: analyses of white matter anatomy and tract-specific quantification. Neuroimage 2008:39:336-347.
15. Elliott C. A Bayesian framework for 4-D segmentation of Multiple Sclerosis lesions in serial MRI in the brain 2016.
16. Choi JY, Jeong IH, Oh S, et al. Evaluation of Normal‐Appearing White Matter in Multiple Sclerosis Using Direct Visualization of Short Transverse Relaxation Time Component (ViSTa) Myelin Water Imaging and Gradient Echo and Spin Echo (GRASE) Myelin Water Imaging. Journal of Magnetic Resonance Imaging 2019:49:1091-1098.
17. Rooney WD, Johnson G, Li X, et al. Magnetic field and tissue dependencies of human brain longitudinal 1H2O relaxation in vivo. Magnetic Resonance in Medicine. 2007:57:308-318.
Figures