1435
Myelin water imaging of Amyoplasia: Comparison to a control atlas1UBC MRI Research Centre, University of British Columbia, Vancouver, BC, Canada, 2International Collaboration on Repair and Discoveries (ICORD), University of British Columbia, Vancouver, BC, Canada, 3Radiology, University of British Columbia, Vancouver, BC, Canada, 4Physics & Astronomy, University of British Columbia, Vancouver, BC, Canada, 5Pathology & Laboratory Medicine, University of British Columbia, Vancouver, BC, Canada, 6SFU ImageTech Lab, Simon Fraser University, Surrey, BC, Canada, 7Philips Canada, Marham, ON, Canada, 8School of Mechatronic Systems Engineering, Simon Fraser University, Surrey, BC, Canada, 9Orthopaedics, University of British Columbia, Vancouver, BC, Canada
Synopsis
Adults living with Amyoplasia report lower physical activity but no educational or cognitive impairment. Myelin water fraction (MWF) is a quantitative MRI metric useful for examining white matter myelin content. We expect brain MWF to be similar or higher between Amyoplasia and controls in most of the brain but lower in areas associated with physical ability. In 3 adults with Amyoplasia MWF maps were created using a 32-echo T2 GRASE compared to an open-source healthy control atlas. Small reductions in corticospinal tract myelin were observed, while the remainder of the brain examined was similar to the control atlas.
Introduction
Amyoplasia is the most common form of Arthrogryposis Multiplex Congenita (AMC), a condition characterized by multiple joint stiffness and muscle weakness that occurs at birth1. Amyoplasia often requires surgical and physiotherapy intervention during childhood to aid in walking and other movements2. 90% of adults living with AMC have upper and lower limb involvement and report lower physical activity when compared to the general United States population, but are 3 times more likely to have a graduate degree3. Furthermore, those with AMC report a normal quality of life in most aspects beyond physical function. Quantitative brain imaging may provide insight into mechanisms responsible for the higher than average educational achievement of adults with AMC, but there are no such reports in the literature. The incidence of Amyoplasia is (1:10000 births)1 making it difficult to recruit large numbers for MRI studies.Myelin water fraction (MWF) is a quantitative MRI metric useful for examining white matter myelin content in the brain and spinal cord4,5. MWF has been used in larger cohort studies of neurodegenerative diseases such as multiple sclerosis (MS)6 and Parkinson’s7. A normative atlas of myelin water distribution has recently been made publicly available8, which makes comparison of rare conditions to a large cohort of healthy controls possible. Myelin water may be well suited to study Amyoplasia as MWF has been positively correlated with increased levels of education, age and IQ in healthy controls9–12. Amyoplasia does not show educational or cognitive impairment compared to the general population, therefore we expect brain MWF to be similar or higher between Amyoplasia and controls in areas such as the corpus callosum (which connects the hemispheres of the brain) and the superior longitudinal fasciculus (a major language pathway). In areas more associated with physical ability, such as the corticospinal tract which connects from the cortex through the spinal cord to the distal regions of the body, we expect MWF to be lower in Amyoplasia.
Our objective was to use a publicly available MWF atlas to examine regional myelin differences in 3 adults with Amyoplasia with post-secondary education. This is the first report of quantitative myelin imaging in Amyoplasia.
Methods
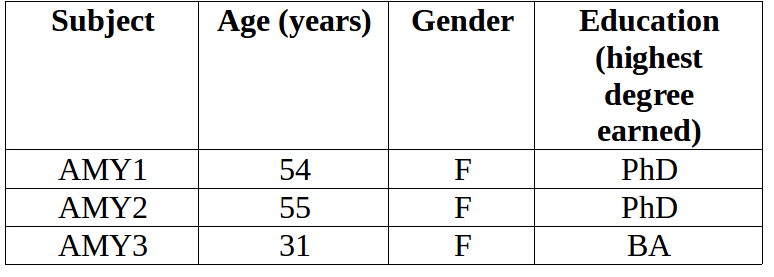
Data collection: Participant demographics are given in Table1. MRI scans were performed on a 3T Philips Ingenia CX and included a 3DT1 weighted anatomical scan (288x288, 213 slice, slice thickness=1mm, TE=3000ms,TE=3.7ms) for registration to MNI/atlas space and designation of ROIs and a 32-echo T2 GRASE (240x240, 40 slices, slice thickness=5mm, TR=1056ms, TE=10ms, acquisition time ~7.5min) for MWF.MWF map creation: T2 decay curves were analyzed using a regularized nonnegative least squares algorithm with stimulated echo correction to yield a T2 distribution of peaks pertaining to different water environments13,14. Voxel-wise MWF was defined as the proportion of signal with T2 between 15-40ms relative to the entire T2 distribution, producing MWF maps for each participant.
Atlas comparison: Individual MWF maps were compared to an open-source 3T 32-echo GRASE MWF atlas in MNI space https://sourceforge.net/projects/myelin-water-atlas/8. Using FSL15-17, 3DT1 and MWF images for each subject were non-linearly registered to MNI and Z-score maps were created by subtracting the mean of the atlas from each MWF map and dividing by the atlas standard deviation. MWF Z-score maps were then thresholded for scores above 2 and below -2. The percentage of voxels above or below the threshold was determined in specific white matter regions of interest; corpus callosum (CC) (genu, body and splenium), superior longitudinal fasciculus (SLF) and corticospinal tract (CST) for each participant.
Results
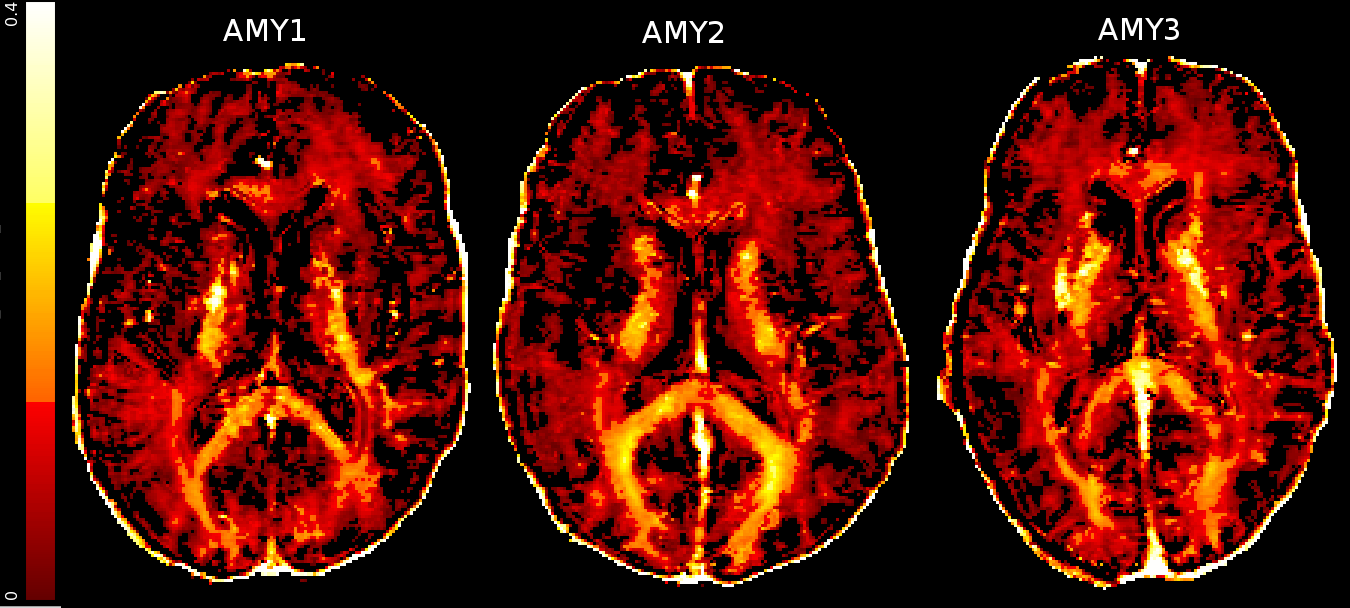
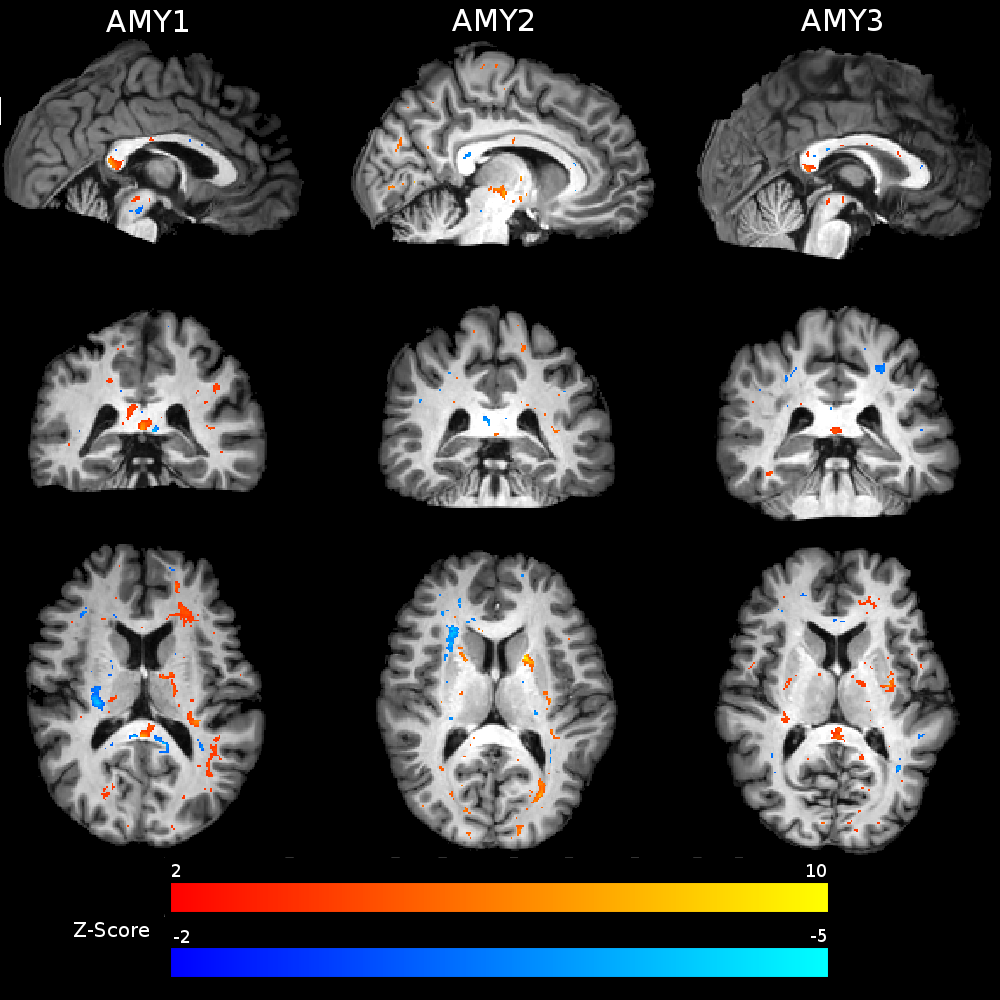
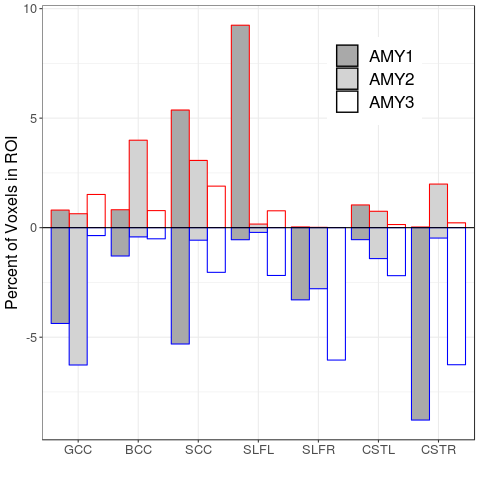
The MWF maps from all participants were high quality (Figure 1). Z-score thresholded maps for each participant are shown in Figure 2. Relative to the atlas, AMY1 and AMY2 had ~5% of voxels decreased in the genu. AMY2 showed 4% increase in the BCC. AMY1 had a ~5% of the splenium voxels decreased and increased. AMY1 showed increased MWF in the left SLF (9.2% of the voxels) while AMY3 demonstrated decreased MWF in the right SLF (6% of the voxels). AMY1 and AMY3 showed decreased MWF in the right CST compared to the atlas (AMY1: 8.8% of the voxels; AMY3: 6.3% of the voxels) (Figure 3).Discussion
Using the same atlas, work in multiple sclerosis showed that the number of voxels with decreased MWF increased with increasing disability8. Therefore, an atlas based approach to studying Amyoplasia was undertaken to determine if cognitive and motor areas were affected. For the first time, we showed MWF maps for Amyolpasia, and report how myelin compared to a normative control MWF atlas. Differences between the atlas and Amyoplasia were generally small. We did find some decreased MWF voxels in the right, but not the left, CST in two of the Amyoplasia participants, which may be associated with reduced ability to control limb and trunk movements. Examining spinal cord MWF may provide more insight into myelin changes in the tracts leading to the limbs.Conclusion
This is the first report of myelin water imaging in Amyoplasia. We successfully used a normative myelin water atlas to investigate possible subject-level myelin water differences in Amyoplasia brain. Small reductions in corticospinal tract myelin were observed, while the remainder of the brain examined was similar to the control atlas.Acknowledgements
ELM receives salary support from Philips Healthcare, Canada. CL holds operating grants from the Multiple Sclerosis Society of Canada and an NSERC Program Discovery Grant. ALM holds an NSERC Discovery Grant.
The authors would like to thank the participants and staff at the SFU ImageTech Lab.
References
1. Hall, J. G., Aldinger, K. A., Tanaka, K. I. & Al, H. E. T. Amyoplasia Revisited. Am J Med Genet A 164A, 700–730 (2014).
2. Staheli, L. T., Hall, J. G., Jaffe, K. M., & Paholke, D. O. Athrogryposis A text atlas. (Cambridge University Press., 2008).
3. Nouraei, H., Sawatzky, B., Macgillivray, M. & Hall, J. Long-term functional and mobility outcomes for individuals with arthrogryposis multiplex congenita. Am J Med Genet A 173, 1270–1278 (2017).
4. Laule, C. et al.
Magnetic Resonance Imaging of Myelin. Neurotherapeutics 4, 460–484 (2007).
5. MacMillan, E. L. et al. Myelin water and T2 relaxation measurements in the healthy cervical spinal cord at 3.0T: Repeatability and changes with age. Neuroimage 54, 1083–1090 (2011).
6. Vavasour, I. M. et al. A 24-month advanced magnetic resonance imaging study of multiple sclerosis patients treated with alemtuzumab. Mult Scler J 25, 811–818 (2019).
7. Baumeister, T. R., Kim, J. L., Zhu, M. & Mckeown, M. J. White Matter Myelin Profiles Linked to Clinical Subtypes of Parkinson’s Disease. J Magn Reson Imaging 50, 164-174 (2018).
8. Liu, H. et al. Myelin Water Atlas: A Template for Myelin Distribution in the Brain. J. Neuroimaging 29, 699-706 (2019).
9. Flynn, S. W. et al. Abnormalities of myelination in schizophrenia detected in vivo with MRI, and post-mortem with analysis of oligodendrocyte proteins. Mol Psychiatry 8, 811–820 (2003).
10. Lang, D. J. M. et al. 48 echo T2 myelin imaging of white matter in first-episode schizophrenia: Evidence for aberrant myelination. NeuroImage Clin 6, 408–414 (2014).
11. Whitaker, K. J., Kolind, S. H., Mackay, A. L. & Clark, C. M. NeuroImage Quantifying development : Investigating highly myelinated voxels in preadolescent corpus callosum. Neuroimage 43, 731–735 (2008).
12. Arshad, M., Stanley, J. A. & Raz, N. NeuroImage Adult age differences in subcortical myelin content are consistent with protracted myelination and unrelated to diffusion tensor imaging indices. Neuroimage 143, 26–39 (2016).
13. Whittall, K. P. et al.
In Vivo Measurement of T2 Distributions and Water Contents in Normal Human
Brain. Magn Reson Med 37, 34–43 (1997).
14. Prasloski, T., Ma, B., Xiang, Q., Mackay, A. & Jones, C. Applications of Stimulated Echo Correction to Multicomponent T2 Analysis. Magn Reson Med 67, 1803–1814 (2012).
15. Smith, S. M. et al. Advances in functional and structural MR image analysis and implementation as FSL. Neuroimage 23, Supple, S208–S219 (2004).
16. Jenkinson, M., Beckmann, C. F., Behrens, T. E. J., Woolrich, M. W. & Smith, S. M. FSL. Neuroimage 62, 782–790 (2012).
17. Woolrich, M. W. et al. Bayesian analysis of neuroimaging data in FSL. Neuroimage 45, S173–S186 (2009).
Figures