1433
Characterisation of MTsat for assessment of intracortical myelination in the developing marmoset brain1Translational Neuroimaging Laboratory, PDN, University of Cambridge, Cambridge, United Kingdom, 2University of Cambridge, Cambridge, United Kingdom, 3Physiology, Development and Neuroscience, University of Cambridge, Cambridge, United Kingdom, 4Department of Psychiatry, University of Cambridge, Cambridge, United Kingdom
Synopsis
Changes in myelination are prominent throughout brain development. Here, we assess MTsat as a measure of intracortical myelination in the developing marmoset brain with 38 subjects from infancy to adulthood. We find that the measure is consistent between brains and that across the cortex as a whole, adults differ in apparent myelination compared with infants and early adolescents particularly within central and deeper cortical layers. Regional analysis with this metric will facilitate differentiation between morphological and microstructural developmental changes that cannot be elucidated with conventional structural imaging.
Introduction
As half of adult patients with mental health disorders are diagnosed by age 14 (rising to three quarters by age 24 [1]), developmental factors are likely to be involved in their pathogenesis. Appropriate animal models are crucial to studying the causes of (and potential interventions for) neuropsychiatric disorders. The marmoset monkey is ideal due to the similarity of brain organisation to humans, the range of complex social behaviour they exhibit and their compact period of development (18-24 months).Among gross morphological changes seen throughout human adolescence, white matter changes are seen not only in major fibre bundles but also within the predominantly grey matter of the neocortex [2]. Cortical thinning during adolescence is well known, but recent studies suggest that at least some of the apparent thinning is in fact due to myelination [3], motivating its quantitative assessment. MTsat has been described as a semi-quantitative measure of myelin, derived from signal changes in 3D multi-gradient echo sequences with magnetisation transfer pulses [4-6]. We have applied this technique in the marmoset as a metric of myelin throughout the brain. Here, we present cross-sectional MTsat maps and analysis from 38 monkeys: in infancy (n=13; age 3.3 ± 0.5 months), early adolescence (n = 11; 9.3 ± 1.3 months) and in adulthood (n = 14; 24 ± 3.0 months).
Methods
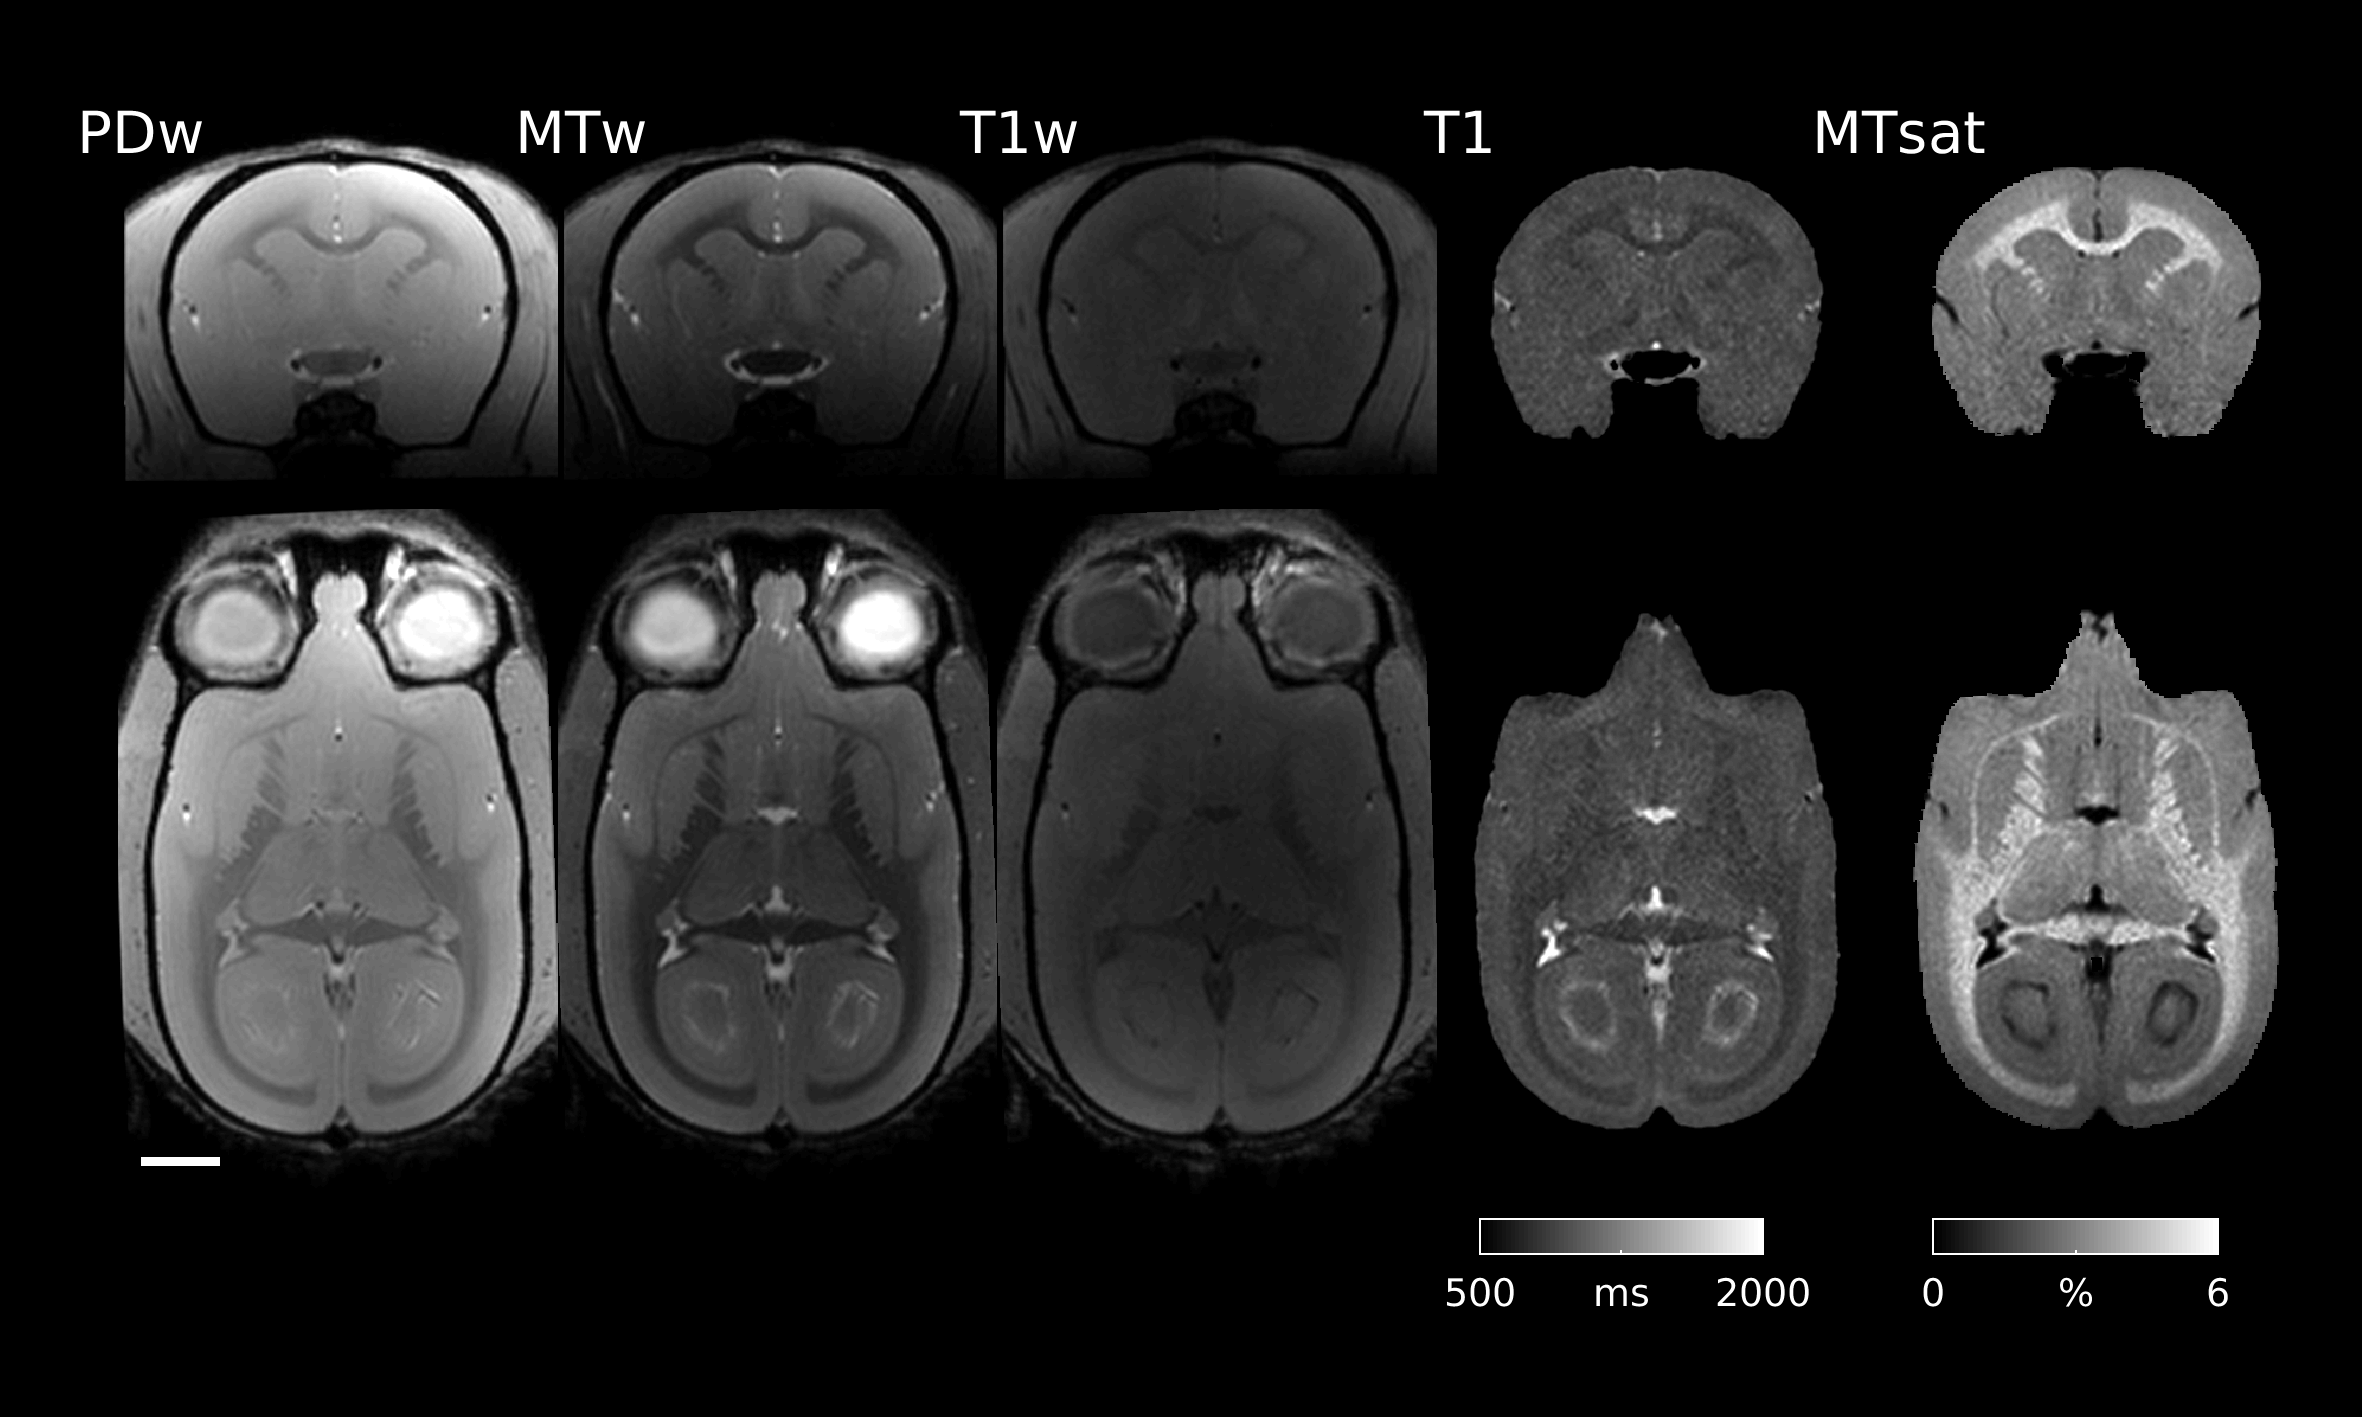
Image acquisitionMarmosets were anaesthetised (ketamine 20mg/kg, isoflurane 1-3% in 0.3l/min O2) and scanned with a 9.4T Bruker BioSpec 94/20 system. An 8ch-receive coil (Rapid Biomedical) was used. Three 3D multi-gradient echo sequences (PDw/MTw/T1w) were acquired with TR 25/25/21ms, flip angle (6/6/45°). The MTw image used an off-resonance pulse at 2kHz (length 4ms, bandwidth 685Hz, field 10µT). For each image 6 echoes were obtained every 2.2ms from 2.4ms and RF spoiling was used. The matrix was 256×160×128 over 44.8×28.0×22.4mm yielding 175µm isotropic resolution with zero filling factors of 1.5 in each direction for effective acceleration of 2.2. The total imaging time was 21m12s.
Data analysis
Analysis largely followed published methods [6]. Helms [5] used a small angle approximation to derive a rational approximation to the spoiled GE signal. Simulations of this approximation suggest for a T1 of 4s, a T1w flip angle of 20° leads to an error of 1.3% for but for T1w flip angles of 45° (as used here) that rises to 10%. Without the small angle approximation T1 can be estimated from two spoiled gradient echo images with TR1 ,θ1 yielding S1 and TR2, θ2 yielding S2 as
$$T_1=\frac{\frac{\cos\theta_1}{\sin\theta_1}S_1-\frac{\cos\theta_2}{\sin\theta_2}S_2}{\frac{S_2}{TR_2\sin\theta_2}(1-\cos\theta_2)-\frac{S_1}{TR_1\sin\theta_1}(1-\cos\theta_1)}$$
Image processing
SPM12 was used to register subject images together with Matlab used to generate parametric maps with UNICORT to correct R1 maps for transmitter power inhomogeneity [7].
The SPMMouse toolbox [8] was used with DARTEL to generate population templates at 250µm isotropic resolution. These were warped to create mean MTsat maps for each group of animals. The cortex was manually delineated and Laplace’s equation was used to estimate an electrostatic potential between WM and pial surfaces for subsequent integration to find cortical depth (and thickness) at each point. Cortical depths were histogrammed with bin widths of 43µm and used to extract MTsat values from each group.
Results and discussion
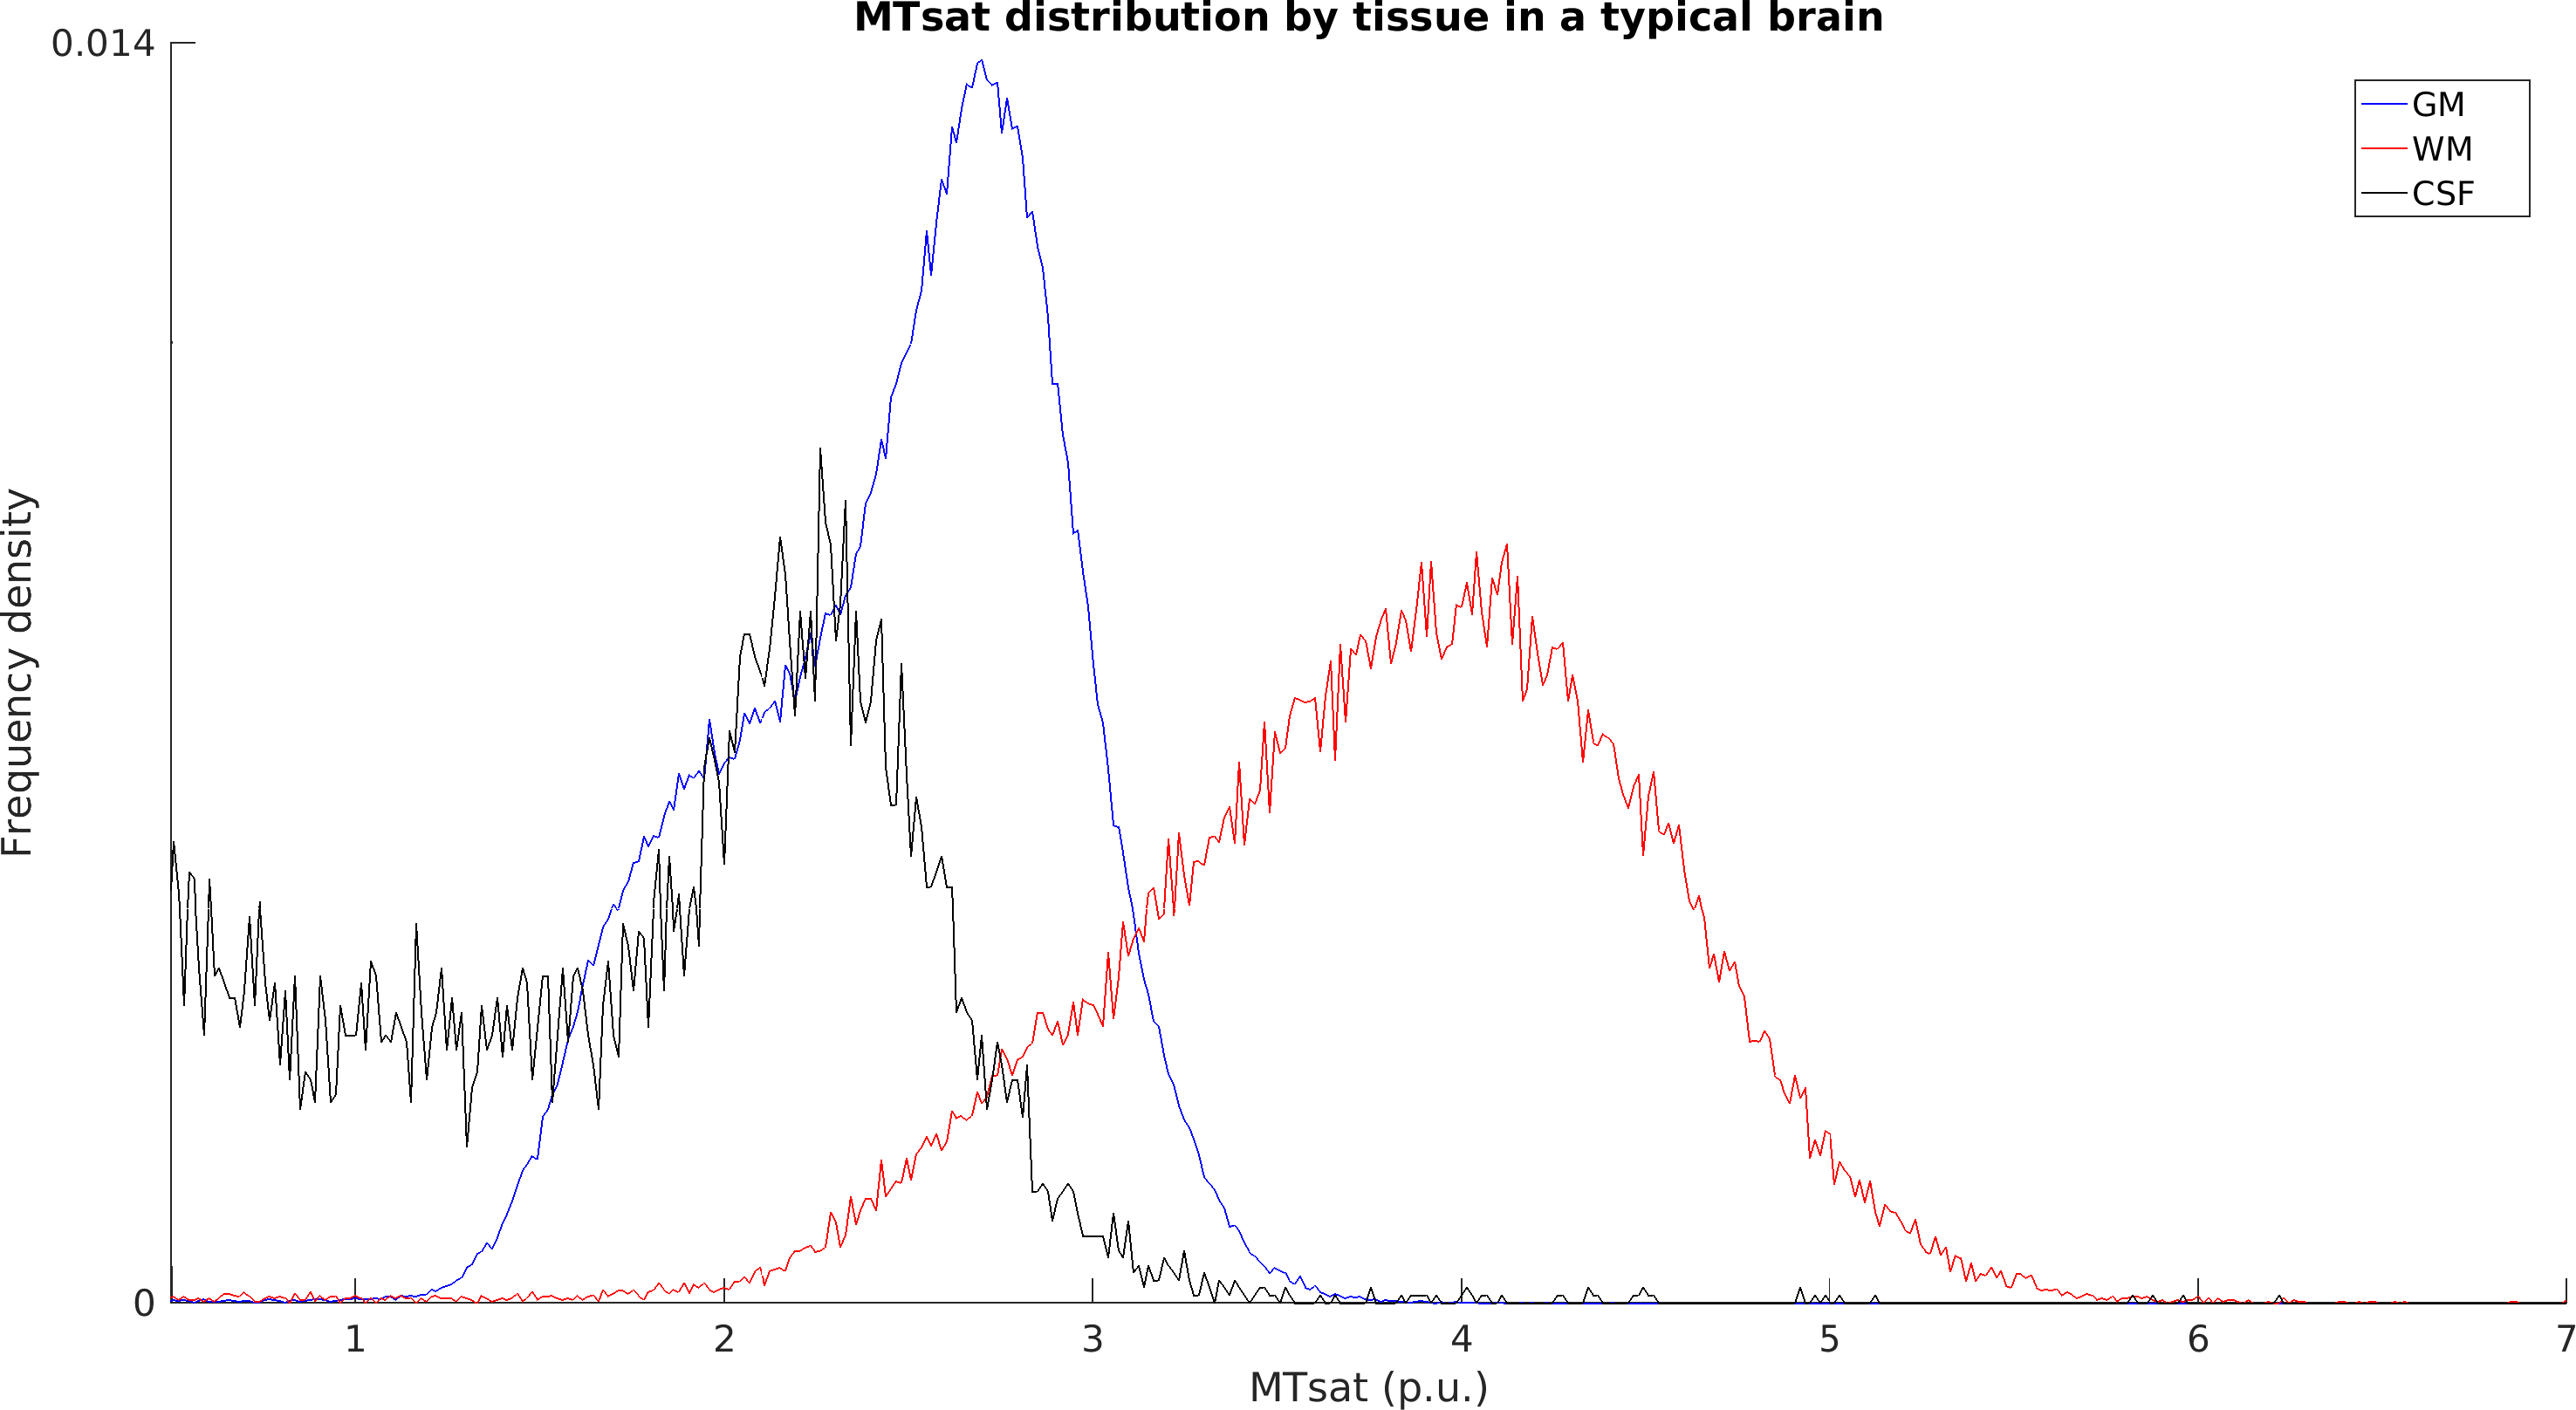
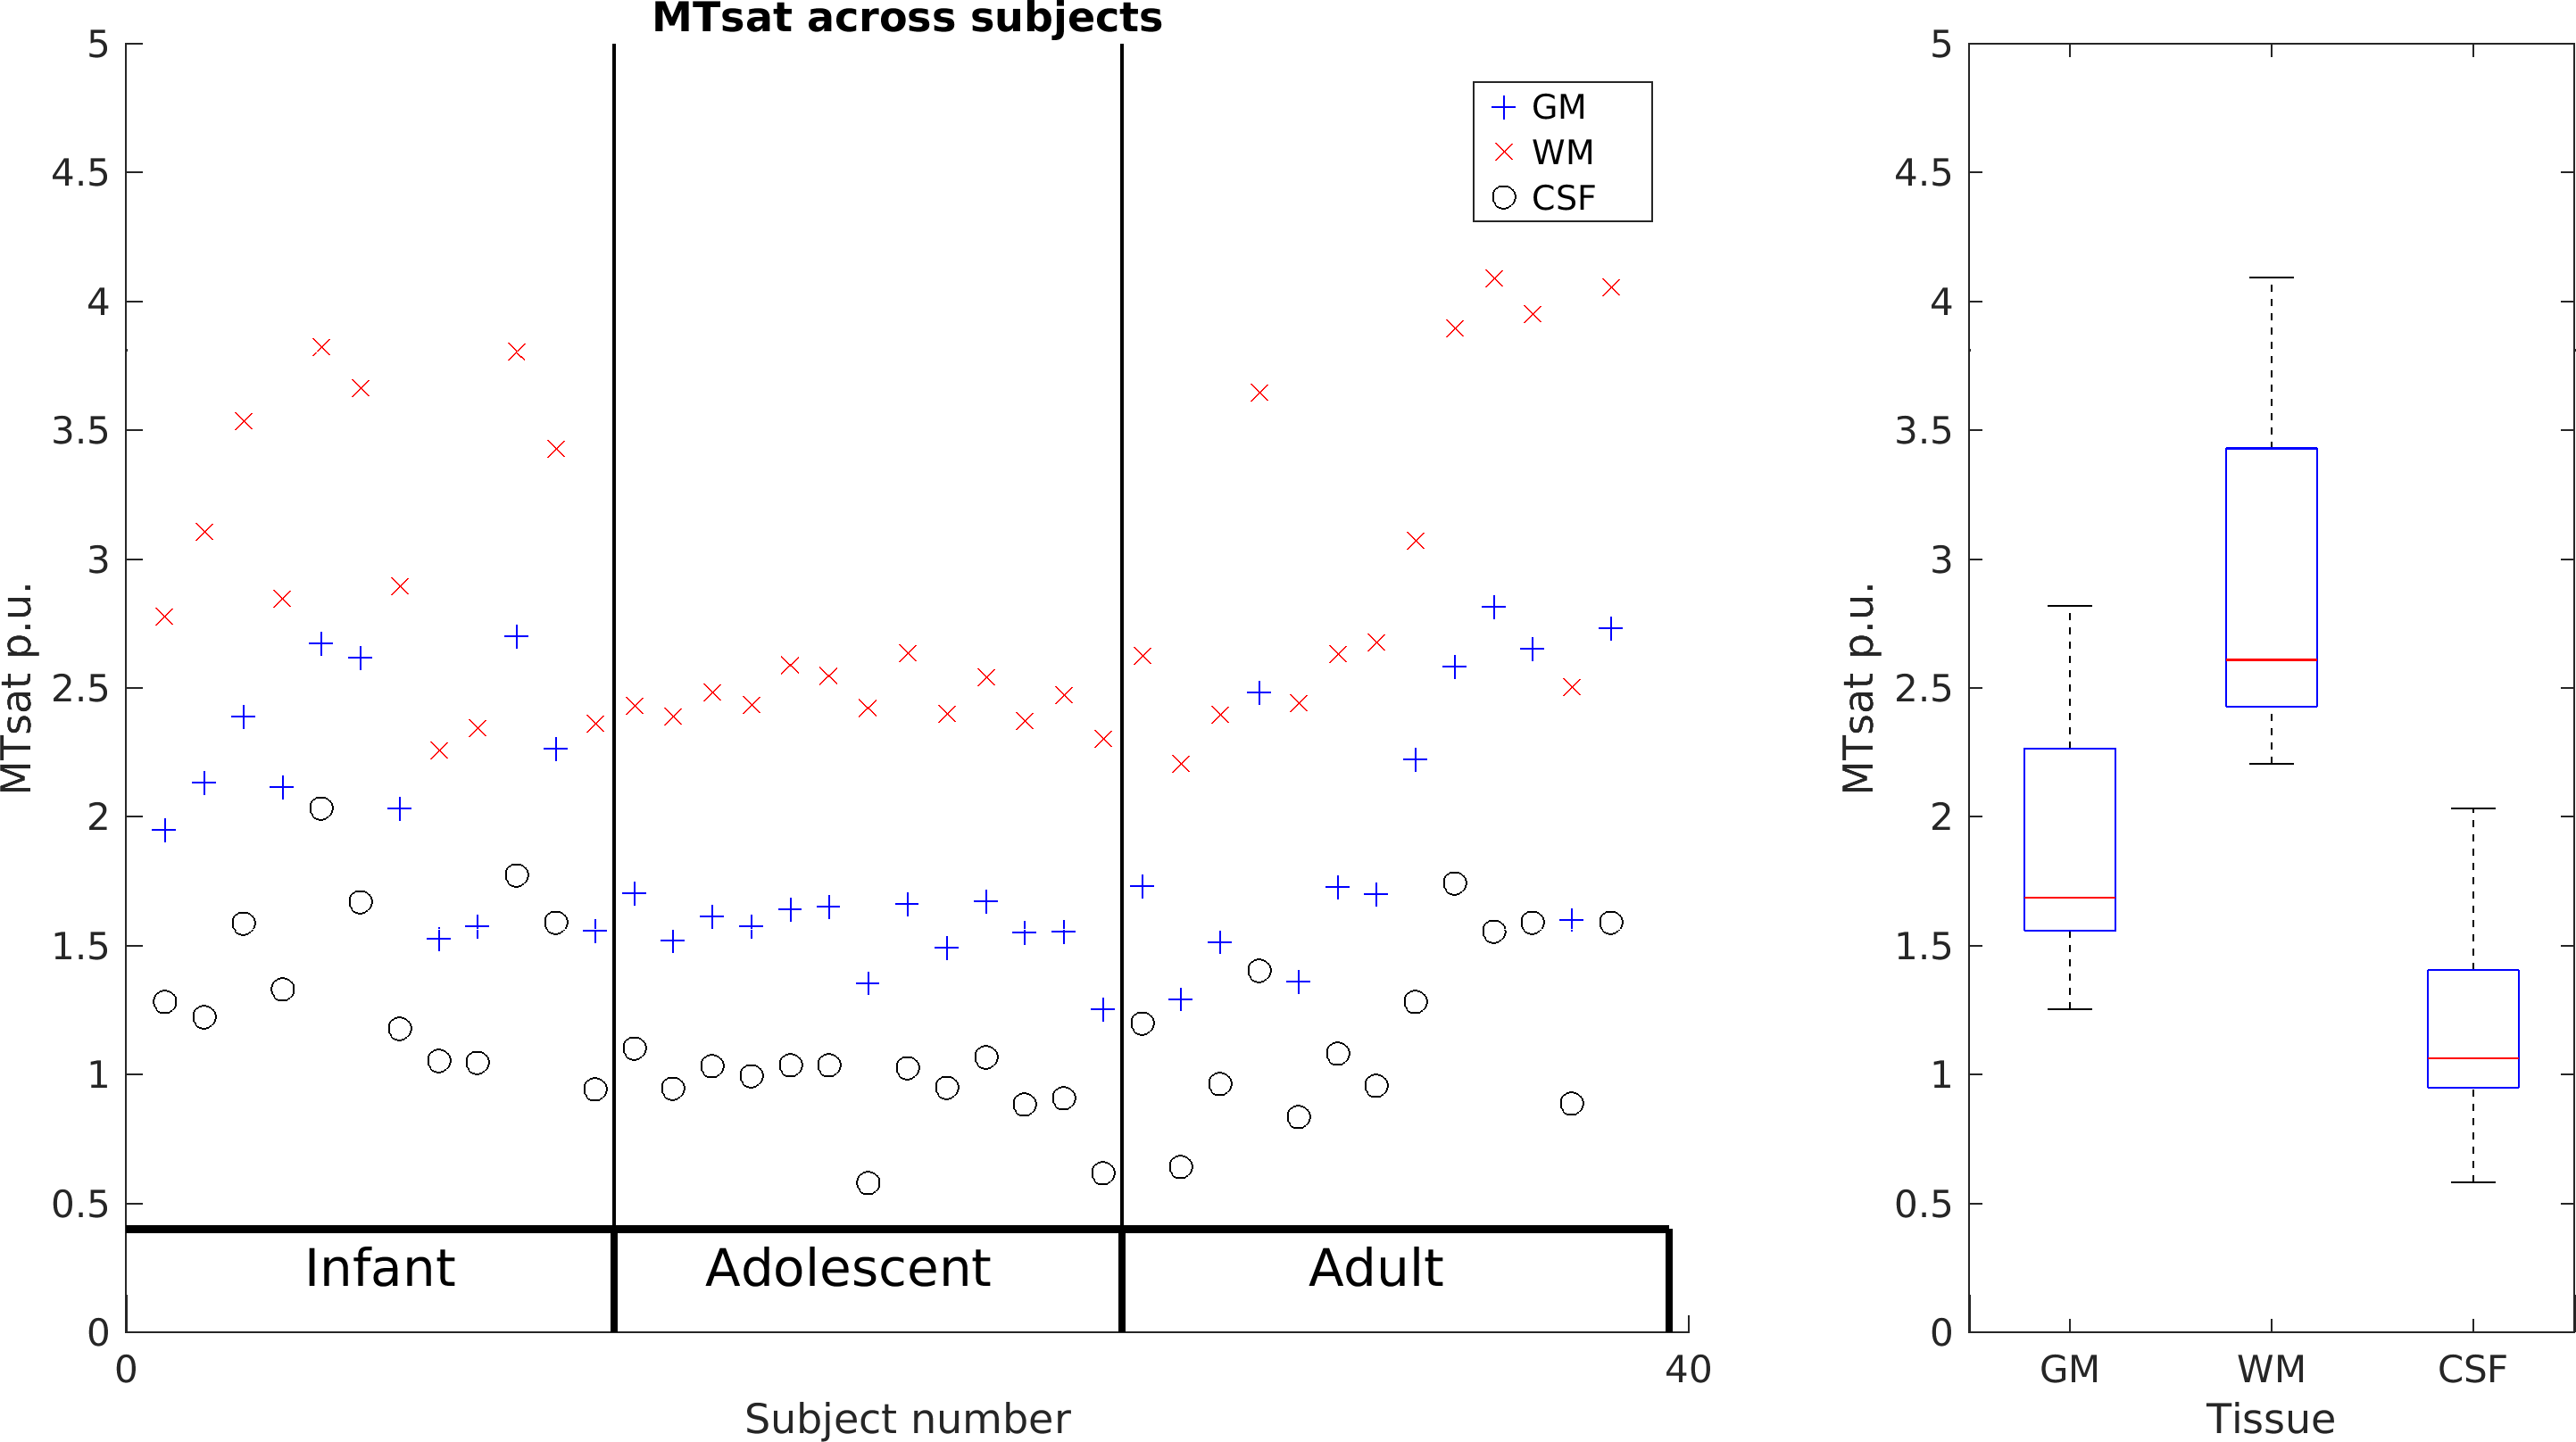
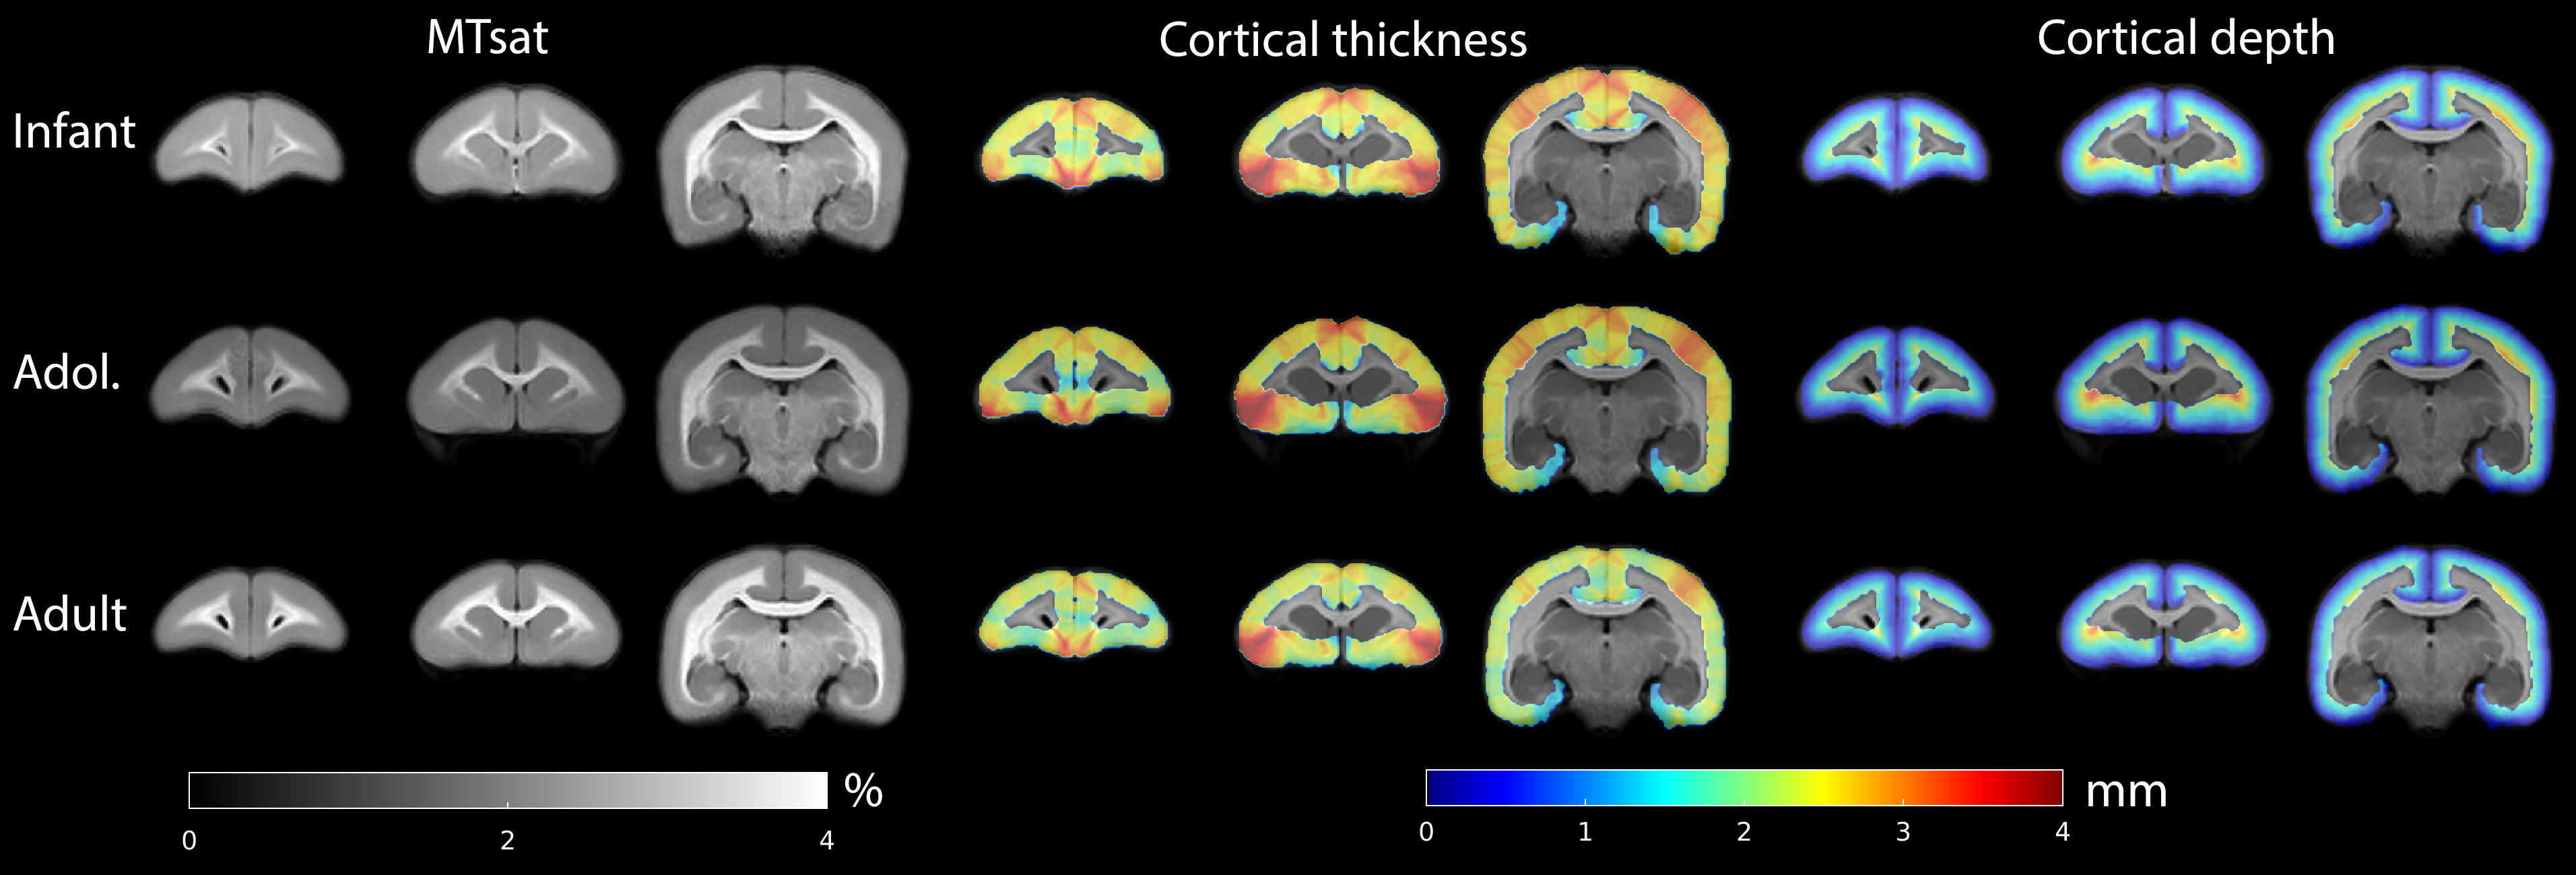
Typical images from an acquisition are shown in Figure 1 with calculated T1 and MTsat maps. The distribution of MTsat values within segmented tissue classes is shown in Figure 2. Comparison of mean values obtained across animals is shown in Figure 3.Figure 4 shows thinner cortex in the adults, in concert with thicker white matter tracts compared to infants and adolescents. There is slightly reduced MTsat signal in the early adolescent animals compared to the infants and adults.
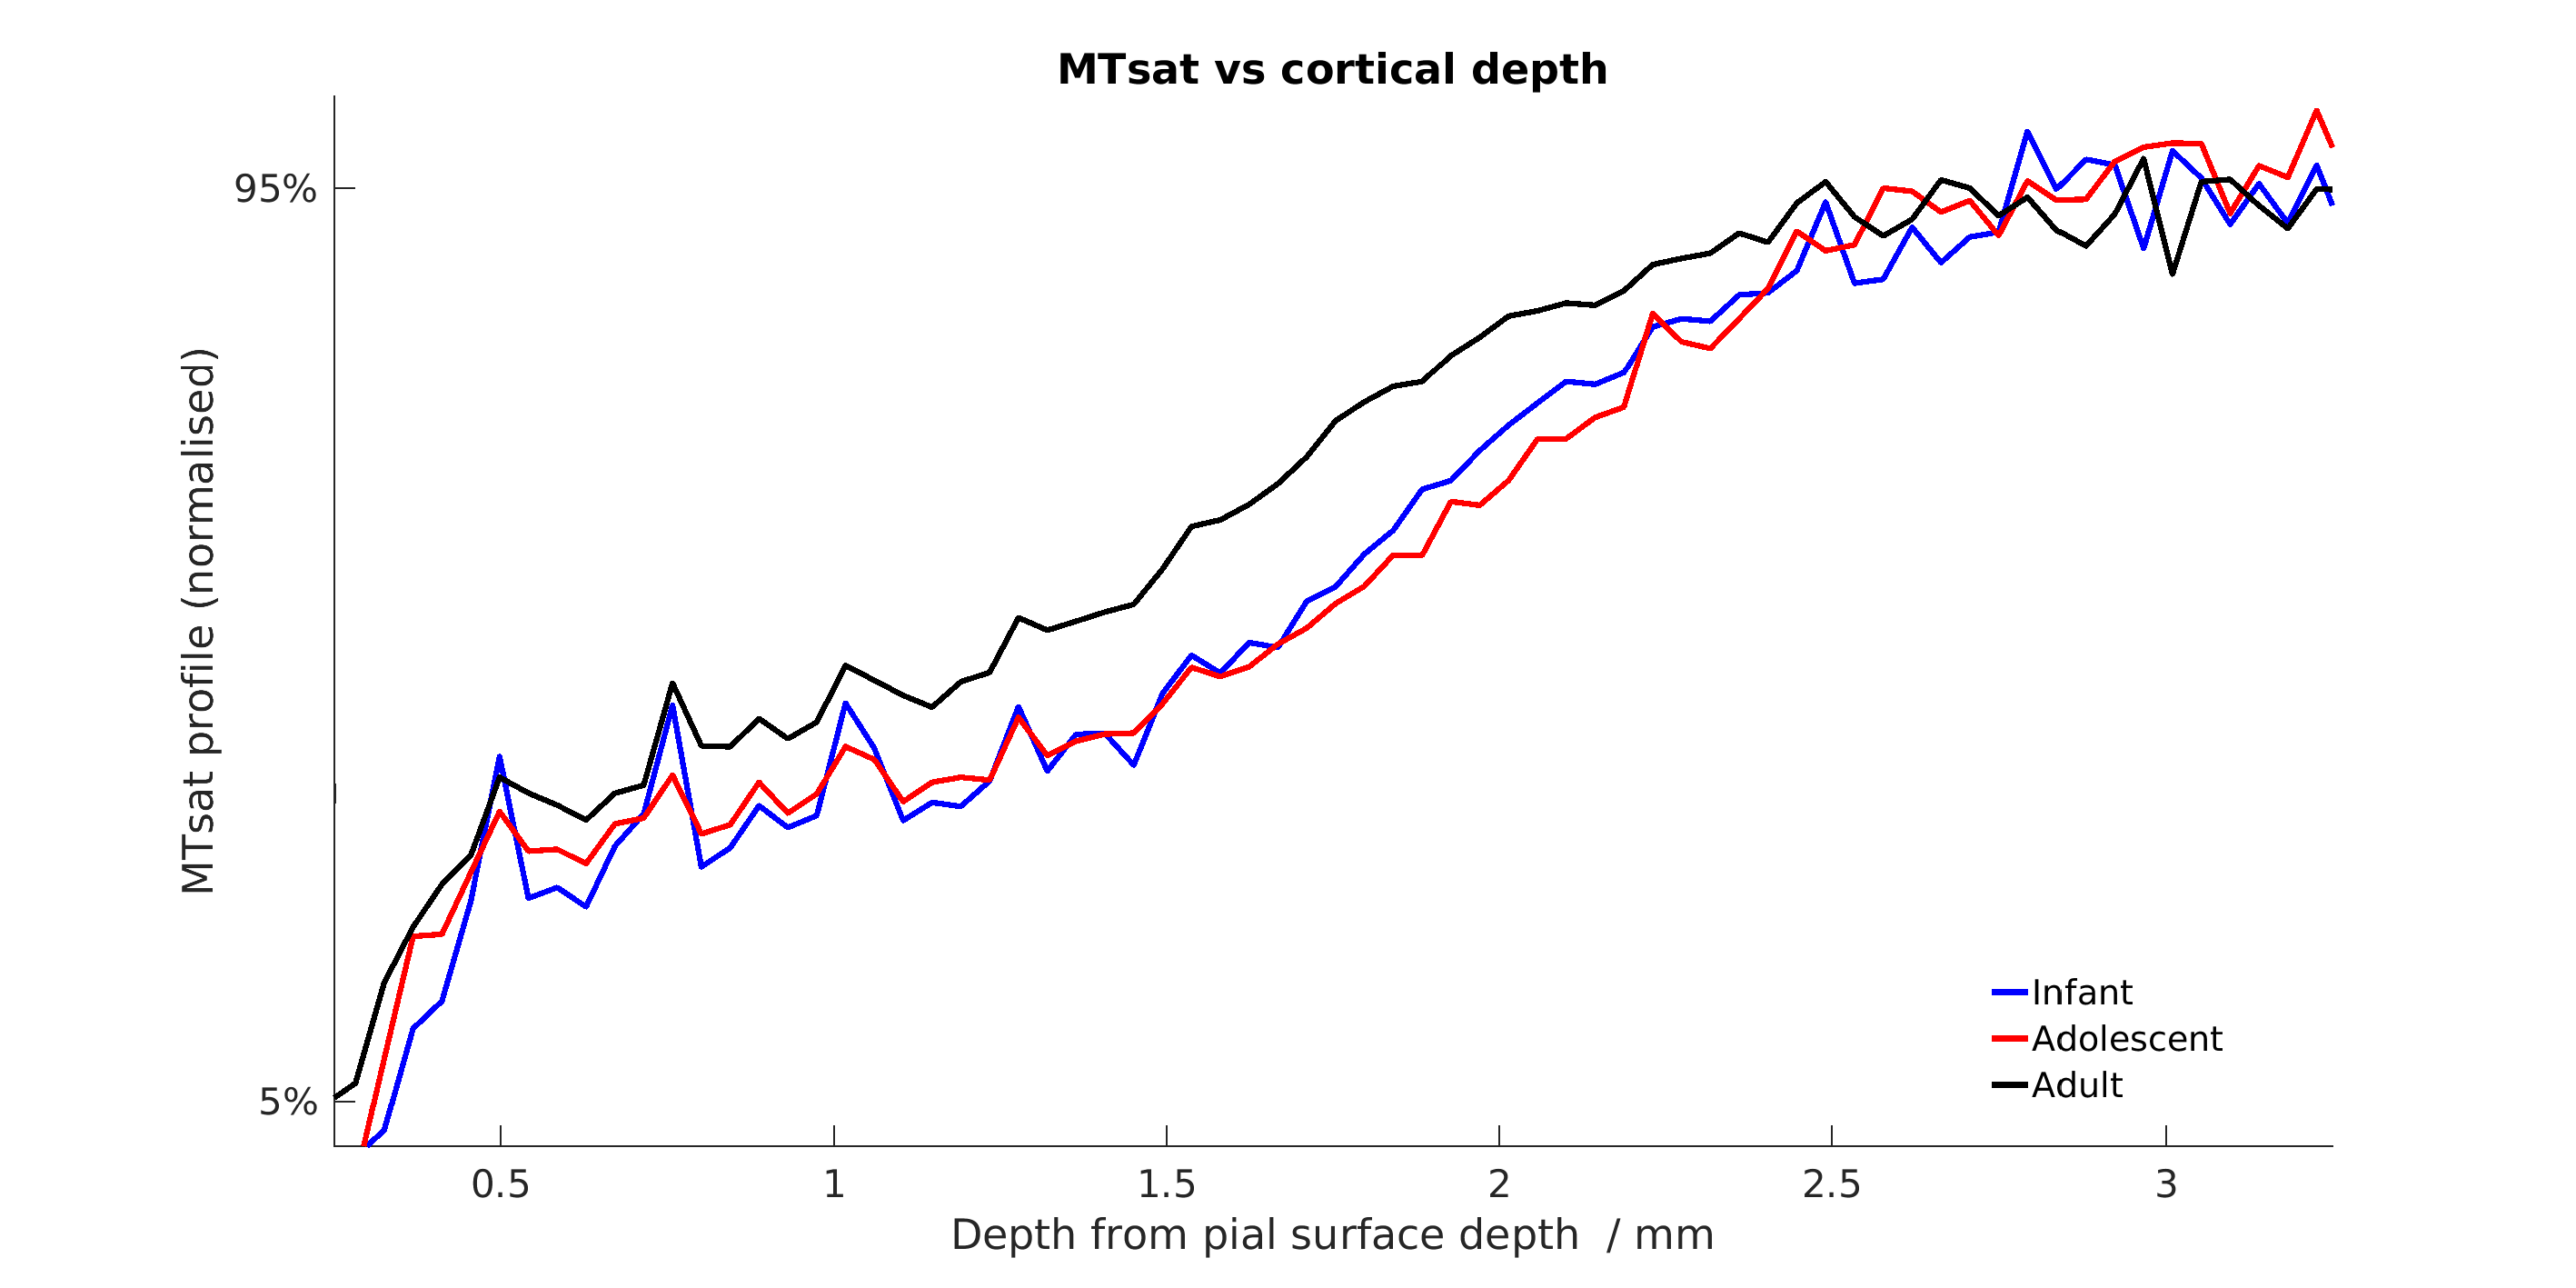
Figure 5 compares cortical MTsat profiles across ages, normalising to the 5-95 percentiles. Infants and adolescents show similar values for the cortex to one another but lower than that found in adults. This confirms previous findings in the marmoset suggesting that rates of myelination are greater in late adolescence and early adulthood. Changes appear to be layer-specific, with the largest differences apparent in the middle layers of cortex.
Measured parameters are broadly comparable across animals, though Figure 2 shows some variability. The scatterplot across subjects shows that GM, WM and CSF seem to scale together for subjects, suggesting a global scaling factor may be needed.
A limitation of this study is the collective analysis of the whole brain and cortex, where it is known that distinct brain areas have highly variable developmental trajectories in both humans and marmosets [9]. Fine variability between scans has to be addressed and it is clear that a more localised analysis is needed, but these results show that MTsat measurements are valuable for assessing changes in microstructure across development.
Acknowledgements
Wellcome Trust (108089/Z/15/Z)
Medical Research Council (MR/M023990/1)
References
1. Kessler, R.C., et al., Lifetime prevalence and age-of-onset distributions of DSM-IV disorders in the National Comorbidity Survey Replication. Arch Gen Psychiatry, 2005. 62(6): p. 593-602.
2. Whitaker, K.J., et al., Adolescence is associated with genomically patterned consolidation of the hubs of the human brain connectome. Proc Natl Acad Sci U S A, 2016. 113(32): p. 9105-10.
3. Natu, V.S., et al., Apparent thinning of human visual cortex during childhood is associated with myelination. Proc Natl Acad Sci U S A, 2019. 116(41): p. 20750-20759.
4. Helms, G., et al., High-resolution maps of magnetization transfer with inherent correction for RF inhomogeneity and T1 relaxation obtained from 3D FLASH MRI. Magn Reson Med, 2008. 60(6): p. 1396-407.
5. Helms, G., H. Dathe, and P. Dechent, Quantitative FLASH MRI at 3T using a rational approximation of the Ernst equation. Magn Reson Med, 2008. 59(3): p. 667-72.
6. Weiskopf, N., et al., Quantitative multi-parameter mapping of R1, PD(*), MT, and R2(*) at 3T: a multi-center validation. Front Neurosci, 2013. 7: p. 95.
7. Weiskopf, N., et al., Unified segmentation based correction of R1 brain maps for RF transmit field inhomogeneities (UNICORT). Neuroimage, 2011. 54(3): p. 2116-24.
8. Sawiak, S.J., et al., Voxel-based morphometry with templates and validation in a mouse model of Huntington's disease. Magn Reson Imaging, 2013. 31(9): p. 1522-31.
9. Sawiak, S.J., et al., Trajectories and Milestones of Cortical and Subcortical Development of the Marmoset Brain From Infancy to Adulthood. Cereb Cortex, 2018. 28(12): p. 4440-4453.
Figures