1432
Age-related differences in myelin content of the human brainstem1NIA, NIH, Baltimore, MD, United States
Synopsis
Very few
MR investigations have been conducted to assess age-dependent myelination differences
in the brainstem, in spite of the brainstem's central role in regulating vital
functions. This is likely due to the small structural scale of the brainstem,
necessitating accurate high spatial resolution imaging for quantitative studies.
Here, we used our recently developed approach to myelin water fraction (MWF)
mapping and found a decrease in myelination with age in different brainstem
regions, with several regions exhibiting a quadratic association. We believe
that this study is the first investigation of MWF changes with normative aging
in the brainstem.
PURPOSE
To investigate differences in myelin content in the brainstem with normative aging. Our main goals are to characterize the regional association of myelination with age in specific brainstem regions, to provide reference values for MWF in the adult brainstem, and to develop further insights into regional brainstem maturation and aging in a life-span sample of healthy adults.METHODS
Subjects and MRIThe study cohort consisted of 125 subjects (54.7±21.7 years) of 57 women (52.6±20.3 years) and 68 men (56.5±22.9 years) spanning the age range between 21 and 94 years. Participants underwent a mini-mental state exam (MMSE men = 28.5±1.5; women = 29±1.4). Age and MMSE were not statistically different between men and women. For each participant, a whole brain MWF map was derived using BMC-mcDESPOT (1-3). For this, ten 3D spoiled-gradient-recalled-echo (SPGR) images acquired with flip angles (FAs) of [2 4 6 8 10 12 14 16 18 20]°, echo time of (TE) 1.37ms and repetition time (TR) of 5ms, and ten 3D balanced steady-state free-precession images acquired with FAs of [2 7 11 16 24 32 40 60]°, TE of 2.8 ms, TR of 5.8 ms, and radiofrequency excitation pulse phase increments of 0o or 180o to account for off-resonance effects (4). All images were acquired with a voxel size of 1.6 mm × 1.6 mm × 1.6 mm. Further, we used the DAM to correct for B1 inhomogeneity (5). The DAM protocol consists of two fast spin-echo images acquired with FAs of 45° and 90°, TE of 102 ms, TR of 3000 ms, and acquisition voxel size of 2.6 mm × 2.6 mm × 4 mm. All images were obtained with a field-of-view of 240 mm × 208 mm × 150 mm and reconstructed on the scanner to a voxel size of 1 mm × 1 mm × 1 mm.
Image processing and statistical analysis
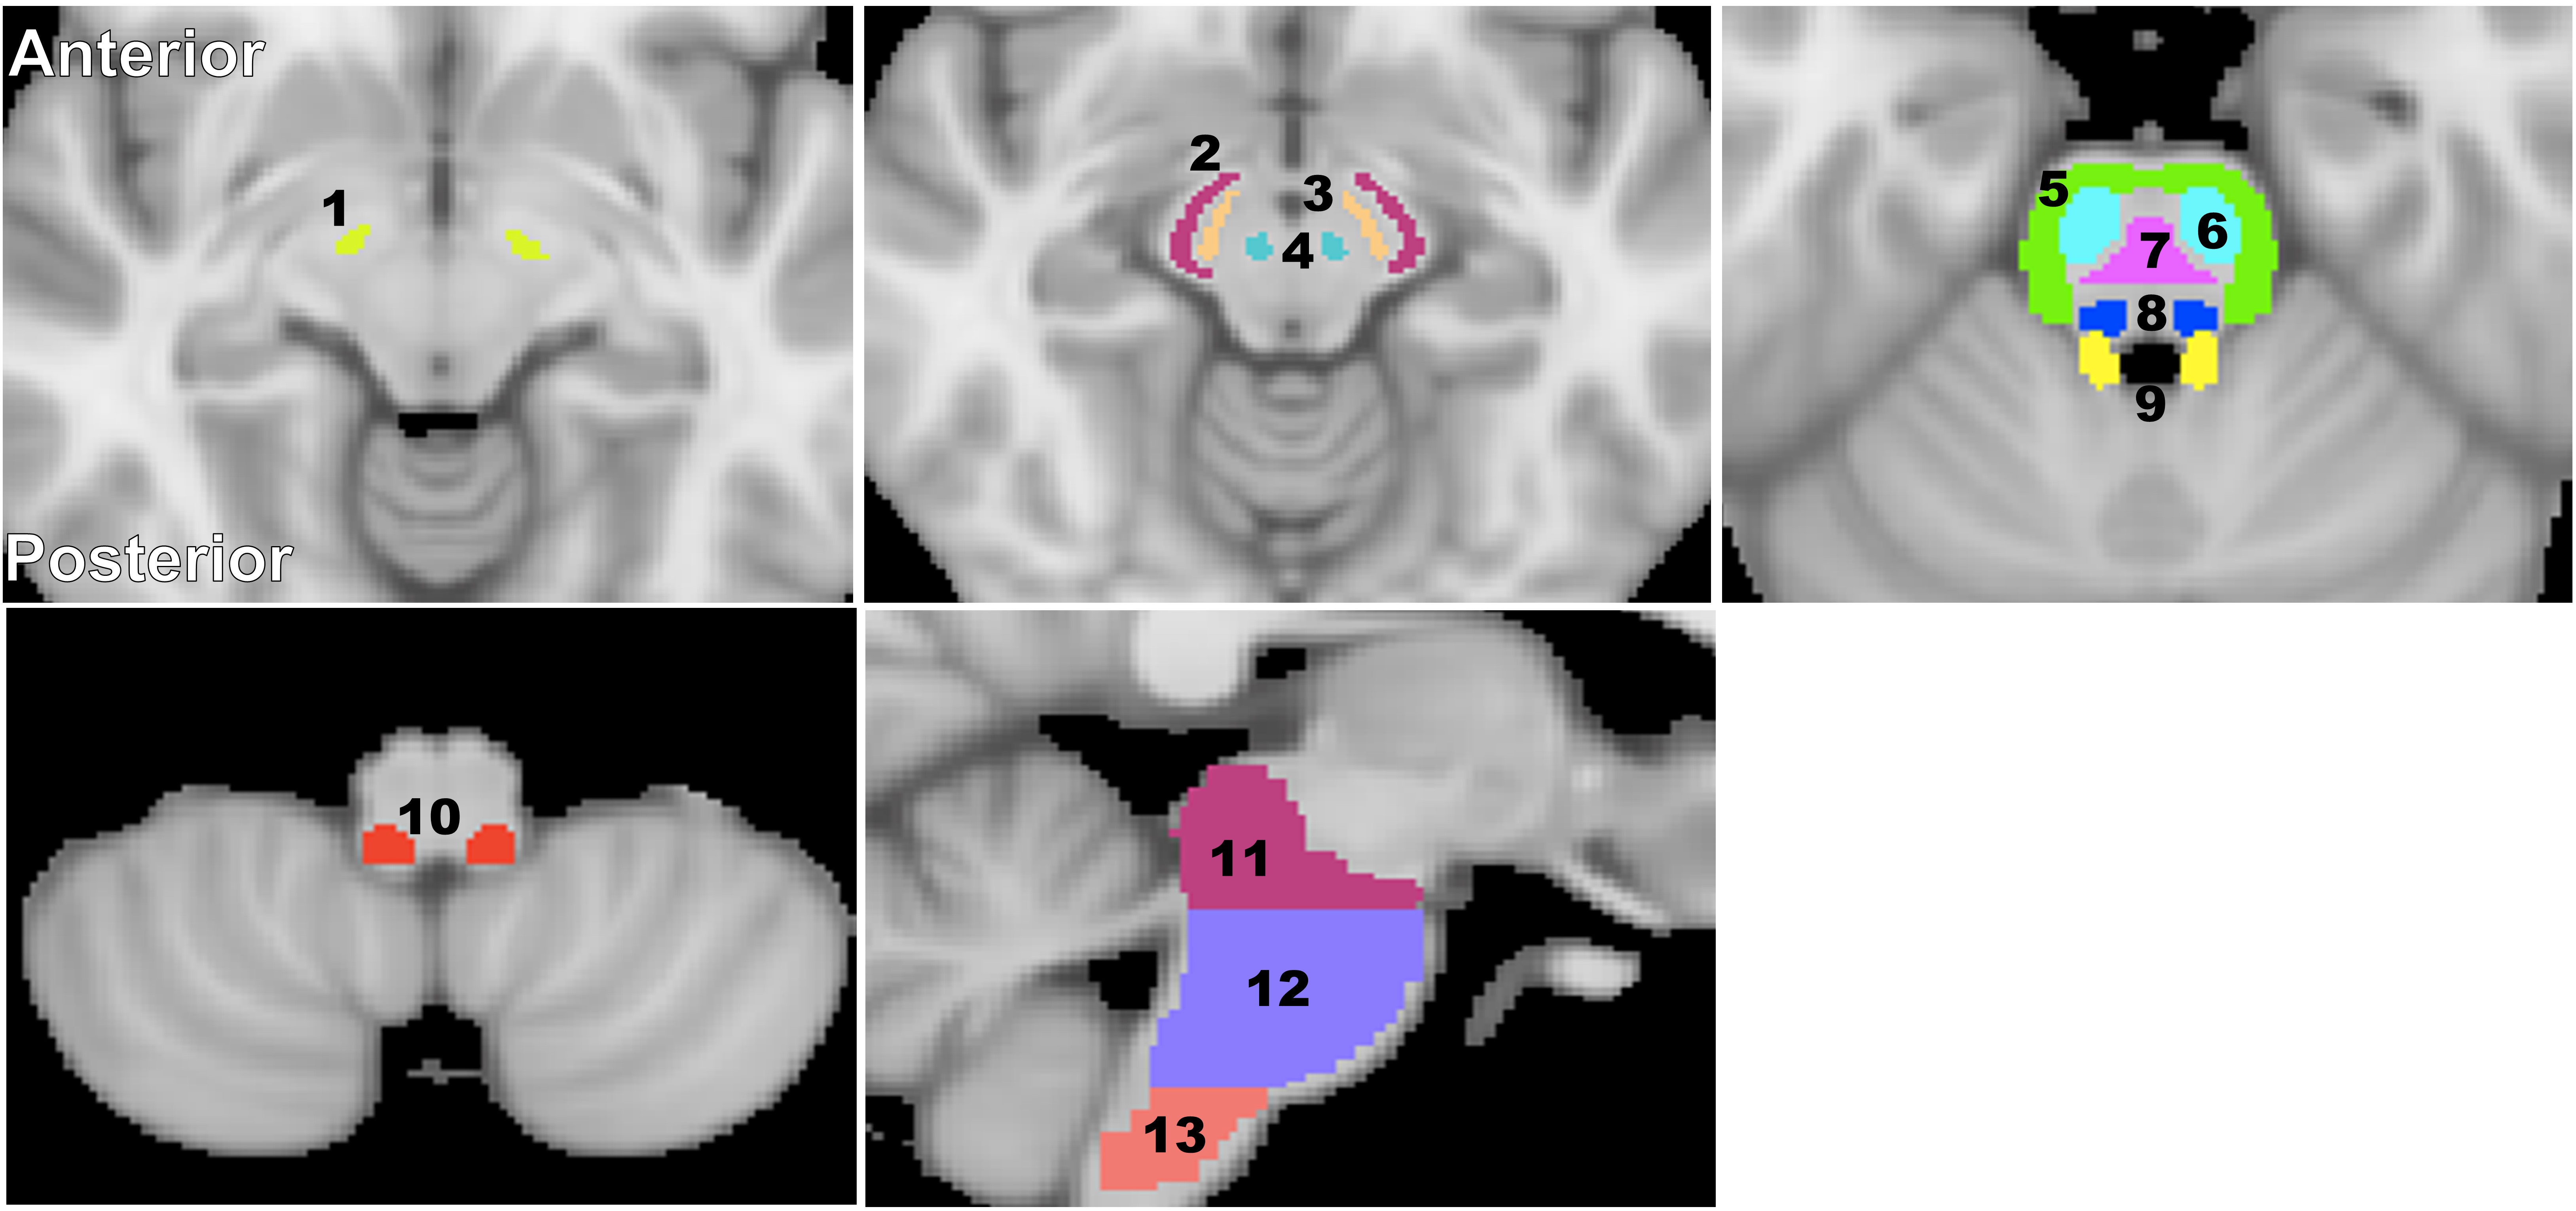
For each participant, a whole-brain MWF map was calculated using the BMC-mcDESPOT analysis (1-3). Further, the averaged SPGR image over FAs was nonlinearly registered to the MNI space and the computed transformation matrix was then applied to the corresponding MWF map using the FSL software (6). Fourteen brainstem substructures were chosen as regions of interest (ROIs) from the Johns Hopkins University (JHU) ICGM-DTI 81 atlas and the Talairach structural atlas provided in FSL to cover all major brainstem substructures (Fig. 1). Finally, For each ROI, a linear regression model was evaluated with MWF as the dependent variable and with sex and age as the independent variables. Further, for each ROI we also evaluated a model that incorporates a quadratic age term, that is, age2 (7, 8).
RESULTS & DISCUSSION
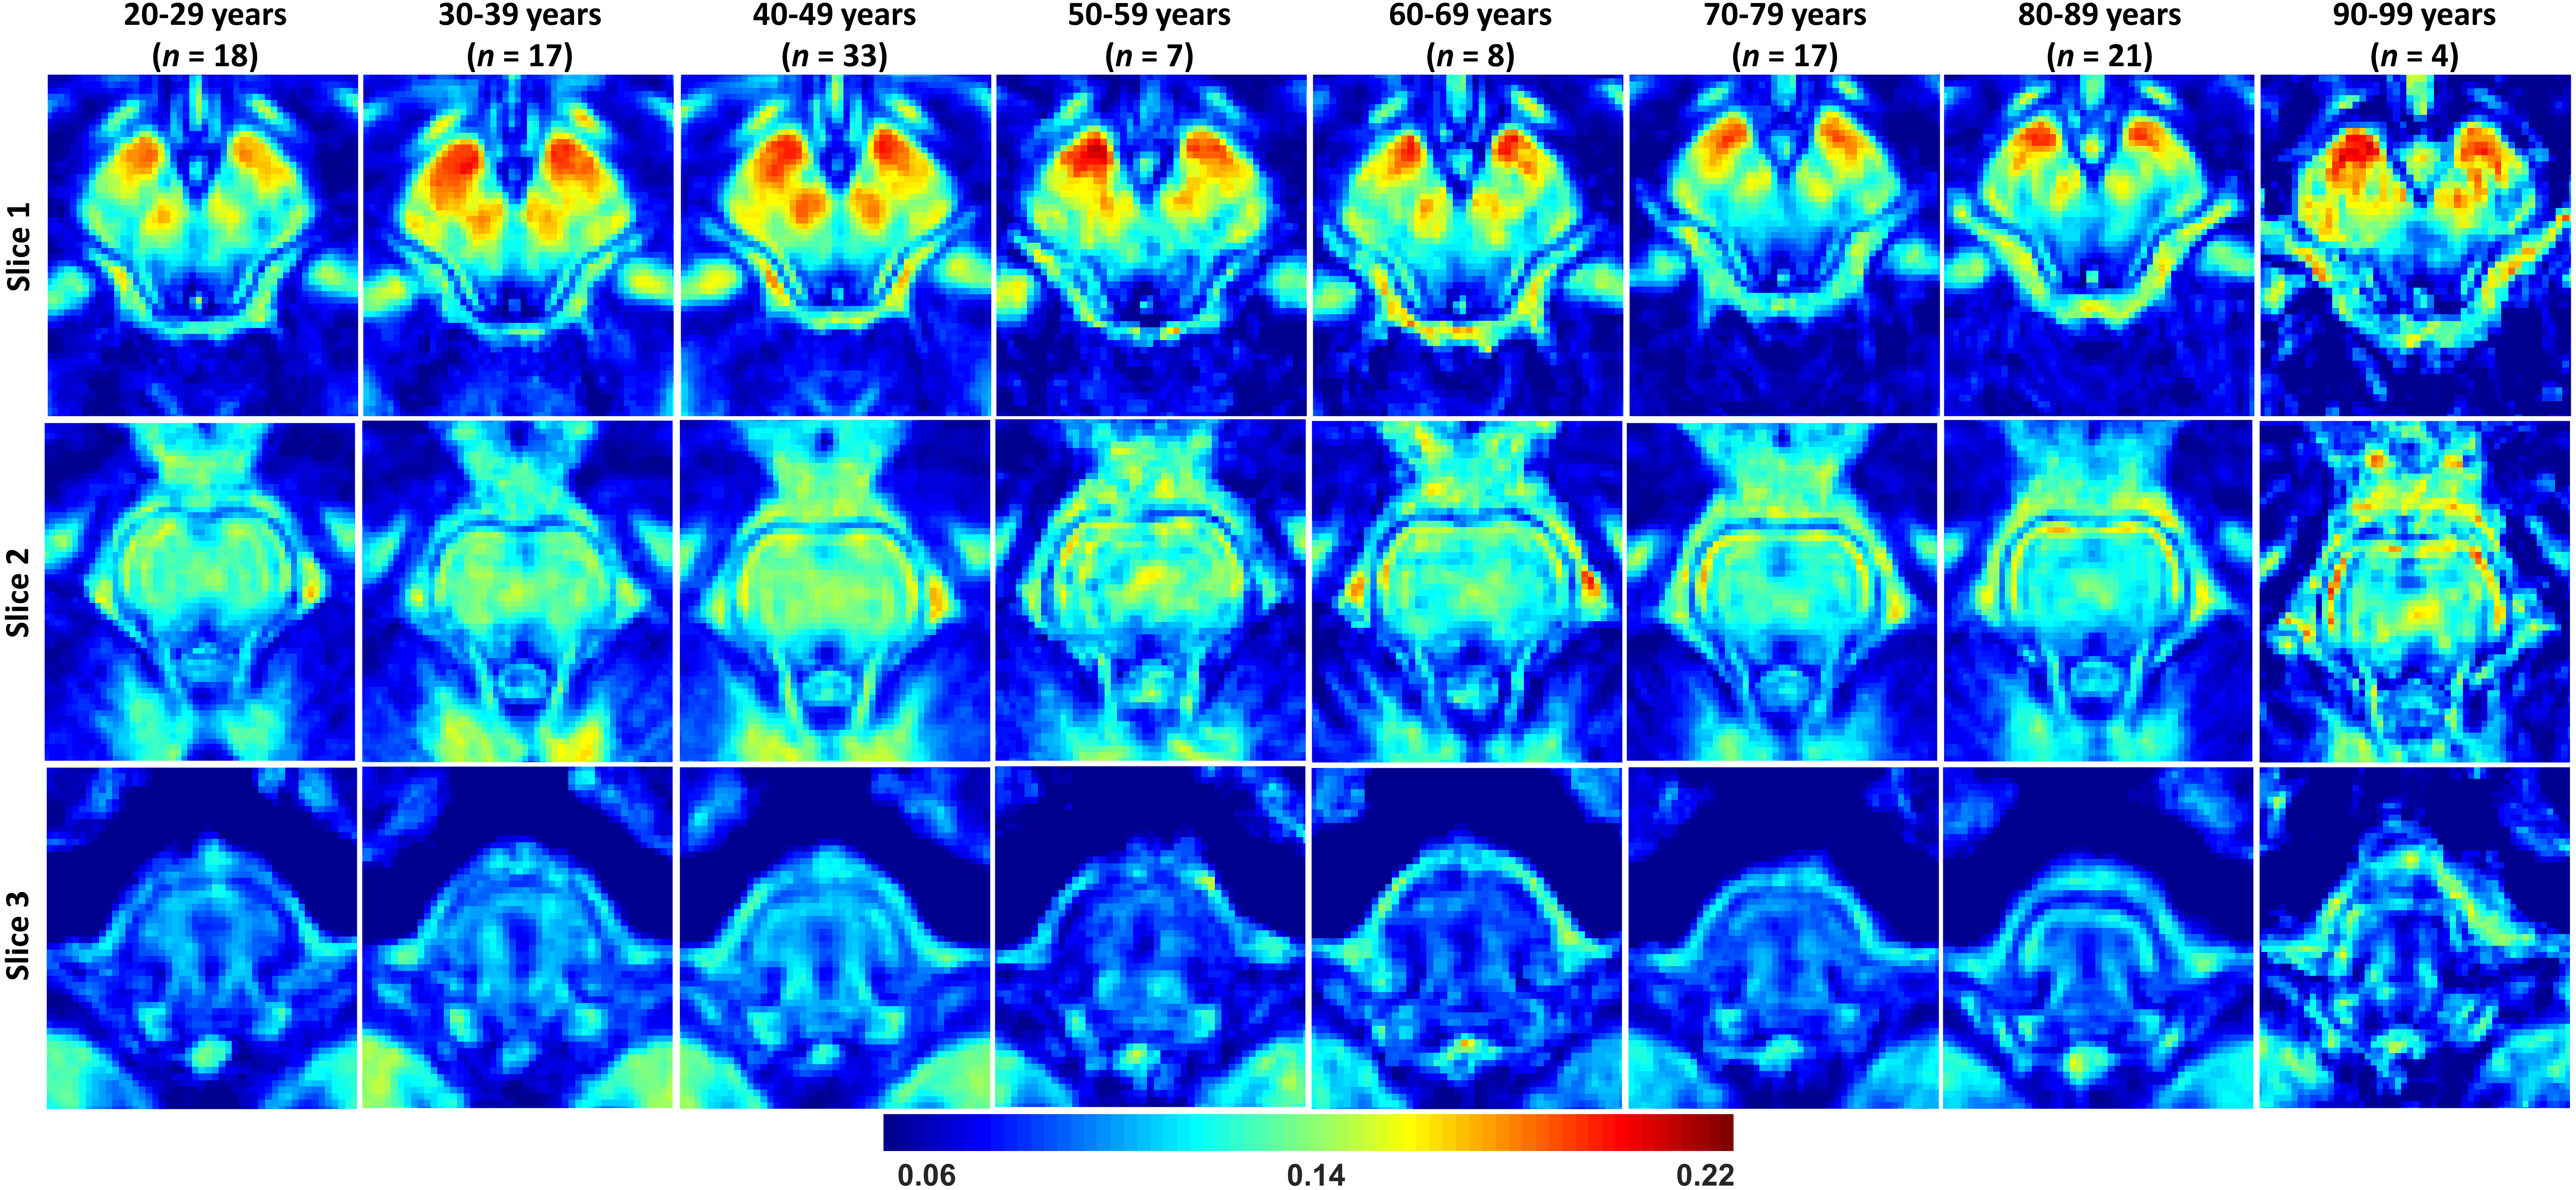
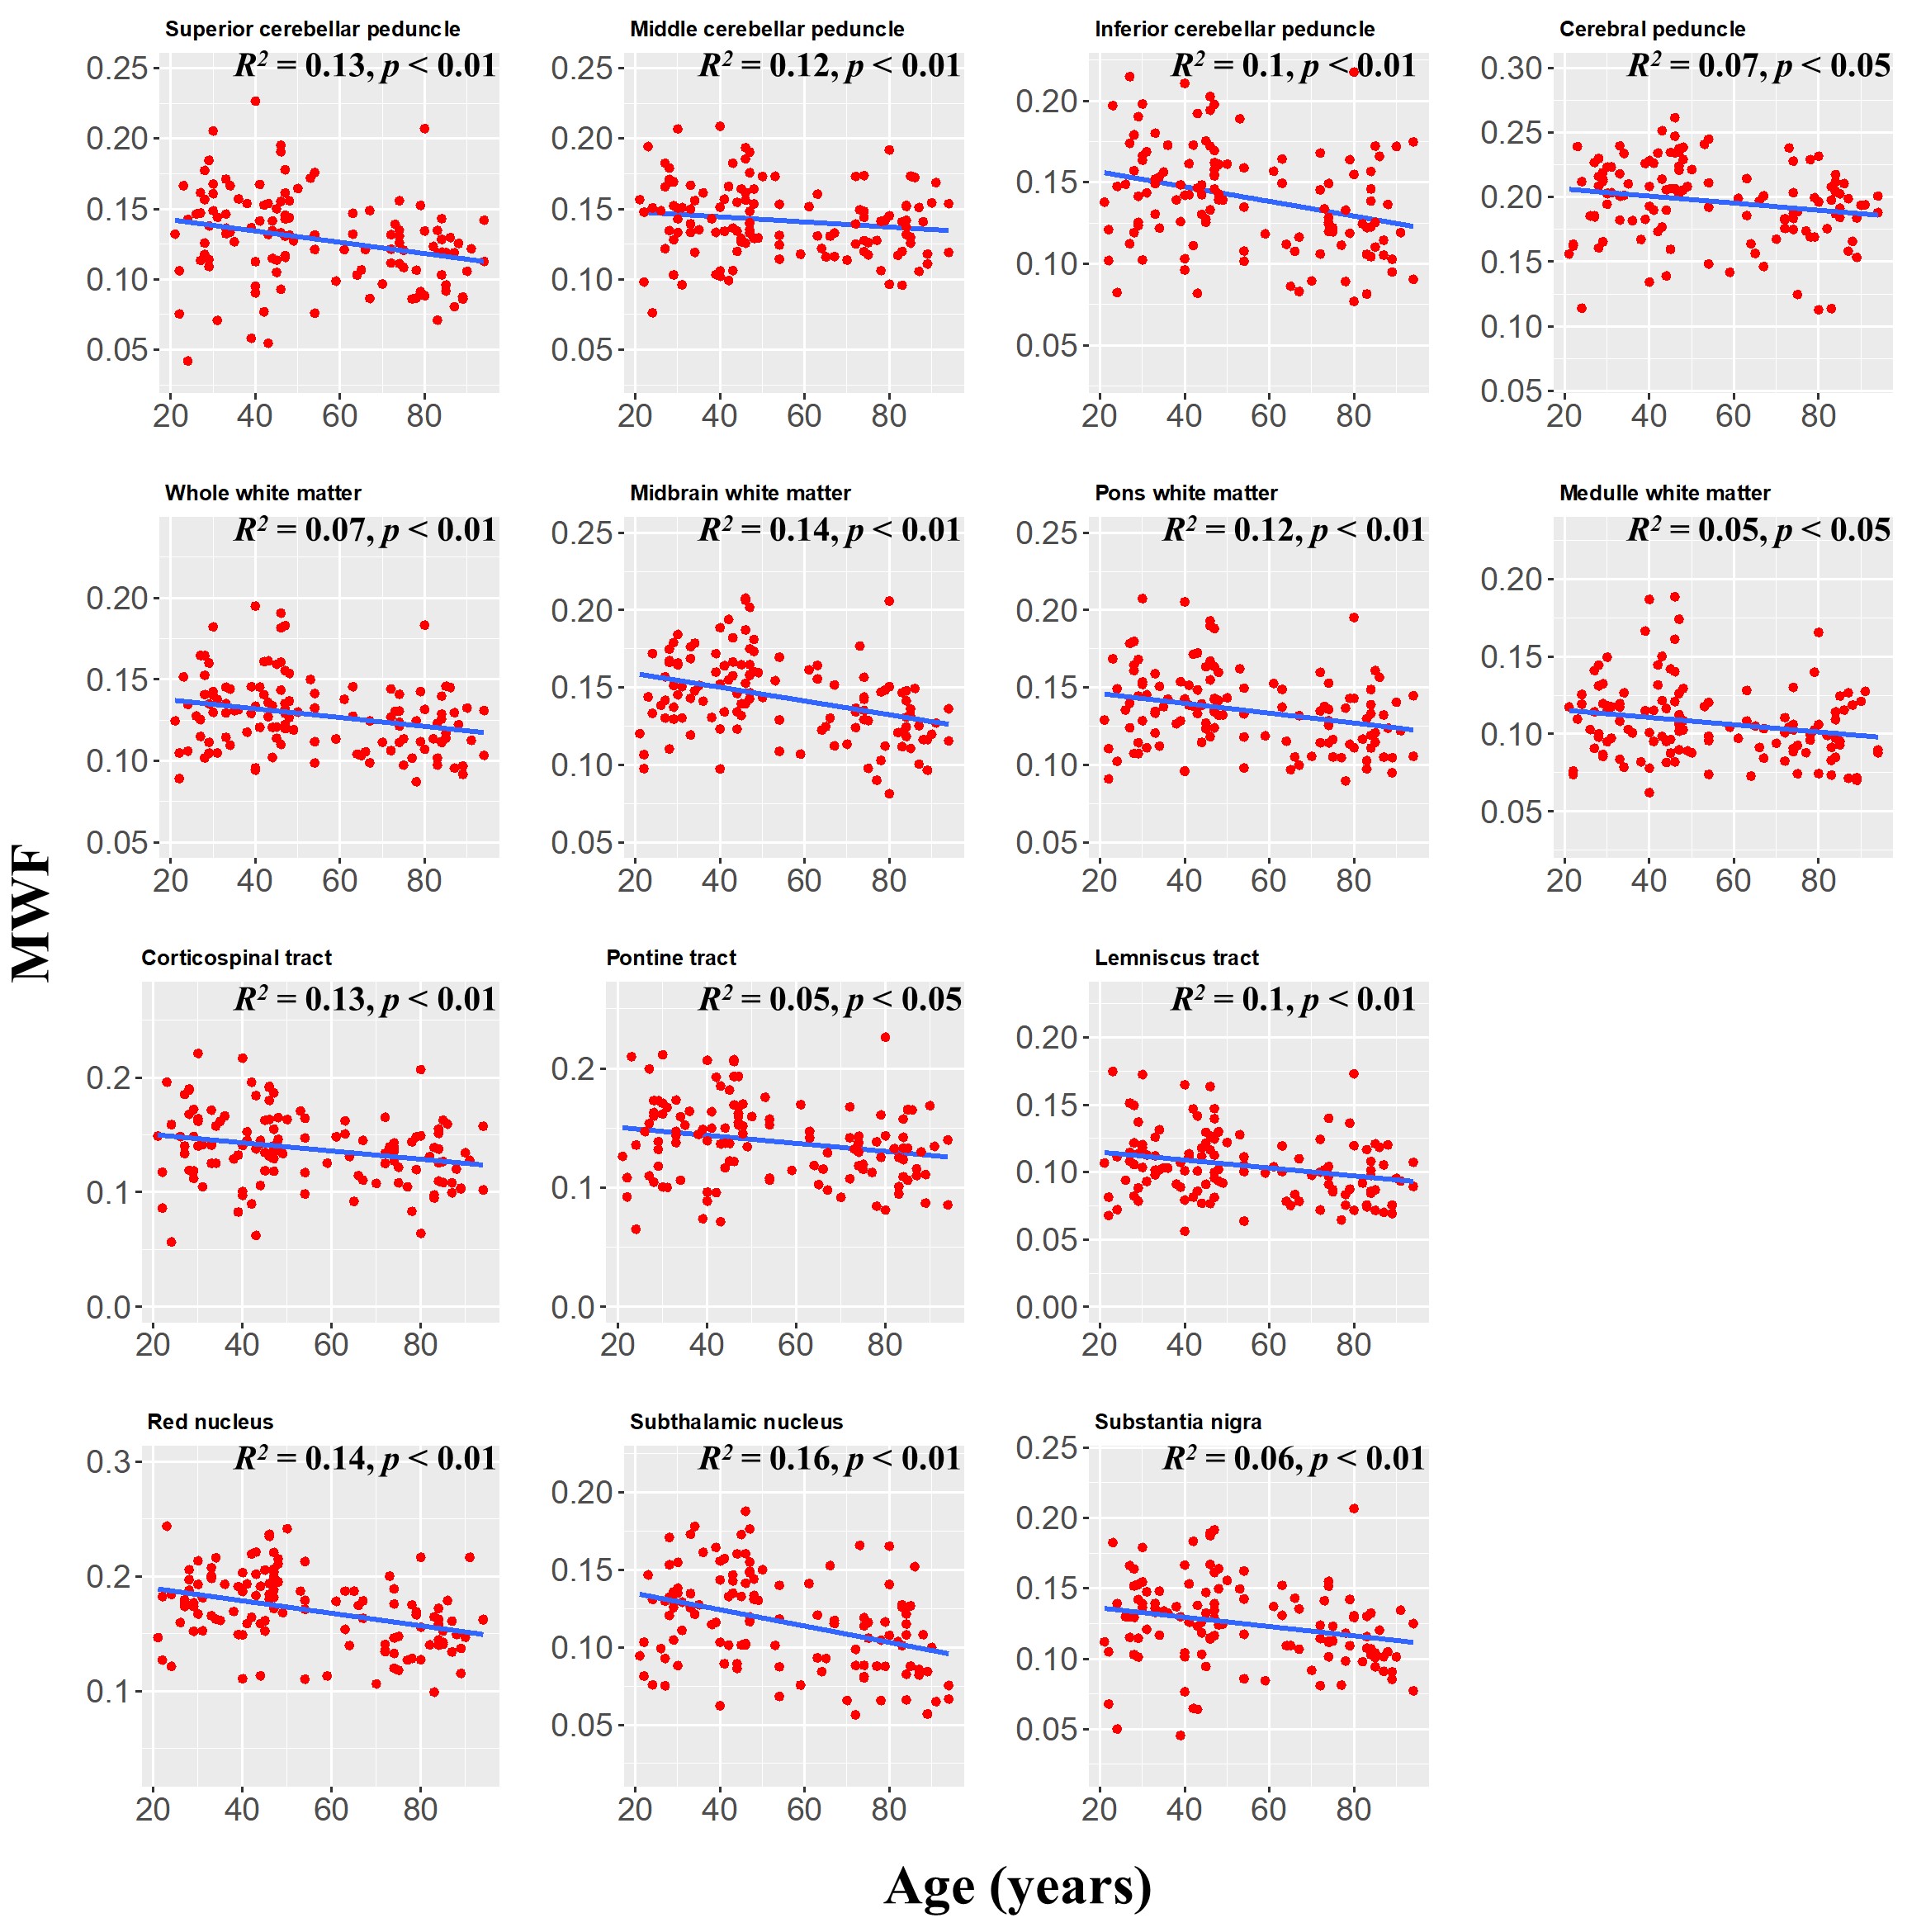
MWF maps exhibit substantial tissue contrast between different brainstem substructures (Fig. 2). Further, different regions exhibit different trends of MWF as a function of age with the superior brainstem regions exhibiting greater MWF values. The plots in Fig. 3 indicate a decrease in MWF from young adulthood through old age with the effect of age significant in all brain regions evaluated. In addition, the most rapid declines in MWF with age were found in the midbrain, red nucleus, and subthalamic nucleus regions, which exhibited the greatest negative slopes. Studies have shown that these regions are particularly susceptible to increased iron deposition during the processes of normative aging and neurodegeneration (9-12). This iron may serve to catalyze free radical reactions promoting lipid peroxidation and oxidative tissue damage, and subsequent myelin breakdown (13). Moreover, the midbrain also exhibited a rapid decline of MWF with age; this is consistent with morphometry-based studies showing that the midbrain specifically exhibits significant atrophy with aging (14, 15). Accelerated demyelination of the midbrain observed here, and subsequent axonal loss, could explain these consistent observations. Further, we observed progressively decreasing myelin content from the superior to inferior brainstem. We speculate that this is because the midbrain, the superior brainstem structure, contains large bundles of myelinated axons, such as the cerebral peduncle, while the medulla, in the inferior position, contains cell bodies of most of the cranial nerves in addition to gray matter nuclei with unmyelinated axons.The effect of sex on myelination was significant in only three brainstem regions. It is likely that our model is underpowered to detect such sex differences; therefore, an increased cohort size could provide further insights into differences in myelination between males and females. Nonetheless, because the brainstem is critical for basic brain functions and is a locus for many phylogenetically conserved functions and anatomy throughout mammals, sex dimorphism is not expected to be as pronounced in comparison to higher-level cortical areas.
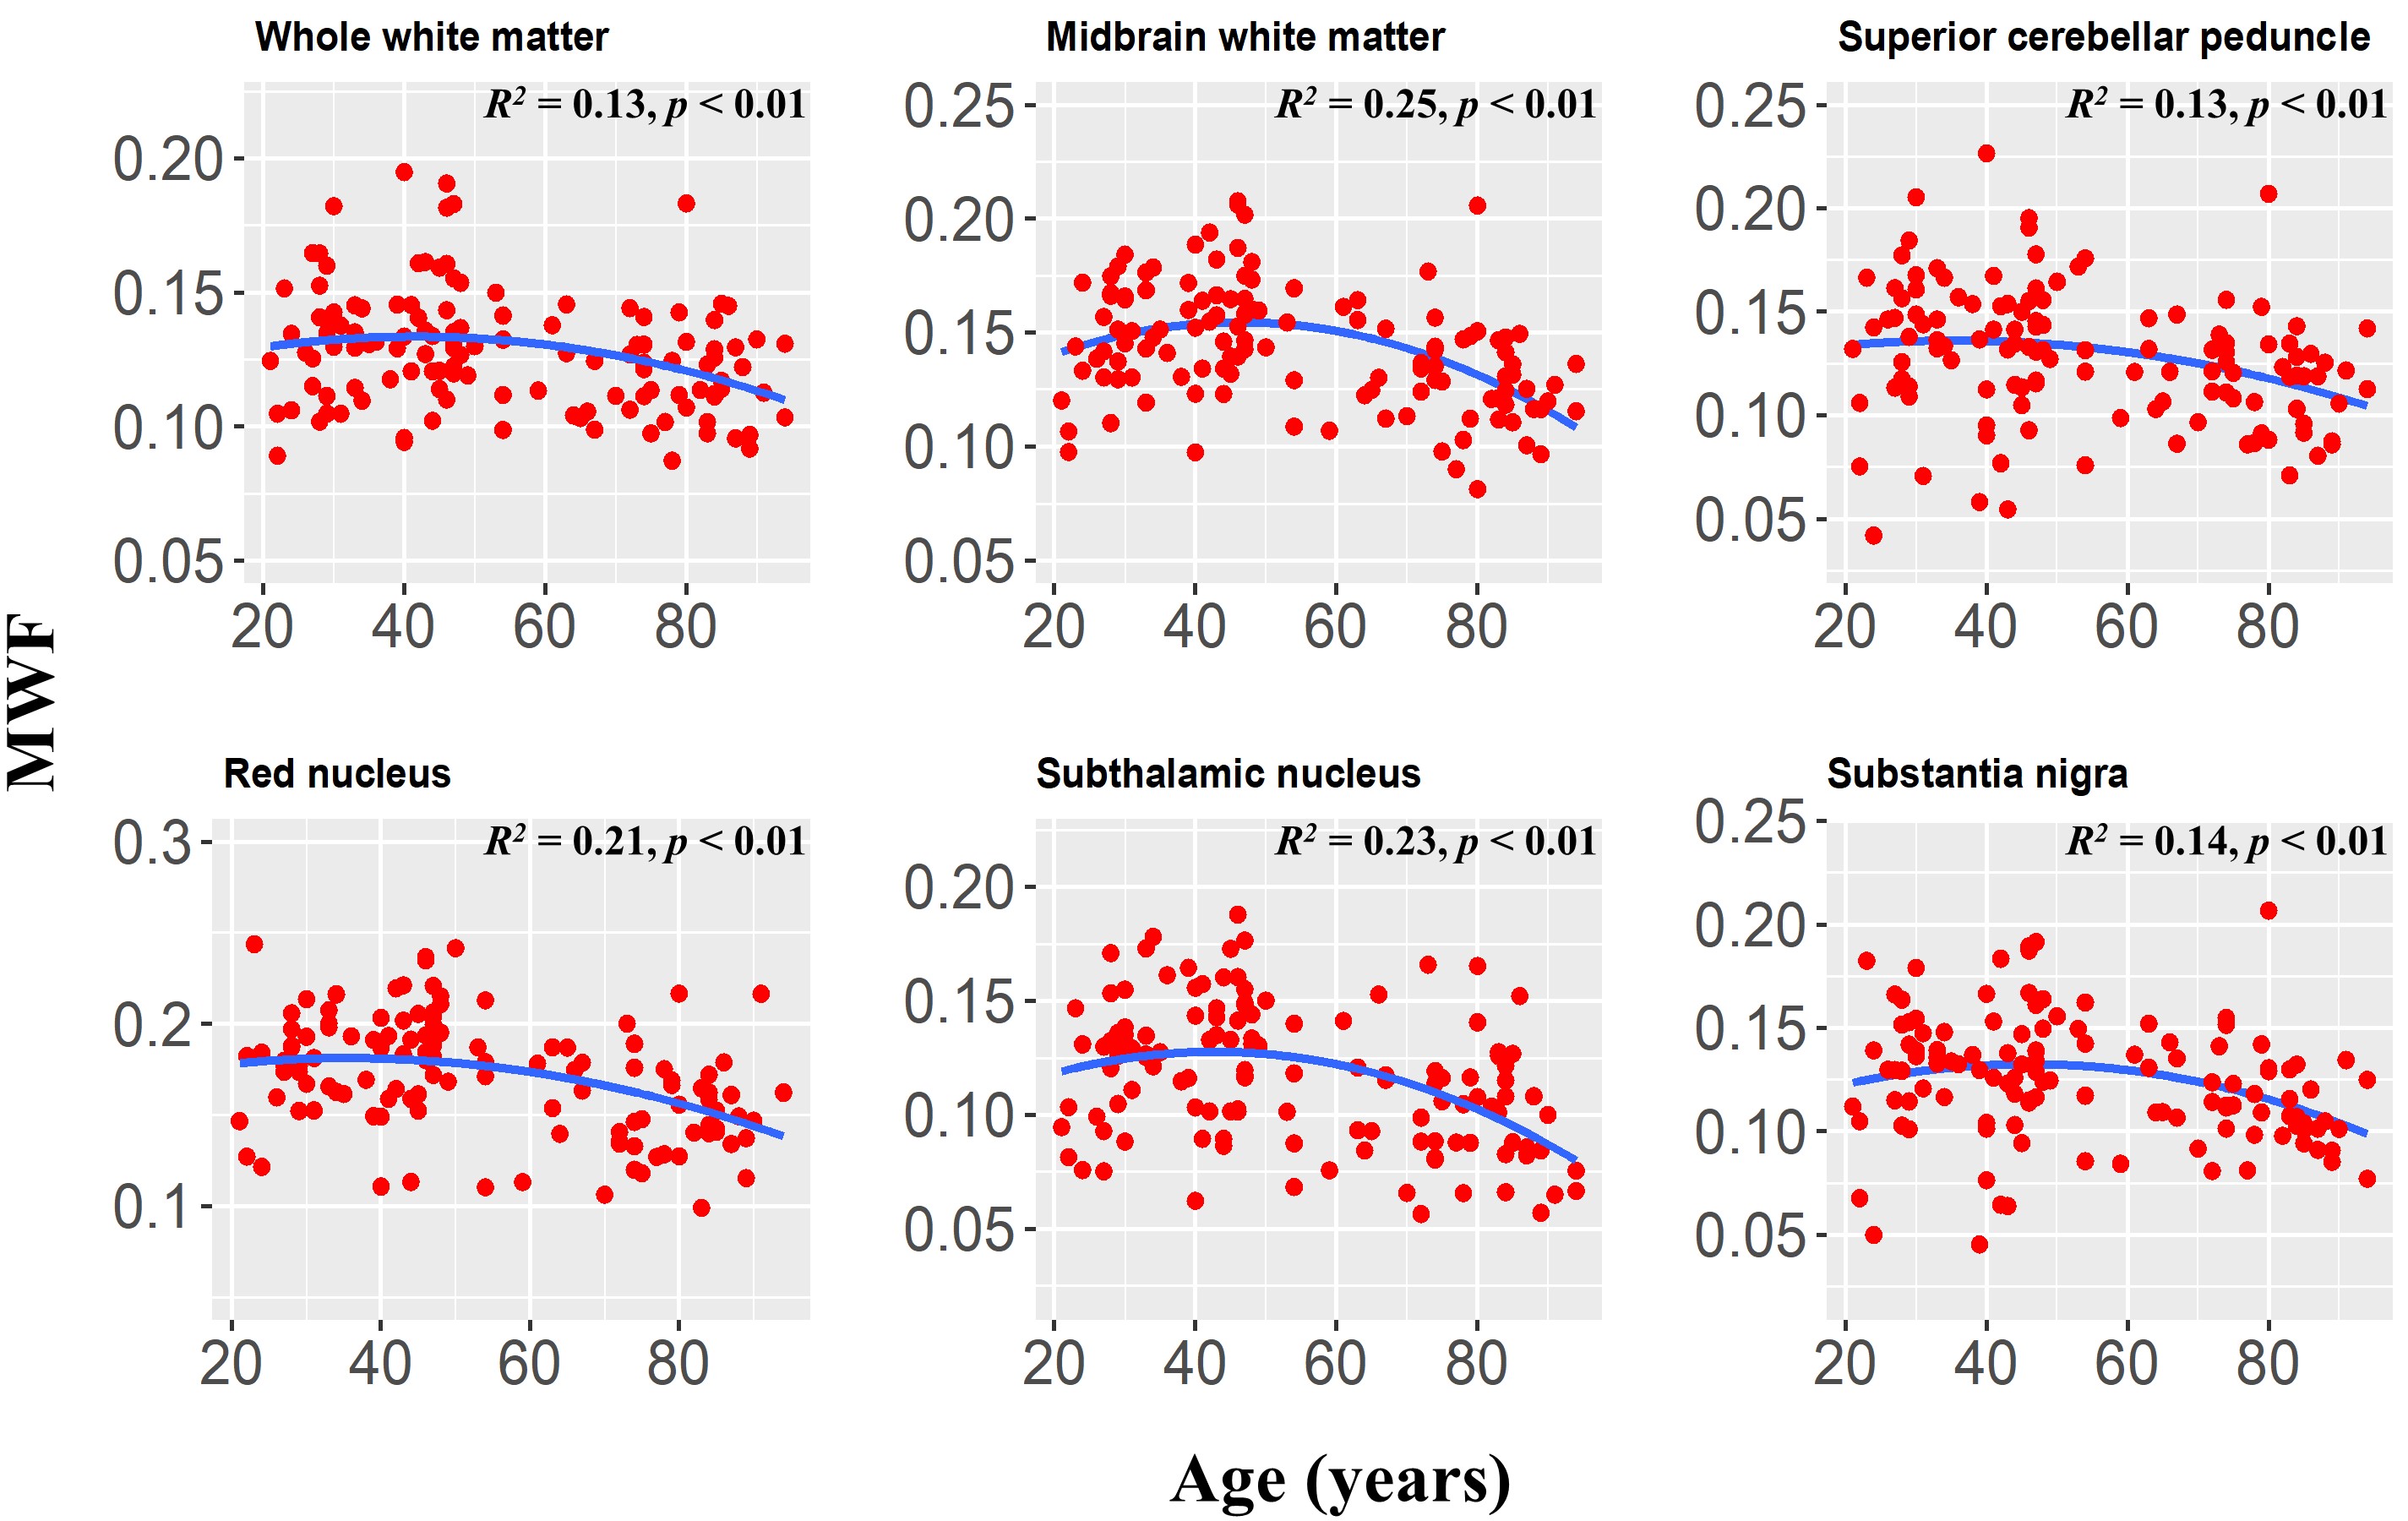
Finally, the statistical analysis indicated that the effect of the age2 term was significant or close to significance in six brainstem regions (Fig. 4). This suggests progressive myelination continuing into middle age followed by more rapid myelin loss. We note that similar trends have recently been reported in the cerebrum (7, 8).
CONCLUSIONS
We have demonstrated the feasibility of high-resolution myelin imaging in the brainstem. We found that myelin content decreases with normal aging throughout brainstem regions, with substantial regional variation, as expected. Our work also provides a baseline for investigations of neurodegenerative diseases, such as Alzheimer’s and Parkinson’s diseases.Acknowledgements
References
1. Bouhrara M, Spencer RG. Incorporation of nonzero echo times in the SPGR and bSSFP signal models used in mcDESPOT. Magnetic resonance in medicine. 2015;74(5):1227-35.
2. Bouhrara M, Spencer RG. Improved determination of the myelin water fraction in human brain using magnetic resonance imaging through Bayesian analysis of mcDESPOT. NeuroImage. 2016;127:456-71.
3. Bouhrara M, Spencer RG. Rapid simultaneous high-resolution mapping of myelin water fraction and relaxation times in human brain using BMC-mcDESPOT. NeuroImage. 2017;147:800-11.
4. Deoni SC. Correction of main and transmit magnetic field (B0 and B1) inhomogeneity effects in multicomponent-driven equilibrium single-pulse observation of T1 and T2. Magnetic resonance in medicine. 2011;65(4):1021-35.
5. Stollberger R, Wach P. Imaging of the active B1 field in vivo. Magnetic resonance in medicine. 1996;35(2):246-51.
6. Jenkinson M, Beckmann CF, Behrens TE, Woolrich MW, Smith SM. FSL. NeuroImage. 2012;62(2):782-90.
7. Arshad M, Stanley JA, Raz N. Adult age differences in subcortical myelin content are consistent with protracted myelination and unrelated to diffusion tensor imaging indices. NeuroImage. 2016;143:26-39.
8. Bouhrara M, Rejimon AC, Cortina LE, Khattar N, Bergeron CM, Ferrucci L, et al. Adult brain aging investigated using BMC-mcDESPOT based myelin water fraction imaging. Neurobiology of aging. 2019.
9. Langkammer C, Ropele S, Pirpamer L, Fazekas F, Schmidt R. MRI for iron mapping in Alzheimer's disease. Neuro-degenerative diseases. 2014;13(2-3):189-91.
10. Pfefferbaum A, Adalsteinsson E, Rohlfing T, Sullivan EV. MRI estimates of brain iron concentration in normal aging: comparison of field-dependent (FDRI) and phase (SWI) methods. NeuroImage. 2009;47(2):493-500.
11. Wang D, Li W-B, Wei X-E, Li Y-H, Dai Y-M. An Investigation of Age-Related Iron Deposition Using Susceptibility Weighted Imaging. PloS one. 2012;7(11):e50706.
12. Ward RJ, Zucca FA, Duyn JH, Crichton RR, Zecca L. The role of iron in brain ageing and neurodegenerative disorders. The Lancet Neurology. 2014;
13(10):1045-60. 13. Möller HE, Bossoni L, Connor JR, Crichton RR, Does MD, Ward RJ, et al. Iron, Myelin, and the Brain: Neuroimaging Meets Neurobiology. Trends in Neurosciences. 2019.
14. Luft AR, Skalej M, Schulz JB, Welte D, Kolb R, Burk K, et al. Patterns of age-related shrinkage in cerebellum and brainstem observed in vivo using three-dimensional MRI volumetry. Cerebral cortex (New York, NY : 1991). 1999;9(7):712-21.
15. Lambert C, Chowdhury R, Fitzgerald THB, Fleming SM, Lutti A, Hutton C, et al. Characterizing aging in the human brainstem using quantitative multimodal MRI analysis. Frontiers in human neuroscience. 2013;7:462.
Figures