1431
Age-dependence of g-ratio values for subcortical white matter structures in the human brain1NIA, NIH, Baltimore, MD, United States
Synopsis
Emerging evidence indicates
that myelination and axonal abnormalities could lead to alterations of brain
connectivity, contributing to a myriad of neurological disorders. Measurement of myelin to axonal volume, as
defined by the g-ratio, has been shown to represent a sensitive and specific
metric of neurodevelopment and neurodegeneration. However, only a single study to
date has sought to evaluate age-related differences in g-ratio in the adult
human brain. Here, we introduce and compare two novel approaches to g-ratio
mapping. Both methods revealed a quadratic relationship between g-ratio and age
in a large cohort of cognitively unimpaired participants.
PURPOSE
The g-ratio is defined as the inner-to-outer diameter of a myelinated axon; its calculation requires estimation of myelin volume fraction (MVF) and axonal volume fraction (AVF). A recent report found that g-ratio increases linearly with age (1), interpreted as reduction in myelin throughout adulthood and decreased axonal density at older ages. However, this is inconsistent with several reports of increased myelination throughout adulthood followed by decrease at older ages (2, 3). This discrepancy is likely due to use of magnetization transfer saturation for estimation of MVF which, while sensitive to myelin content, is not specific. Here, we introduce two novel approaches for g-ratio mapping, the first based on NODDI (4), a multi-shell diffusion technique, for AVF estimation, and the second based on NODDI-DTI (5), a single-shell diffusion approximation of NODDI. MVF was determined using BMC-mcDESPOT, a direct method for myelin mapping (2, 6-9). These new g-ratio approaches were compared on a large age-range cohort of cognitively unimpaired participants and used to establish the g-ratio differences across the lifespan.METHODS
Subjects and MRIThe study cohort for the NODDI-DTI-based approach to g-ratio estimation consisted of 133 subjects (49.2±21.5years); 59 women (47.7±19.9years) and 74 men (50.5±22.5years), spanning an age-range between 21 and 94 years. The NODDI-based method was applied to a subset of 53 participants (41.5±18.6years); 25 women (43.7±19.4years) and 28 men (39.7±17.5years), spanning an age-range between 21 and 83 years. Age was not statistically different between men and women in either group. The imaging protocol was:
· NODDI-DTI: diffusion-weighted images (DWI) were acquired with single-shot EPI, repetition time (TR) 10000ms, echo time (TE) 70ms, b-values 0 and 700s/mm2 in 32 directions, and voxel size 2mm×2mm×2mm.
· NODDI: DWI were acquired using single-shot EPI with TR of 10000ms, TE of 67ms, three b-values of 0, 700, and 2000s/mm2 (encoded in 32 directions), and voxel size 3mm×3mm×3mm.
· BMC-mcDESPOT: ten 3D spoiled-gradient-recalled-echo (SPGR) images were acquired with flip angles (FAs) [2 4 6 8 10 12 14 16 18 20]°, TE 1.37ms, TR 5ms, and ten 3D balanced steady-state free-precession images were acquired with FAs [2 7 11 16 24 32 40 60]°, TE 2.8ms, TR 5.8ms, and radiofrequency excitation pulse phase increments of 0o or 180o to account for off-resonance effects (10). Images were acquired with voxel size 1.6mm×1.6mm×1.6mm. We used the dual angle method (DAM) to correct for B1 inhomogeneity (11), based on two fast spin-echo images acquired with FAs 45° and 90°, TE 102ms, TR 3000ms, and acquisition voxel size 2.6mm×2.6mm×4mm. All images were obtained with field-of-view 240mm×208mm×150mm and reconstructed to a voxel size 2mm×2mm×2mm.
Image processing and statistical analysis
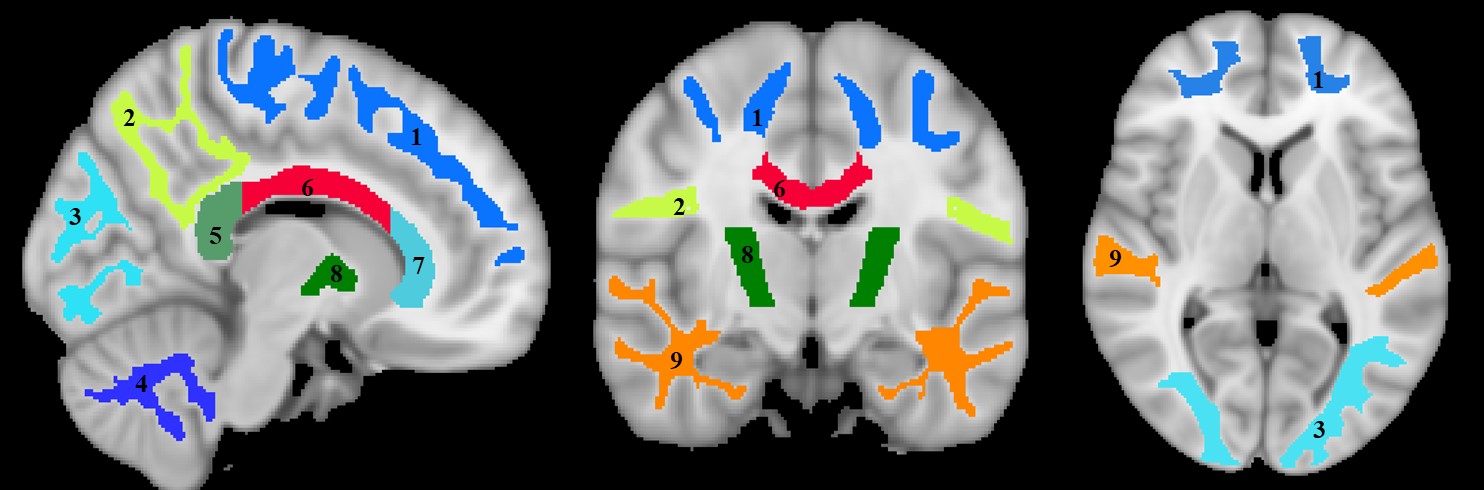
Whole-brain myelin water fraction maps were generated using BMC-mcDESPOT (7-9), and converted to MVF using the geometrical analysis suggested by Jung (12). AVF was calculated from the intracellular volume fraction derived from NODDI (4, 12) or NODDI-DTI (5). MVF and AVF were then used to calculate corresponding g-ratio maps (1, 12-14). The averaged SPGR image over FAs was nonlinearly registered to the MNI space, with the transformation matrix then applied to the corresponding g-ratio map using FSL (15). Ten regions of interest (ROIs) were derived from the MNI structural atlas encompassing the main white matter (WM) regions (Figure 1) (15). For each ROI, the effects of age and sex on g-ratio were investigated using linear regression with mean g-ratio within the ROI as the dependent variable and sex, age, and age2 as independent variables. Additionally, the correlation between mean g-ratio values derived from the two g-ratio approaches was calculated within each ROI.
RESULTS & DISCUSSION
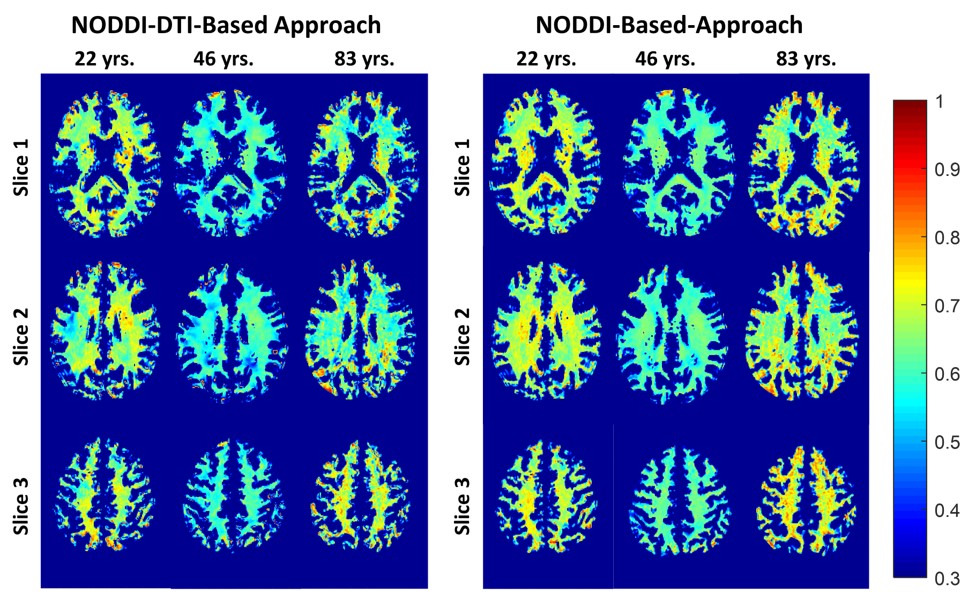
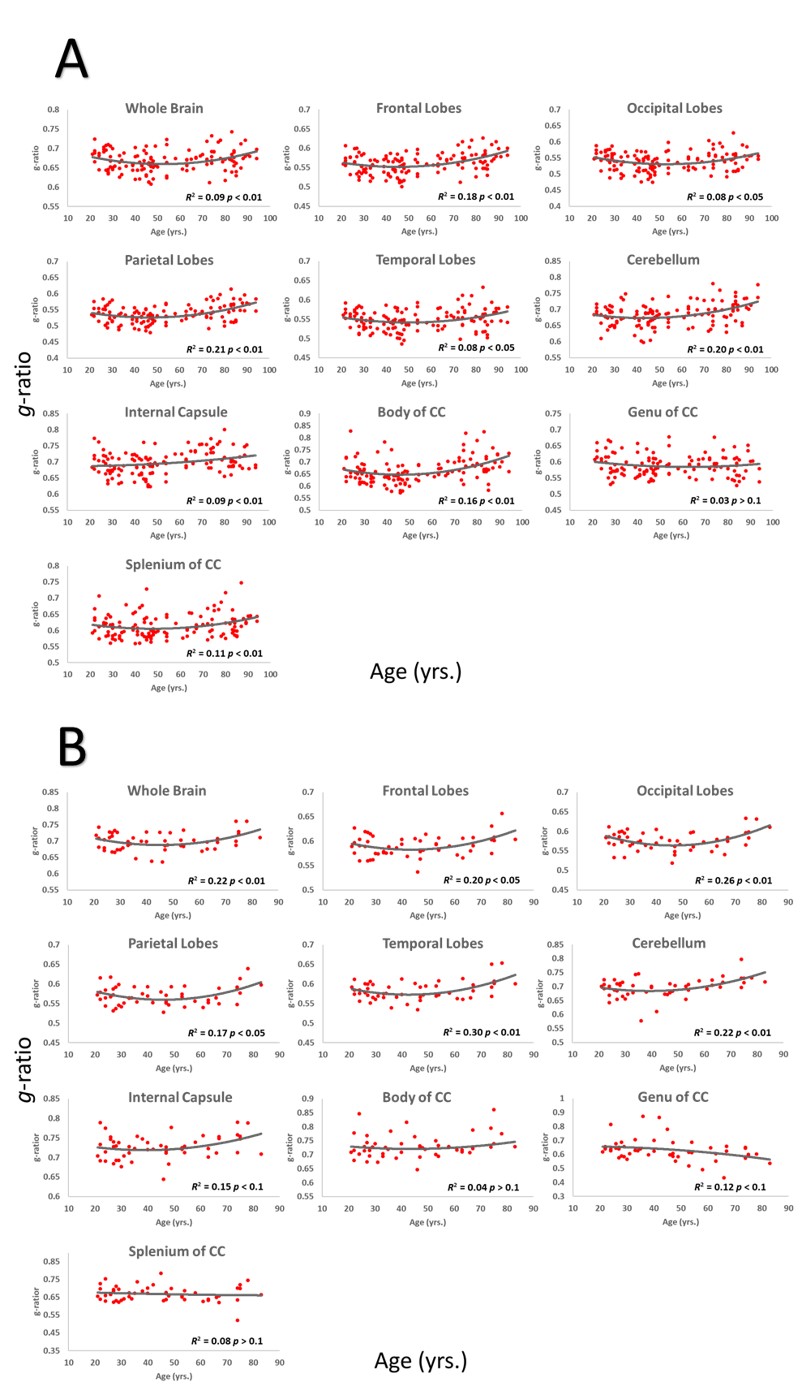
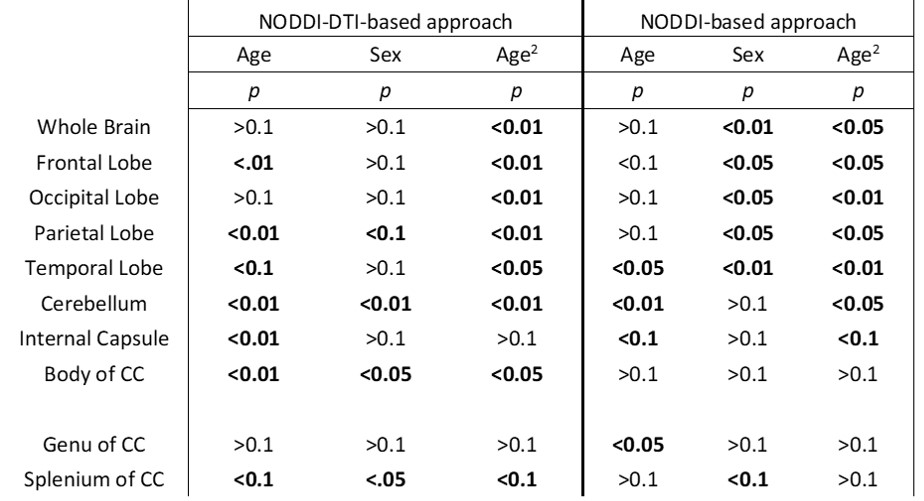
Figure 2 shows g-ratio maps derived from the two g-ratio methods for representative participants of three different ages. The two approaches provide very similar g-ratio maps. Visual inspection and quantitative ROI analyses (Figs. 2-3) indicate decreasing g-ratio from early adulthood through middle age, followed by increase with age in most ROIs (Table 1). While the derived g-ratio values agree with previous literature, the quadratic, U-shaped, trends are not consistent with the previous observation of a linear relationship between g-ratio and age (1). As indicated above, this discrepancy is likely due to methodological differences in MVF determination. The quadratic association observed here suggests progressive myelination through middle age, followed by reduction through late adulthood (2, 3).The effect of sex on g-ratio was significant in several brain regions (Table 1), with females exhibiting overall lower values; this agrees with recent studies indicating greater myelination in females (2, 3). These results disagree with Cercignani (1), who reported no sexual dimorphism (1). However, our findings are consistent with previous demonstrations that proliferation of oligodendrocytes and myelin proteins are modulated by sex steroids and hence regulated differently in males and females (16-19).
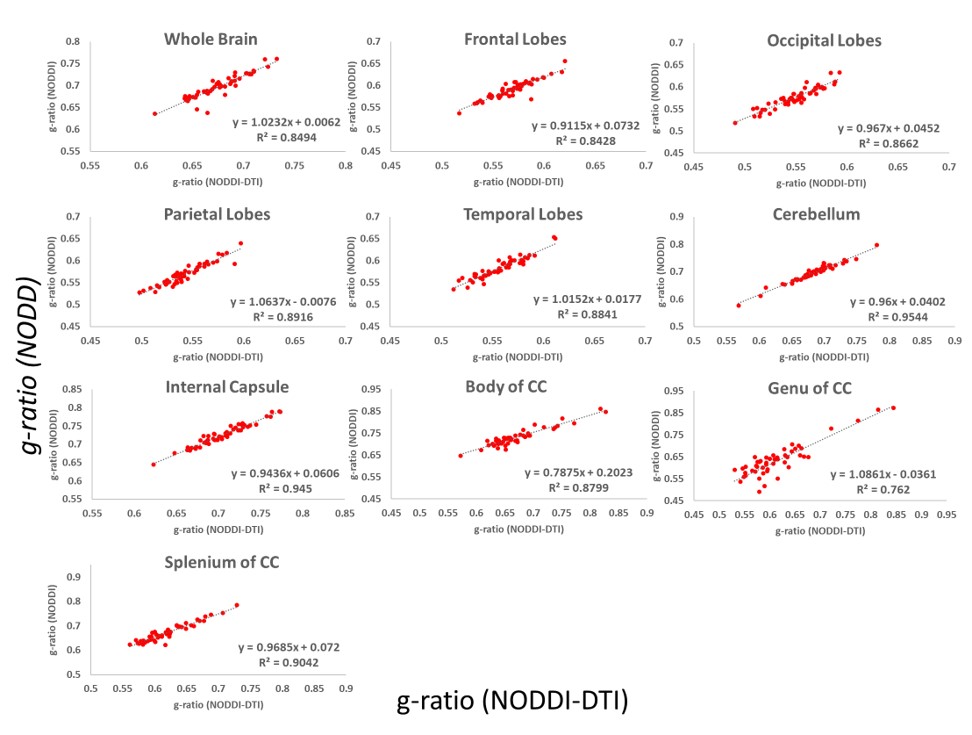
Finally, in agreement with Fig. 1, correlation analysis of g-ratio values derived from the two approaches showed strong correlations in most ROIs (Fig 4). Small discrepancies are likely due to the fact that NODDI is more sensitive to intracellular water diffusion due to the use of high diffusion b-values.
CONCLUSIONS
We propose two new approaches for g-ratio mapping. Both showed a U-shaped association between g-ratio and age across multiple white matter regions.Acknowledgements
This work was supported by the Intramural Research Program of the National Institute on Aging of the National Institutes of Health.References
1. Cercignani M, Giulietti G, Dowell NG, Gabel M, Broad R, Leigh PN, et al. Characterizing axonal myelination within the healthy population: a tract-by-tract mapping of effects of age and gender on the fiber g-ratio. Neurobiology of aging. 2017;49:109-18.
2. Bouhrara M, Rejimon AC, Cortina LE, Khattar N, Bergeron CM, Ferrucci L, et al. Adult brain aging investigated using BMC-mcDESPOT based myelin water fraction imaging. Neurobiology of aging. 2019.
3. Arshad M, Stanley JA, Raz N. Adult age differences in subcortical myelin content are consistent with protracted myelination and unrelated to diffusion tensor imaging indices. NeuroImage. 2016;143:26-39.
4. Zhang H, Schneider T, Wheeler-Kingshott CA, Alexander DC. NODDI: practical in vivo neurite orientation dispersion and density imaging of the human brain. NeuroImage. 2012;61(4):1000-16.
5. Edwards LJ, Pine KJ, Ellerbrock I, Weiskopf N, Mohammadi S. NODDI-DTI: Estimating Neurite Orientation and Dispersion Parameters from a Diffusion Tensor in Healthy White Matter. Front Neurosci. 2017;11:720.
6. Bouhrara M, Reiter DA, Celik H, Fishbein KW, Kijowski R, Spencer RG. Analysis of mcDESPOT- and CPMG-derived parameter estimates for two-component nonexchanging systems. Magnetic resonance in medicine. 2015.
7. Bouhrara M, Spencer RG. Incorporation of nonzero echo times in the SPGR and bSSFP signal models used in mcDESPOT. Magnetic resonance in medicine. 2015;74(5):1227-35.
8. Bouhrara M, Spencer RG. Improved determination of the myelin water fraction in human brain using magnetic resonance imaging through Bayesian analysis of mcDESPOT. NeuroImage. 2016;127:456-71.
9. Bouhrara M, Spencer RG. Rapid simultaneous high-resolution mapping of myelin water fraction and relaxation times in human brain using BMC-mcDESPOT. NeuroImage. 2017;147:800-11.
10. Deoni SC. Correction of main and transmit magnetic field (B0 and B1) inhomogeneity effects in multicomponent-driven equilibrium single-pulse observation of T1 and T2. Magnetic resonance in medicine. 2011;65(4):1021-35.
11. Stollberger R, Wach P. Imaging of the active B1 field in vivo. Magnetic resonance in medicine. 1996;35(2):246-51.
12. Jung W, Lee J, Shin HG, Nam Y, Zhang H, Oh SH, et al. Whole brain g-ratio mapping using myelin water imaging (MWI) and neurite orientation dispersion and density imaging (NODDI). NeuroImage. 2018;182:379-88.
13. Campbell JSW, Leppert IR, Narayanan S, Boudreau M, Duval T, Cohen-Adad J, et al. Promise and pitfalls of g-ratio estimation with MRI. NeuroImage. 2017.
14. Stikov N, Campbell JSW, Stroh T, Lavelée M, Frey S, Novek J, et al. In vivo histology of the myelin g-ratio with magnetic resonance imaging. NeuroImage. 2015;118:397-405.
15. Jenkinson M, Beckmann CF, Behrens TE, Woolrich MW, Smith SM. FSL. NeuroImage. 2012;62(2):782-90.
16. Cerghet M, Skoff RP, Bessert D, Zhang Z, Mullins C, Ghandour MS. Proliferation and death of oligodendrocytes and myelin proteins are differentially regulated in male and female rodents. The Journal of neuroscience : the official journal of the Society for Neuroscience. 2006;26(5):1439-47.
17. Yang S, Li C, Zhang W, Wang W, Tang Y. Sex differences in the white matter and myelinated nerve fibers of Long-Evans rats. Brain Res. 2008;1216:16-23.
18. Greer JM, Csurhes PA, Pender MP, McCombe PA. Effect of gender on T-cell proliferative responses to myelin proteolipid protein antigens in patients with multiple sclerosis and controls. J Autoimmun. 2004;22(4):345-52.
19. Marin-Husstege M, Muggironi M, Raban D, Skoff RP, Casaccia-Bonnefil P. Oligodendrocyte Progenitor Proliferation and Maturation Is Differentially Regulated by Male and Female Sex Steroid Hormones. Developmental Neuroscience. 2004;26(2-4):245-54.
Figures