1430
Association of age, sex, and myelin content with regional iron deposition in the human brain1NIA, NIH, Baltimore, MD, United States
Synopsis
Iron is
known to play a central role in neuronal viability and pathophysiology. Although
susceptibility weighted imaging (SWI) is highly sensitive to iron, few studies
have investigated the effect of age and sex on iron deposition using SWI. Further,
the potential association between iron deposition and myelination is unclear. It
has been suggested that myelin breakdown releases iron, which further acts to
potentiate myelin loss through oxidative mechanisms. Here, we investigate the
association between local iron deposition and age, sex, and myelination,
measured using an advanced myelin content imaging method, on a cohort of
cognitively unimpaired participants.
PURPOSE
Myelin loss releases substantial stores of iron that, with lack of appropriate clearance, may accumulate in the brain (1, 2). However, the association between myelin breakdown and iron accumulation remains to be established. Susceptibility weighted imaging (SWI) is highly sensitive to iron deposition (3, 4). SWI exploits magnetic field inhomogeneities caused by iron deposition, with greater negative mean phase exhibited in regions with greater iron concentration (4-6). In this study we sought to investigate the regional associations between iron deposition and age, sex, and local myelination in the brain (7-11), in a large sample of healthy adults over a wide age range, and to develop further insights into the mechanisms related to iron deposition in the human brain.METHODS
Subjects and MRIThe study cohort consisted of 97 subjects (50.8±22.9 years) with 42 women (47.8±20.1 years) and 55 men (53.4±24.3 years) spanning the age range between 22 and 94 years. Age was not statistically different between men and women. The imaging protocol was:
- BMC-mcDESPOT for MWF mapping: ten 3D spoiled-gradient-recalled-echo (SPGR) images acquired with flip angles (FAs) [2 4 6 8 10 12 14 16 18 20]°, echo time (TE) 1.37ms and repetition time (TR) 5ms, and ten 3D balanced steady-state free-precession images acquired with FAs [2 7 11 16 24 32 40 60]°, TE 2.8ms, TR 5.8ms, and radiofrequency excitation pulse phase increments of 0o or 180o to account for off-resonance effects (12). Images were acquired with voxel size 1.6mm×1.6mm×1.6mm. DAM was used to correct for B1 inhomogeneity (13), with fast spin-echo images acquired with FAs 45° and 90°; TE 102ms; TR 3s; acquisition voxel size 2.6mm×2.6mm×4mm; Field-of-view (FoV) 240mm×208mm×150mm; reconstructed voxel size 1mm×1mm×1mm.
- SWI for iron content mapping: 3D gradient-echo image acquired with FoV 240mmx240mmx185mm; voxel size 0.64mmx0.64mmx0.64mm; EPI-factor 15, TR 47ms; TE 27ms.
Image processing and statistical analysis
SWI phase maps were generated using the phase and magnitude SW images (3, 5, 6). The magnitude image was nonlinearly registered to the MNI space and the computed transformation matrix was applied to the corresponding SWI (14). MWF maps were generated using BMC-mcDESPOT analysis (9-11). The averaged SPGR image over FAs was nonlinearly registered to the MNI space and the computed transformation matrix was applied to the corresponding MWF map (14). Ten white matter (WM) and deep gray matter (DGM) regions of interest (ROIs) were defined from the MNI atlas: WM regions encompassing the frontal (FL), parietal (PL), temporal (TL), and occipital lobes (OL), and DGM regions encompassing the caudate (Cau), thalamus (Tha), putamen (Put), red nucleus (RN), substantia nigra (SN), and globus pallidus (GP). Mean SWI phase and MWF values were calculated for each ROI. The effects of age, sex, and MWF on the mean SWI phase were established using linear regression with mean SWI phase value within the ROI as the dependent variable and the mean MWF within the ROI, sex, and age as independent variables.
RESULTS & DISCUSSION
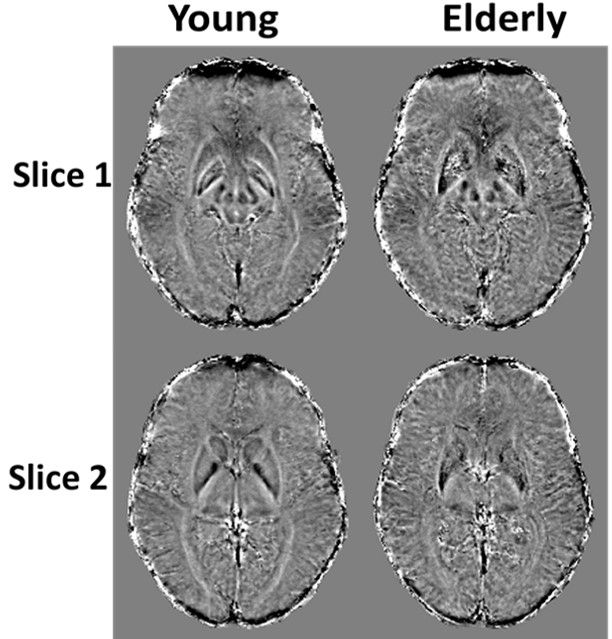
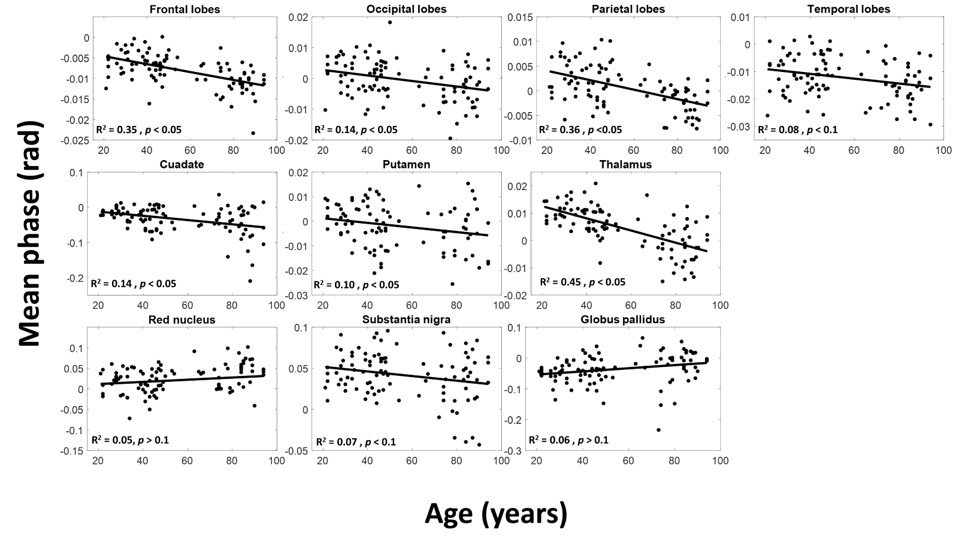
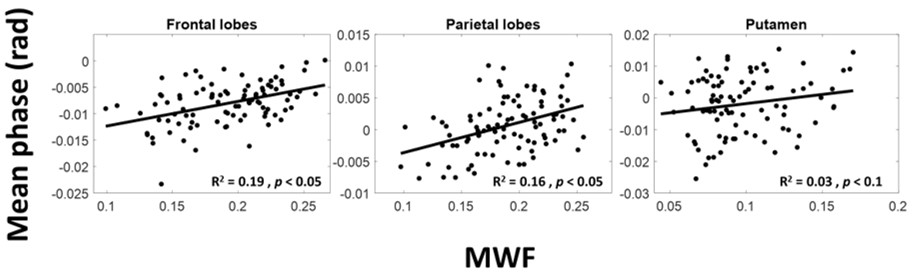
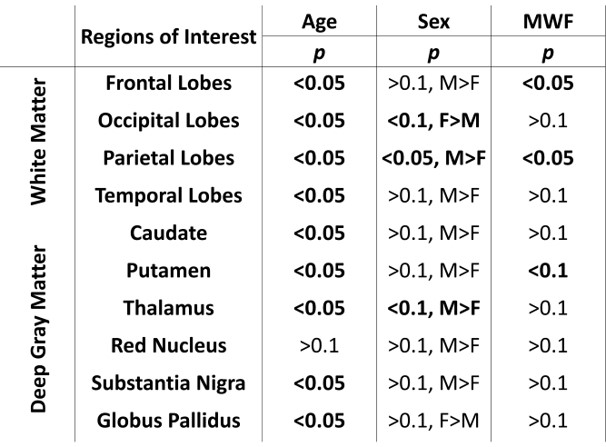
Figure 1 shows average SWI phase maps of the youngest (ages 22-30, n = 12) and oldest (ages 80-94, n = 11) groups of subjects. Results are shown for two slices covering the brain structures investigated. Increased SWI phase shift as characterized by lower (darker) signal indicates increased iron deposition, as is seen in several brain regions in the older subjects. Indeed, the linear regression analysis shows, aside from RN and GP, significantly decreased mean phase, that is, increased iron content, with age in all ROIs (Fig. 2 and Table 1). These regions include the WM lobes which, to the best of our knowledge, have not been investigated previously using SWI. These results agree with previous SWI-based studies (4-6).The relationship between MWF and iron content was significant (p < 0.05) or close to significance (p < 0.1) in three brain regions (Table 1), where decreased myelin content corresponds to increased iron content (Fig. 3), consistent with release of iron from breakdown of myelin. Interestingly, this effect is most prominent in the frontal and parietal lobes, where the achievement of full myelination is delayed as compared to other regions, and which are also the most vulnerable to age- and disease-related degeneration. However, we note that diffusion of iron into the extracellular space may shorten the corresponding transverse relaxation time leading to an artificial overestimation of MWF values (15).
The effect of sex was significant (p < 0.05) or close to significance (p < 0.1) in three brain regions, where males exhibited greater iron content than females (Table 1). While this agrees with previous investigations (4-6), the literature regarding sexual dimorphism in iron content remains sparse, and further investigations on larger cohorts are required. Of note, recent studies indicate lower myelin content in males as compared to females (16, 17). We again attribute this finding of lower myelin content with greater iron content in males to myelin breakdown and subsequent release of iron.
CONCLUSIONS
Using SWI and an advanced method of myelin content imaging, we show that iron content increases with age, consistent with previous results. Most importantly, we find that there is an inverse relationship between iron deposition and myelination in critical WM and GM brain regions.Acknowledgements
This work was supported by the Intramural Research Program of the National Institute on Aging of the National Institutes of Health.References
1. Möller HE, Bossoni L, Connor JR, Crichton RR, Does MD, Ward RJ, et al. Iron, Myelin, and the Brain: Neuroimaging Meets Neurobiology. Trends in Neurosciences. 2019.
2. Hallgren B, Sourander P. The effect of age on the non-haemin iron in the human brain. Journal of neurochemistry. 1958;3(1):41-51.
3. Haacke EM, Mittal S, Wu Z, Neelavalli J, Cheng Y-CN. Susceptibility-Weighted Imaging: Technical Aspects and Clinical Applications, Part 1. American Journal of Neuroradiology. 2009;30(1):19-30.
4. Xu X, Wang Q, Zhang M. Age, gender, and hemispheric differences in iron deposition in the human brain: an in vivo MRI study. NeuroImage. 2008;40(1):35-42.
5. Wang D, Li W-B, Wei X-E, Li Y-H, Dai Y-M. An Investigation of Age-Related Iron Deposition Using Susceptibility Weighted Imaging. PloS one. 2012;7(11):e50706.
6. Pfefferbaum A, Adalsteinsson E, Rohlfing T, Sullivan EV. MRI estimates of brain iron concentration in normal aging: comparison of field-dependent (FDRI) and phase (SWI) methods. NeuroImage. 2009;47(2):493-500.
7. Bouhrara M, Reiter D, Bergeron C, Zukley L, Ferrucci L, Resnick S, et al. Evidence of demyelination in mild cognitive impairment and dementia using a direct and specific magnetic resonance imaging measure of myelin content. Alzheimer's & Dementia. 2018;14(8):998-1004.
8. Bouhrara M, Reiter DA, Celik H, Fishbein KW, Kijowski R, Spencer RG. Analysis of mcDESPOT- and CPMG-derived parameter estimates for two-component nonexchanging systems. Magnetic resonance in medicine. 2015.
9. Bouhrara M, Spencer RG. Incorporation of nonzero echo times in the SPGR and bSSFP signal models used in mcDESPOT. Magnetic resonance in medicine. 2015;74(5):1227-35.
10. Bouhrara M, Spencer RG. Improved determination of the myelin water fraction in human brain using magnetic resonance imaging through Bayesian analysis of mcDESPOT. NeuroImage. 2016;127:456-71.
11. Bouhrara M, Spencer RG. Rapid simultaneous high-resolution mapping of myelin water fraction and relaxation times in human brain using BMC-mcDESPOT. NeuroImage. 2017;147:800-11.
12. Deoni SC. Correction of main and transmit magnetic field (B0 and B1) inhomogeneity effects in multicomponent-driven equilibrium single-pulse observation of T1 and T2. Magnetic resonance in medicine. 2011;65(4):1021-35.
13. Stollberger R, Wach P. Imaging of the active B1 field in vivo. Magnetic resonance in medicine. 1996;35(2):246-51.
14. Jenkinson M, Beckmann CF, Behrens TE, Woolrich MW, Smith SM. FSL. NeuroImage. 2012;62(2):782-90.
15. Birkl C, Birkl-Toeglhofer AM, Endmayr V, Hoftberger R, Kasprian G, Krebs C, et al. The influence of brain iron on myelin water imaging. NeuroImage. 2019;199:545-52.
16. Bouhrara M, Rejimon AC, Cortina LE, Khattar N, Bergeron CM, Ferrucci L, et al. Adult brain aging investigated using BMC-mcDESPOT based myelin water fraction imaging. Neurobiology of aging. 2019.
17. Arshad M, Stanley JA, Raz N. Adult age differences in subcortical myelin content are consistent with protracted myelination and unrelated to diffusion tensor imaging indices. NeuroImage. 2016;143:26-39.
Figures