1426
Feasibility of myelin water fraction mapping with denoised 2D multi-echo GRE images based on deep learned reconstruction1Department of Radiology, Haeundae Paik Hospital, Busan, Republic of Korea, 2MR Collaboration and Development, GE Healthcare, Calagary, AB, Canada, 3Department of Electrical and Electronic Engineering, Yonsei University, Seoul, Republic of Korea, 4MR Collaboration and Development, GE Healthcare, Seoul, Republic of Korea
Synopsis
With advances in deep learning, feasibility has been investigated for myelin water fraction (MWF) reconstruction showing promising results, enabling fast reconstruction, however whether images denoised with deep learned reconstruction(DL) will improve MWF map quality has not been investigated. After denoising of multi-echo GRE magnitude images with a DL algorithm, data was fitted to a three-component magnitude model. Use of DL, shows better results as compared to conventionally generated maps (i.e. decreased NRMSE and mean fitting errors (WM), increased PSNR and SSIM). Gibb's ringing artifact was removed remarkably.
Introduction
Gradient echo myelin water imaging (GRE-MWI) is an MRI technique used to assess the amount of myelin (fraction of myelin bound water, to be precise), in the brain.With advances in deep learning, feasibility has been investigated for MWF reconstruction showing promising results, enabling fast reconstruction1,2, however, whether images denoised with deep learned reconstruction (DL) will improve MWF map quality has not been investigated.
For multi-exponential relaxometry, including myelin water imaging, relatively high SNR is required for reasonable results3,4, which require long scan times, the sacrifice of spatial resolution or both.
Although, 3D acquisitions are usually used for the acquisition of GRE-MWI, a 2D multi-slice acquisition-based approach was recently proposed, which is shown to provide high-quality myelin water fraction (MWF) maps, which are also insensitive to flip angle and B1 field inhomogeneity5. However, 2D acquisition may suffer from lower signal-to-noise ratio (SNR) compared to 3D acquisitions.
In this preliminary work, we sought to evaluate whether the quality of 2D GRE-based myelin water imaging can be improved using magnitude images denoised with DL as input.
Methods
[Data Acquisition]Images were acquired in a volunteer, on a 3T MRI scanner (Signa Architect, GE Healthcare, Waukesha, WI, USA), with a 48-channel head coil.
mGRE (multi-echo spoiled gradient echo) images were acquired with the following parameters: number of slices = 14 (3 mm thickness, 1.5 mm interslice gap); matrix size = 128 x 128; field of view = 210 × 210 mm; repetition time = 85.4 ms; number of echoes 16; first TE = 1.7 ms; echo spacing 2.1 ms; bandwidth = 1562.5 Hz/Px; flip angle = 15° and total scan time = 2:43. A saturation module was placed inferior to the imaging plane. A monopolar readout scheme was used.
[Image Reconstruction]
DLRecon is a new deep learning-based MR reconstruction, which comprises a deep convolutional residual encoder network trained using a database of over 10,000 images to achieve images with high SNR and high spatial resolution
The acquired data were retrospectively reconstructed with and without DLRecon at denoising levels of 50% (DL50), 70% (DL70), 90% (DL90), and 100% (DL100) respectively.
[Three-component magnitude model for MWI]
The three-component magnitude model fits the acquired T2* decay curve to the following:
$$s(t)=(A_{my} e^{-(1/T_{2,my}^*)t}+A_{ax} e^{-(1/T_{2,ax}^* )t}+A_{ex} e^{-(1/T_{2,ex}^*)t})$$ where $$$A_{my}$$$ and $$$A_{ax}$$$ are the amplitude of the three water components, $$$T_{2,my}^*$$$, $$$T_{2,ax}^*$$$, and $$$T_{2,ex}^*$$$ are $$$T_2^*$$$ values of the three water components6,7. The fitting parameters are estimated by solving an iterative nonlinear curve-fitting algorithm. The initial values and bounds of the fitting parameters were set the same as in a previous work by Lee et al.8.
[Quantitative analysis]
For the quantitative evaluation of DL performance, normalized root mean squared error (NRMSE), peak signal-to-noise ratio (PSNR), and structural similarity index (SSIM) were estimated based on the DL 100 magnitude image. Also, least-squares error between acquired signal and the fitted signal was estimated, especially the white matter regions (WM).
Results
Use of DL, shows better results as compared to conventionally generated maps (i.e. decreased NRMSE and mean fitting errors (WM), increased PSNR and SSIM, with increasing denoising levels). One reason for the improvement of MWF results through DL application is due to the reduction of the fitting error by the SNR improvement. Measured mean least square fitting error values in the WM region of Figure 2 are 51.85 (Original), 46.52 (DL 50), 43.03 (DL 70), 40.09 (DL 90), and 38.78 (DL100), respectively (Figure 3.). Remarkably, Gibb’s ringing artifacts are virtually eliminated in images reconstructed with deep learned algorithms, and resulting MWF maps, regardless of the denoising level, in contrast to prominent artifacts visible with the original reconstruction (Figure 2, 4.).Discussion and Conclusion
The preliminary results presented in this work based on three-component magnitude model fitting of images reconstructed with a prototype software shows the potential of DL for improving the quality of MWF maps. Further improvement is expected if combined with other methods such as the use of navigator echoes9, complex fitting10, or compensation of eddy current effects5.DL is known to perform well for removal of statistical and reconstruction related noise, and artifacts such as Gibb’s ringing. However, motion artifacts or physiologic noise cannot be removed and sometimes even be amplified. In combination with recently proposed PCA based methods, either in the complex or magnitude domain, these limitations may be resolved11,12.
Acknowledgements
No acknowledgement found.References
- Lee, J. et al. Artificial neural network for myelin water imaging. Magn. Reson. Med. mrm.28038 (2019) doi:10.1002/mrm.28038.
- Jung, S. et al. Feasibility study on artificial neural network based myelin water fraction mapping. in Proc. Intl. Soc. Mag. Reson. Med 4899 (2019).
- Fenrich, F. R. E., Beaulieu, C. & Allen, P. S. Relaxation times and microstructures. NMR Biomed. 14, 133–139 (2001).
- Graham, S. J., Stanchev, P. L. & Bronskill, M. J. Criteria for analysis of multicomponent tissue T2 relaxation data. Magn. Reson. Med. 35, 370–378 (1996).
- Shin, H. G. et al. Advances in gradient echo myelin water imaging at 3T and 7T. Neuroimage 188, 835–844 (2019).
- Du, Y. P. et al. Fast multislice mapping of the myelin water fraction using multicompartment analysis ofT2* decay at 3T: A preliminary postmortem study. Magn. Reson. Med. 58, 865–870 (2007).
- Hwang, D., Kim, D. H. & Du, Y. P. In vivo multi-slice mapping of myelin water content using T2* decay. Neuroimage 52, 198–204 (2010).
- Lee, H., Nam, Y. & Kim, D. Echo time‐range effects on gradient‐echo based myelin water fraction mapping at 3T. Magn. Reson. Med. 81, 2799–2807 (2019).
- Nam, Y., Kim, D. H. & Lee, J. Physiological noise compensation in gradient-echo myelin water imaging. Neuroimage 120, 345–349 (2015).
- Nam, Y., Lee, J., Hwang, D. & Kim, D. H. Improved estimation of myelin water fraction using complex model fitting. Neuroimage 116, 214–221 (2015).
- Does, M. D. et al. Evaluation of principal component analysis image denoising on multi-exponential MRI relaxometry. Magn Reson Med 81 (2019) doi:10.1002/mrm.27658.
- Song, J. E. et al. Noise sensitivity study of model-free rPCA in Myelin Water Fraction Mapping using multi-echo GRE. in Proc. Intl. Soc. Mag. Reson. Med. 0422 (2019).
Figures
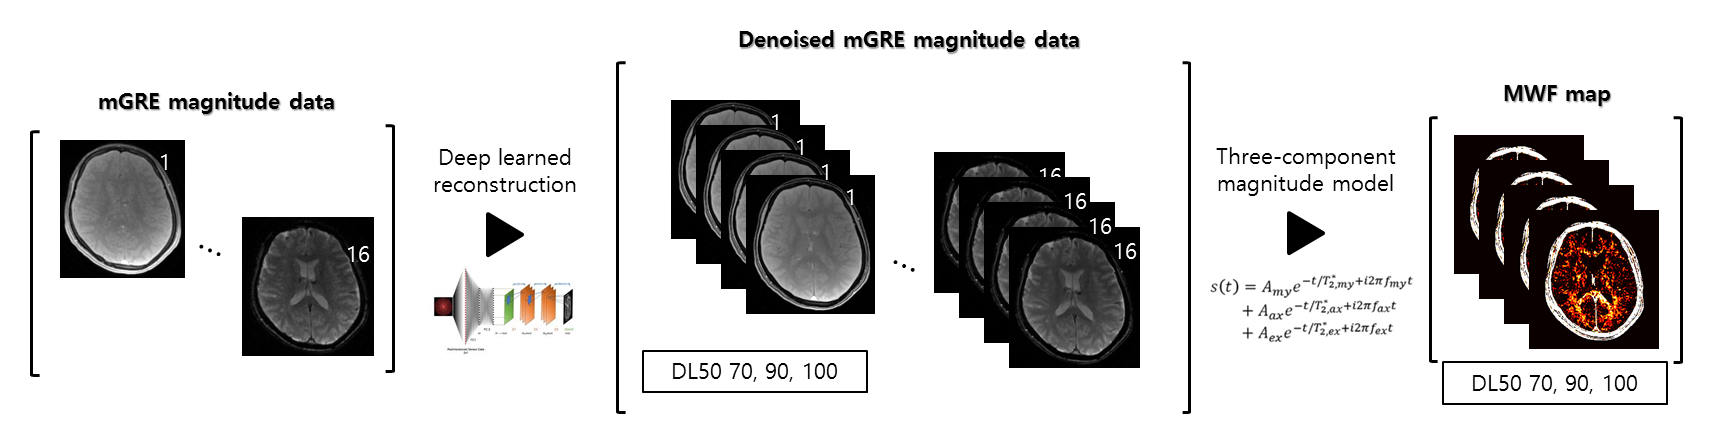
Figure 1. Summary of the MWF mapping procedure from 2D mGRE data denoised with DL
Magnitude data was acquired with a mGRE sequence. The data was retrospectively reconstructed with DL with noise levels of 50, 70, 90, and 100% respectively. Each set of reconstructed images were fitted to a three-component magnitude model to produce MWF maps.
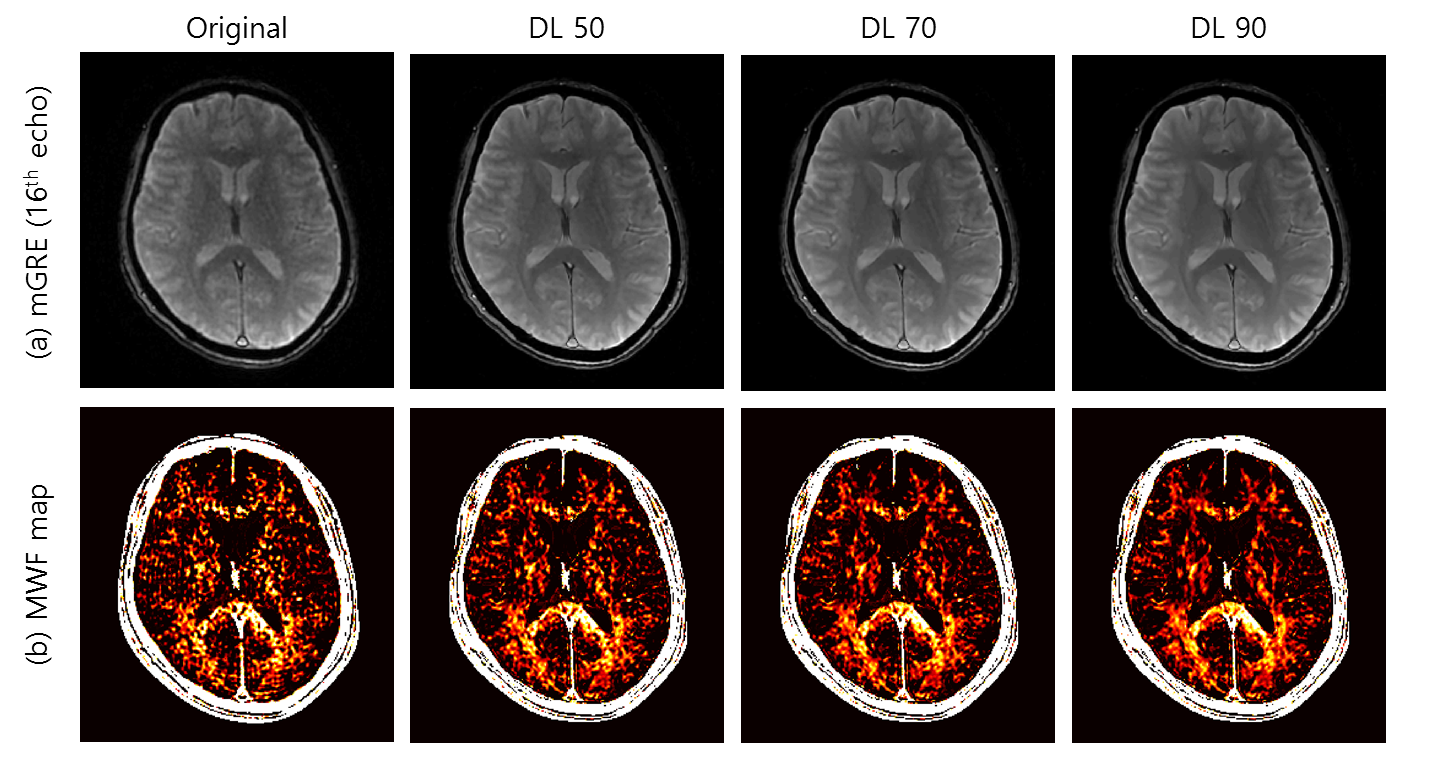
Figure 2. Comparison of MWF maps generated using original reconstruction and DL with different denoising levels.
(a) Magnitude images of the 16th echo of the mGRE acquisitions and (b) MWF maps after application of original, DL50, DL70 and DL90.
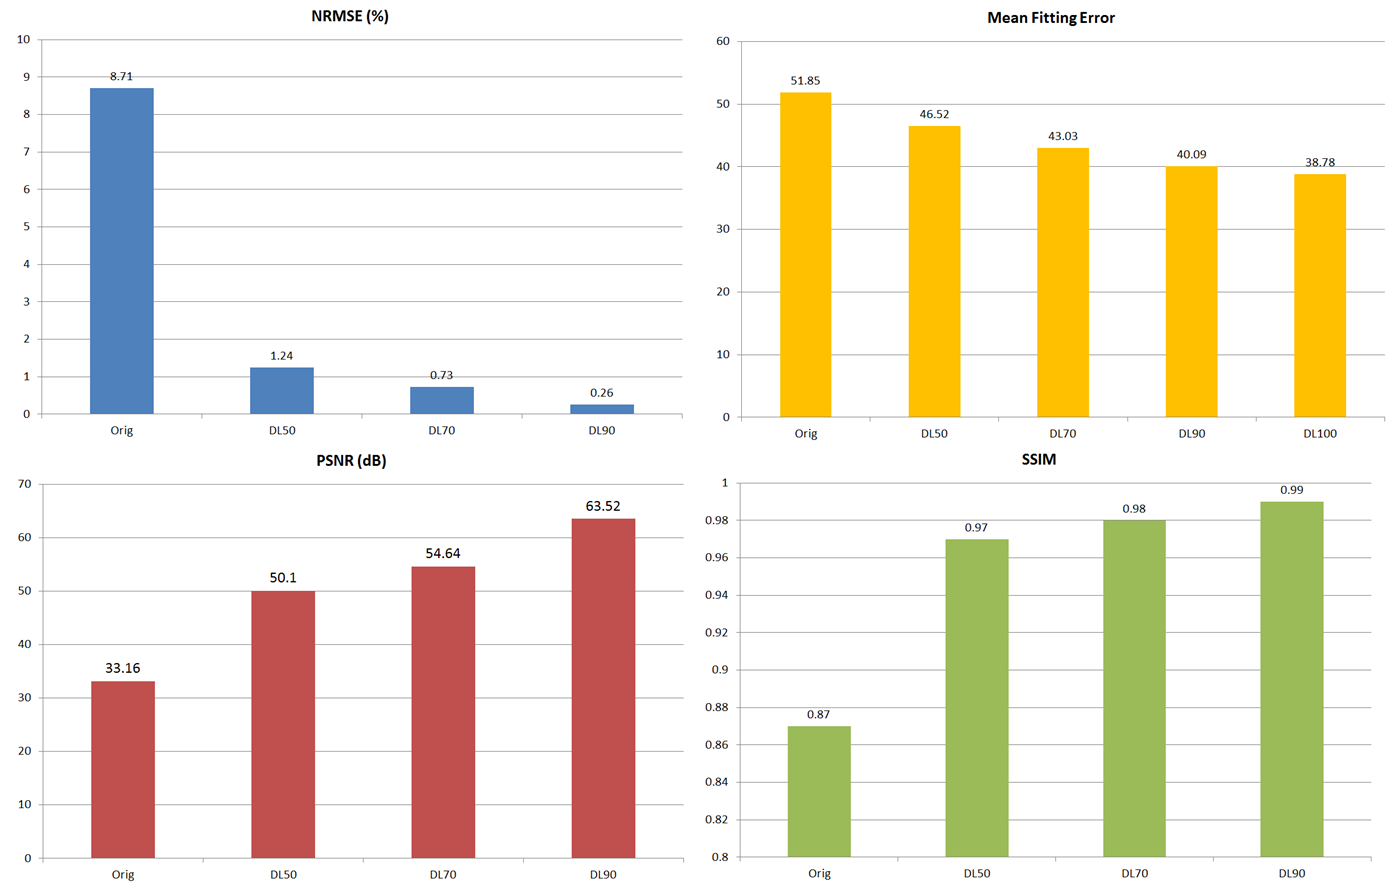
Figure 3. Quantitative analysis of DL performance for MWF mapping.
NRMSE, mean fitting error (least-squares error) in the white matter, PSNR, and SSIM, suggest that DL shows better performance over the original method.
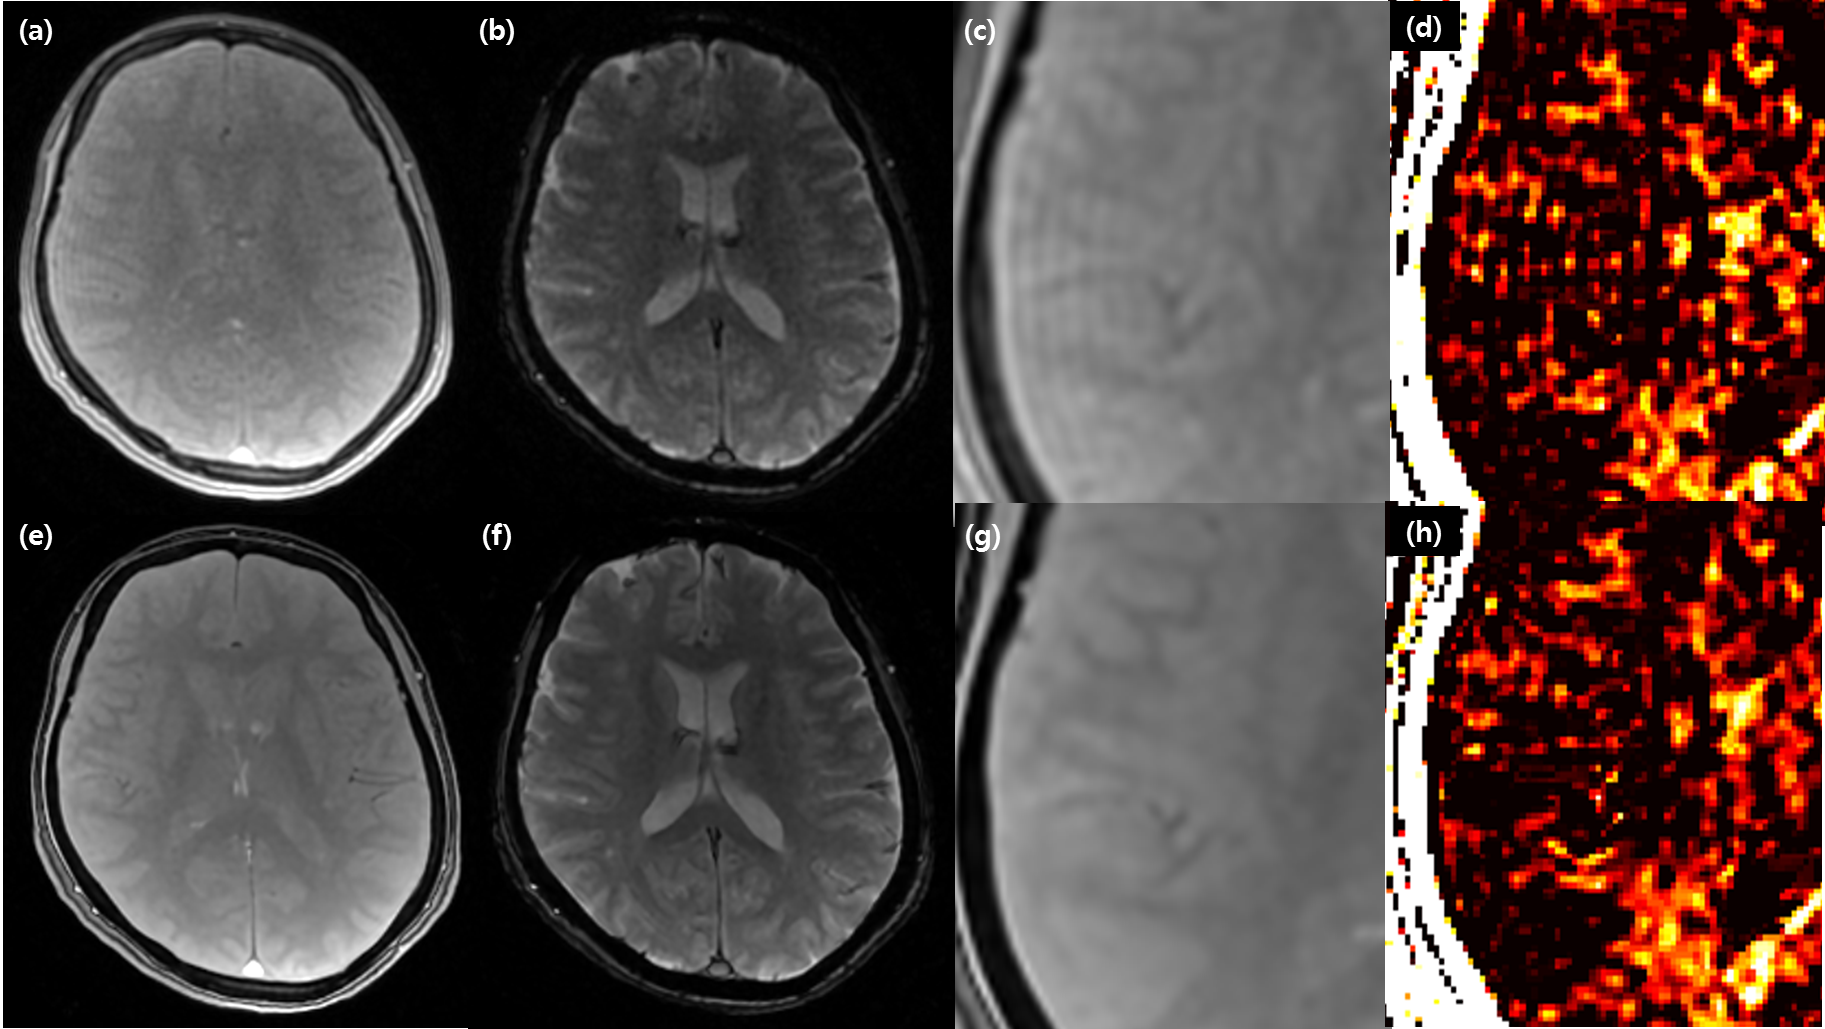
Figure 4. Decreased noise and Gibb’s ringing artifact with DL.
1st echo (a, e), and 16th echo (b, f) of the mGRE acquisition without and with DL respectively. Decreased noise and Gibb’s ringing artifact is demonstrated, which is more clearly seen in the magnified views of right operculum in the 1st echo images (c, f), and MWF maps (d, h), without and with DL respectively.