1422
Monitoring the treatment effect of Tecfidera on MS lesion susceptibility with quantitative susceptibility mapping
Xianfu Luo1,2, Elizabeth Sweeney3, Ulrike W. Kaunzner4, Weiyuan Huang1, David Pitt5, Yi Wang1, Susan Gauthier4, and Thanh D. Nguyen1
1Department of Radiology, Weill Medical College of Cornell University, New York, NY, United States, 2Department of Radiology, Northern Jiangsu People's Hospital, Yangzhou, China, 3Department of Healthcare Policy and Research, Weill Medical College of Cornell University, New York, NY, United States, 4Department of Neurology, Weill Medical College of Cornell University, New York, NY, United States, 5Yale University, New Haven, CT, United States
1Department of Radiology, Weill Medical College of Cornell University, New York, NY, United States, 2Department of Radiology, Northern Jiangsu People's Hospital, Yangzhou, China, 3Department of Healthcare Policy and Research, Weill Medical College of Cornell University, New York, NY, United States, 4Department of Neurology, Weill Medical College of Cornell University, New York, NY, United States, 5Yale University, New Haven, CT, United States
Synopsis
Quantitative susceptibility mapping (QSM) has emerged as a sensitive MRI tool for in vivo monitoring inflammation in MS brain. Low-grade inflammation in chronic active lesions have been shown to contain iron-enriched, activated microglia and macrophages on histopathology and have been linked to greater tissue damage. QSM can provide accurate in vivo quantification of iron-laden inflammatory cells. It might be used to assess treatment response.
Introduction
Quantitative susceptibility mapping (QSM) provides in-vivo accurate measures of tissue magnetic sources. Chronic active multiple sclerosis (MS) lesions have been shown to contain iron-enriched, activated microglia and macrophages on histopathology and have been linked to greater tissue damage1. QSM can provide accurate quantification of iron that accumulates in proinflammatory M1 microglial cells at the rim of chronic active lesions2-3. Tecfidera is thought to modulate the immune response to be less inflammatory and has been shown to reduce microglia activation in vitro and in animal models of MS4-5. Therefore the aim of our study was to in-vivo observe Tecfidera’s effect on the iron load in chronic active lesions, as quantified with QSM. Another oral immune-modulatory Gilenya has less effect on microglia and was therefore used as a control.Materials and methods
Patient SelectionThis retrospective study was approved by Weill Cornell Medicine institutional review board, and written informed consent was obtained from each subject. This was a study of a cohort of 16 patients on Tecfidera and 18 patients on Gilenya with relapsing-remitting MS. The data is part of a MR imaging and clinical data base for which annual MR imaging scans (including QSM) were collected during 6 years. Baseline MR scanning was within three months of start the treatment. Clinical data collected for patients included the following: gender, age, Expanded Disability Status Scale scores, and treatment duration.
MR Imaging and Processing
Brain MRIs were performed on 3T MR imaging scanners. The scanning protocol consisted of standard sequences for anatomic structure, multiecho 3D-GRE imaging for QSM. The acquisition parameters for multiecho GRE were the following: FOV 24 cm, TR 49 –58 ms, TE1/TE 4.5– 6.7/4.1– 4.8 ms, last TE 47.7 ms, acquisition matrix320 – 416× 205–320, readout bandwidth244 –260 Hz/pixel, axial slice thickness 3 mm, flip angle 15°-20°,acceleration factor2, number of averages1. QSM was reconstructed from complex GRE images. All the conventional images and the follow-up QSM images were coregistered to the baseline GRE magnitude images.
Lesion Susceptibility and Volume Measurements
Lesions were identified and manually traced on the T2WI image then overlaid and further adjusted if necessary on the QSM image. The ITK-SNAP software was used to trace lesions and obtain regional volume and QSM measurements. Based on their appearance relative to the surrounding normal-appearing white matter (NAWM), lesions were classified into three lesion types: QSM isointense (QSM-), QSM hyperintense with rim (QSM rim+) and without (QSM rim-).The susceptibility value of the adjacent NAWM was subtracted from the lesion susceptibility to offset the influence of local fiber orientation.Then we got the correction of lesion susceptibility value (cQSM) offset the influence of local fiber orientation.
Statistical Analysis
To assess longitudinal lesion cQSM value change, we fit a linear mixed effects model with random intercepts for lesion and subject to account for the correlation in the data. The model has fixed effects for time and drug (Tecfidera versus Gilenya) and the interaction of the two. For this analysis, we are most interested in the interaction term, as this indicated whether the change in cQSM is modified by the drug Tecfidera. In addition, fixed effects were included in the model for lesion volume, patient sex, disease subtype, EDSS, age, and treatment duration.
Results
34 MS patients (24women, 10 men, age 45.28 years ± 9.392) were retrospectively enrolled in this study. Except the treatment duration, Demographic information for the two treatment groups showed no significant difference. The Tecfidera group enrolled 16 subjects with 101 lesions, with 16 Rim + lesions . The Gilenya group enrolled 18 subjects with 151 lesions, with 30 QSM Rim + lesions. Figure 4 shows the longitudinal smoothed trajectories of the cQSM for the QSM-, QSM+ Rim – and QSM + Rim + groups over time. Linear smoothers were fit to the data and 95% confidence intervals are provided. We see a trend in the Tecfidera group of a decrease in cQSM in QSM + Rim + lesions as well as QSM + Rim – lesions. In the model, time was found to be statistically significant, with an average decrease of 1.73 in cQSM for a one-year increase in time (p-value = 0.124) holding all else constant. The interaction between time and Tecfidera was not found to be statistically significant but was suggestive of a trend; in the Tecfidera group the average cQSM decreased by .98 more for a one-year increase in time (p-value = 0.094) holding all else constant. None of the confounders that were adjusted for in the model were found to be statistically significant.Discussion and Conclusion
Our data provides in-vivo evidence that there is a reduction in MS lesion susceptibility in QSM rim+ lesions for both the Gilenya and Tecfidera groups. The results are suggestive that the Tecfidera group had a larger decrease in cQSM than the Gilenya group, but these results were not found to be statistically significant. This may be due to the small sample size and future efforts will concentrate on obtaining a larger sample size for this study. In conclusion, QSM is a suitable tool to in vivo monitor treatment response of low-grade inflammation in chronic active MS lesions.Acknowledgements
No acknowledgement found.References
1. Zhang S, Nguyen TD, Hurtado Rúa SM, et al. Quantitative Susceptibility Mapping of Time-Dependent Susceptibility Changes in Multiple Sclerosis Lesions. AJNR Am J Neuroradiol. 2019 Jun;40(6):987-993.
2. Kaunzner UW, Kang Y, Zhang S,et al.Quantitative susceptibility mapping identifies inflammation in a subset of chronic multiple sclerosis lesions. Brain. 2019 Jan 1;142(1):133-145.
3. Gasperini C, Prosperini L, Tintoré M, et al. Unraveling treatment response in multiple sclerosis: A clinical and MRI challenge.Neurology. 2019 Jan 22;92(4):180-192.
4. McCarthy RC, Sosa JC, Gardeck AM, ea al. Inflammation-induced iron transport and metabolism by brain microglia. J Biol Chem. 2018 May 18;293(20):7853-7863.
5. Kronenberg J, , Pars K, Brieskorn M, et al.Fumaric Acids Directly Influence Gene Expression of Neuroprotective Factors in Rodent Microglia. Int J Mol Sci. 2019 Jan 15;20(2).
Figures

Figure 1. Example of a lesion in the left frontal lobe of a 40-year-old RRMS patient undergoing Tecfidera treatment, which shows lesion susceptibility decreased from 35.6 ppb to 18.4 ppb over a 2-year period.
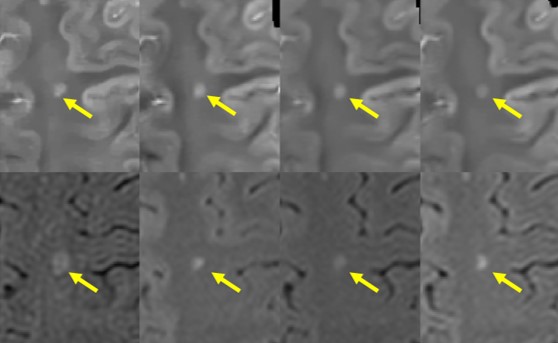
Figure 2. In this example of a 50-year-old RRMS patient undergoing continuous Tecfidera treatment over 4 years, annual QSM scans showed a steady decrease in lesion susceptibility by 63% from 27.8 ppb to 10.4 ppb.
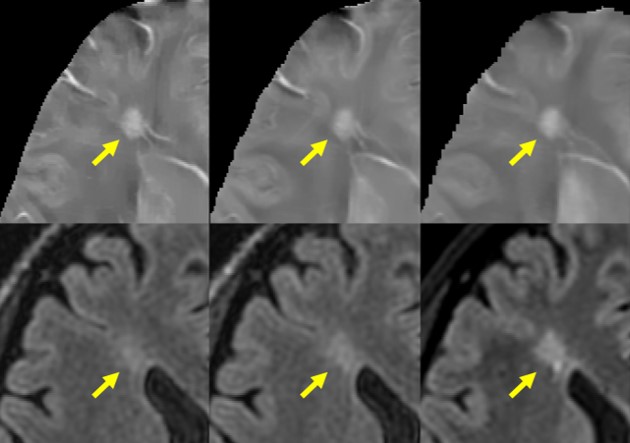
Figure 3. An example of a 39-year-old RRMS patient undergoing Gilenya treatment for 3 years. Lesion susceptibility value decreased slightly from 25.9 ppb to 20.5 ppb in the first year and remained steady in the following two years.
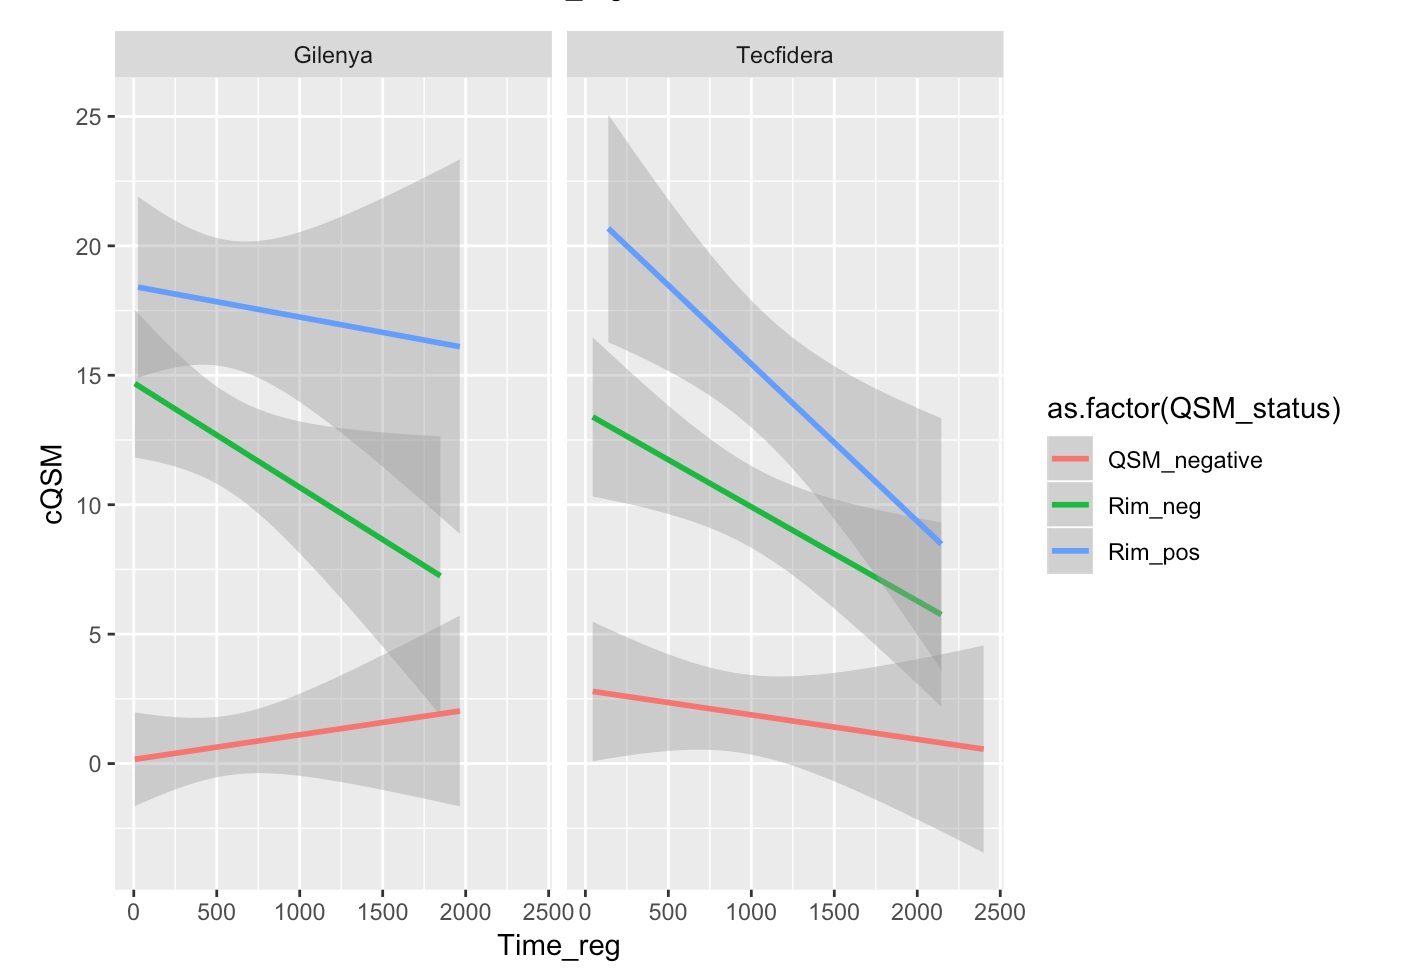
Figure 4.The longitudinal smoothed QSM trajectories for the QSM-, QSM+ Rim- and QSM+ Rim+ groups. Linear smoothers were fit to the data and 95% confidence intervals are provided. We see a decreasing trend in the Tecfidera group for both QSM+ Rim+ lesions as well as QSM+ Rim- lesions. There was no statistically significant difference found between the relationship of QSM and time in both Tecfidera and Gilenya groups.