1420
Myelin water imaging of Multiple Sclerosis Lesions1Institut und Poliklinik für Diagnostische und Interventionelle Neuroradiologie, University Hospital Carl Gustav Carus, Dresden, Germany, 2Neurology, University Hospital Carl Gustav Carus, Dresden, Germany
Synopsis
Myelin water imaging allows the assessment of relative myelination by estimating the myelin water fraction (MWF). This work investigated if the degree of MWF loss in multiple sclerosis is associated with T1 hypointense and isointense lesions. Within n = 1668 FLAIR lesions of n = 63 MS patients, 79% had a hypointense correlate, and 21% of the lesions had an isointense appearance on non-enhanced T1-weighted images. Significant differences were found for hypointense (MWFmean = 0.126) and isointense (MWFmean = 0.185) lesions. These results show varying degrees of myelin reduction.
INTRODUCTION
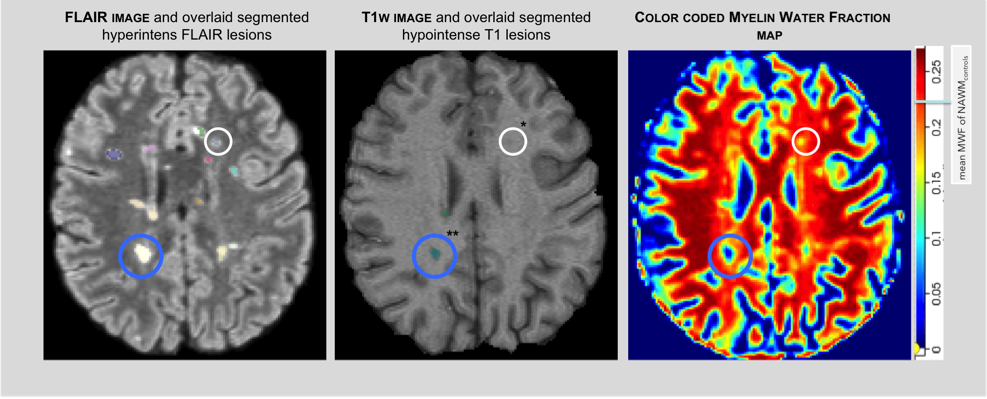
From histopathology it is well known that the altered physical properties of remyelination lead to an abnormal T2 signal, but that the degree of hypointensity on T1-weighted images is less marked in remyelinated lesions than in demyelinated lesions without signs of remyelination [3]. Analogous to the histopathological findings, we have investigated T1 hypointense and isointense lesions of MS patients with the whole brain myelin water imaging technique Multi-Component Driven Equilibrium Single Pulse Observation of T1 and T2 (mcDESPOT) [1], which allows the assessment of relative myelination (Fig. 1)), by estimating the myelin water fraction (MWF) [2], which has the potential to determine myelination stage of lesions in-vivo.The aim of this study was to evaluate if the degree of MWF loss is associated with T1 hypointense and isointense lesions.METHODS
T1-weighted and 3D-fluid attenuated inversion recovery (FLAIR) images were obtained of 63 MS patients and WM lesions were segmented in binary masks (Fig. 1). Common data post processing involving brain extraction and co-registration of scans were used (SPM/FSL). MWF maps were derived using the established mcDESPOT processing method [1]. An algorithm was developed to automate the MWF read out of individual isointense and hypointense lesions to analyse myelination differences. A matched control group was acquired. Differences in MWF of T1 isointense and hypointense lesions were determined with an unpaired two-sided t-test (P<0,05).MR Aquisition for MWF map generation:
A 1.5T MR scanner (Siemens Magnetom Sonata equipped with a 8-channel radio-frequency coil was used and sets of 2D-T1 spin echo (T1w), 3D Fluid-Attenuated Inversion Recovery (FLAIR), Spoiled Gradient Recalled (SPGR) and Balanced Steady- State Free-Precession (bSSFP) images were obtained. According to the mcDESPOT protocol SPGR and bSSFP scans were acquired over a range of flip angles at constant echo time (TE) and repetition time (TR) using the following specifications: field of view (FOV) = 22 cm, slice thickness = 1.7 mm; SPGR: TE/TR = 2.0/ 5.7 ms, flip angle (α) = [5, 6, 7, 8, 9, 11, 13, 18]°; bSSFP: TE/ TR = 1.71/3.42 ms, α = [9, 14, 19, 24, 28, 34, 41, 51, 60]°
RESULTS
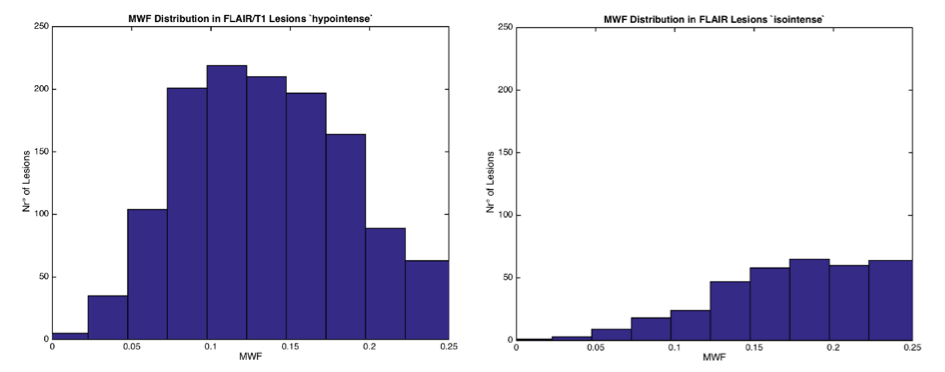
MWF in white matter (WM) of healthy controls was 0,23. A total of 1668 WM FLAIR lesions were examined, whereas 349 of them were isointense (MWFmean=0,185) and 1319 hypointense (MWFmean=0,126) on T1-weighted images (Fig. 1). Significant differences (p<0.05) were found for the groups (Fig. 2).DISCUSSION
Most FLAIR lesions which are strongly hypointense in T1-weighted images are demyelinated [3]. In line with histopathologic findings we found that MS lesions hypointense to WM exhibited lower MWF values than lesions that were isointense. Our findings demonstrate varying degrees of demyelination reflecting conventional MRI appearance in RRMS patients.CONCLUSION
In addition to conventional MRI, myelin water imaging has high potential to visualize the pathologic changes in MS plaques and provide a more quantitative assessment of the extent of the disease.Acknowledgements
No acknowledgement found.References
[1] Deoni SC, Rutt BK, Arun T, Pierpaoli C, et al., Gleaning multicomponent T1 and T2 information from steady-state imaging data. Magn Reson Med. 2008; 6:1372-87
[2] Laule C, Vavasour I. Kolind SH, et al., Magnetic resonance imaging of myelin. Neurotherapeutics. 2007 Jul;4(3):460-84
[3] Barkhof et al. Remyelinated Lesions in Multiple Sclerosis Magnetic Resonance Image Appearance. Arch Neurol. 2003;60(8):1073-1081
Figures