1419
Detection of multiple sclerosis lesion with T1 and T2* MR Fingerprinting1Computer Assisted Clinical Medicine, Medical Faculty Mannheim, University Heidelberg, Mannheim, Germany, 2Magnetic Resonance Systems Lab, Department of Imaging Physics, Delft University of Technology, Delft, Netherlands, 3Center of Neuroimmunology, Laboratory of Advanced Imaging in Neuroimmunological Diseases, Hospital Clinic Barcelona, Institut d'Investigacions Biomèdiques August Pi i Sunyer (IDIBAPS) and Universitat de Barcelona, Barcelona, Spain, 4Department of Neurology, Medical Faculty Mannheim, University Heidelberg, Mannheim, Germany
Synopsis
We evaluated an MRF-EPI sequence for simultaneous T1 and T2* quantification in 44 patients with multiple sclerosis (MS) lesions at two scanners. We found significantly increased T1 and T2* times in MS lesions with differences up to 100 %. MS lesions resulted in broad distribution in the T1, T2* space compared with dense, separated clusters for white and gray matter.
Introduction
Multiple sclerosis (MS) is a common central nervous system disease which is observed as multi-focal inflammatory white matter lesions that tend to increase T1 and T2* [1]. Conventional magnetic resonance imaging (MRI) only provides limited insights into these pathologies. Magnetic resonance fingerprinting (MRF) is a promising approach for quantifying multiple tissue parameters in a single time efficient acquisition [2]. Rieger et al. [3] proposed a MRF sequence based on an echo-planer imaging readout for quantifying T1 and T2* covering the whole brain in less than 5 minutes. This study aimed to sum up the results using the MRF-EPI sequence in two vendors and compare white matter, gray matter and MS lesions with respect to their T1 and T2* times.Methods
A MRF sequence based on an echo-planar imaging (EPI) readout with an in-line group matching reconstruction was implemented at a 3T scanner (Magnetom Skyra, Siemens Healthineers) in the Medical Faculty Mannheim and a 3T scanner (Magnetom Prisma, Siemens Healthineers) in the University Hospital Clinic of Barcelona. The sequence parameters were for both vendors FOV = 240 x 240 mm, matrix size = 240 x 240, slice thickness = 2 mm, bandwidth = 998 Hz/px, GRAPPA factor = 3, partial fourier = 5/8, varying flip angle α (17-43°), TE (16-76.5 ms), TR (3530 - 6370 ms). At the Prisma scanner, additionally simultaneous multi-slice imaging was used with an acceleration factor of 3. Acquisition times for Skyra is 4 minutes 23 seconds and for Prisma 1 minute 52 seconds covering all 60 slices. Dictionaries were generated using MATLAB (The MathWorks; Natick, MA) consisting of around 100,000 entries with T1 (100-3500 ms), T2* (10-3000 ms) and flip angle efficiency B1+ (0.7-1.2). Group matching was performed online on the scanner, which took less than 1 minute for all 60 slices.Images were acquired in 12 subjects with multiple sclerosis from Mannheim and in 32 subjects with multiple sclerosis from Barcelona.
White matter lesions were manually annotated by one reader.
Results
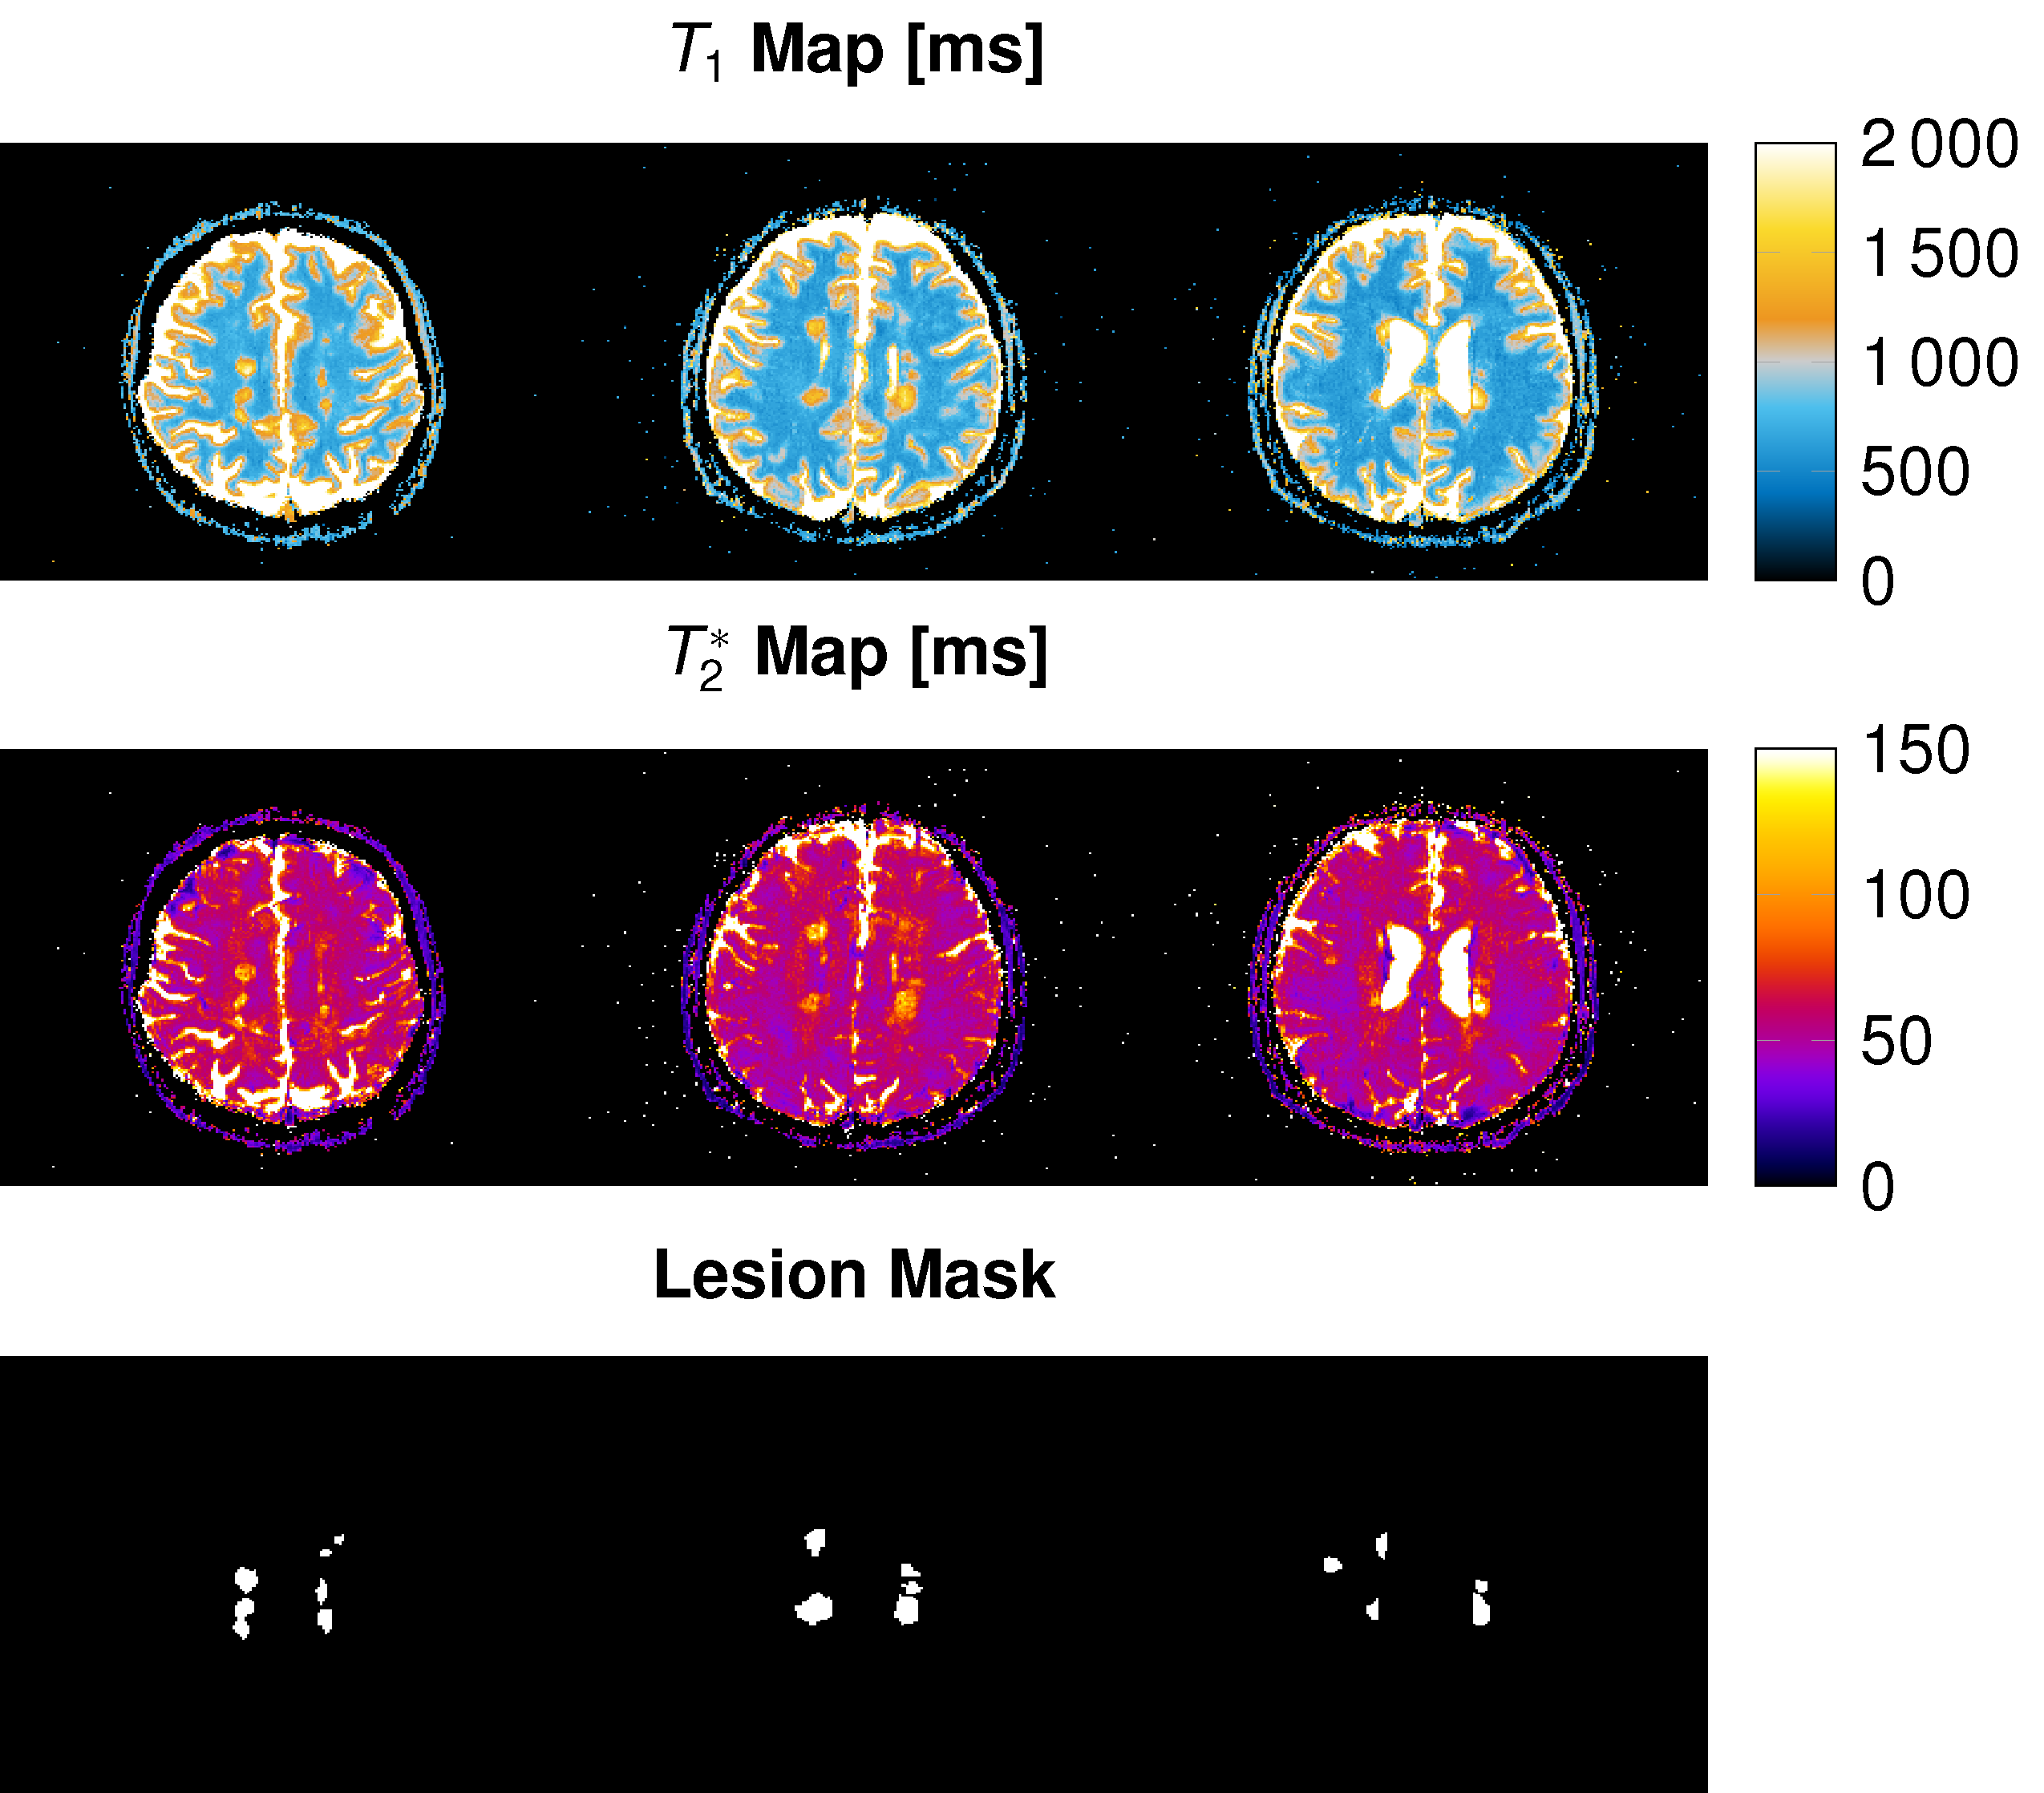
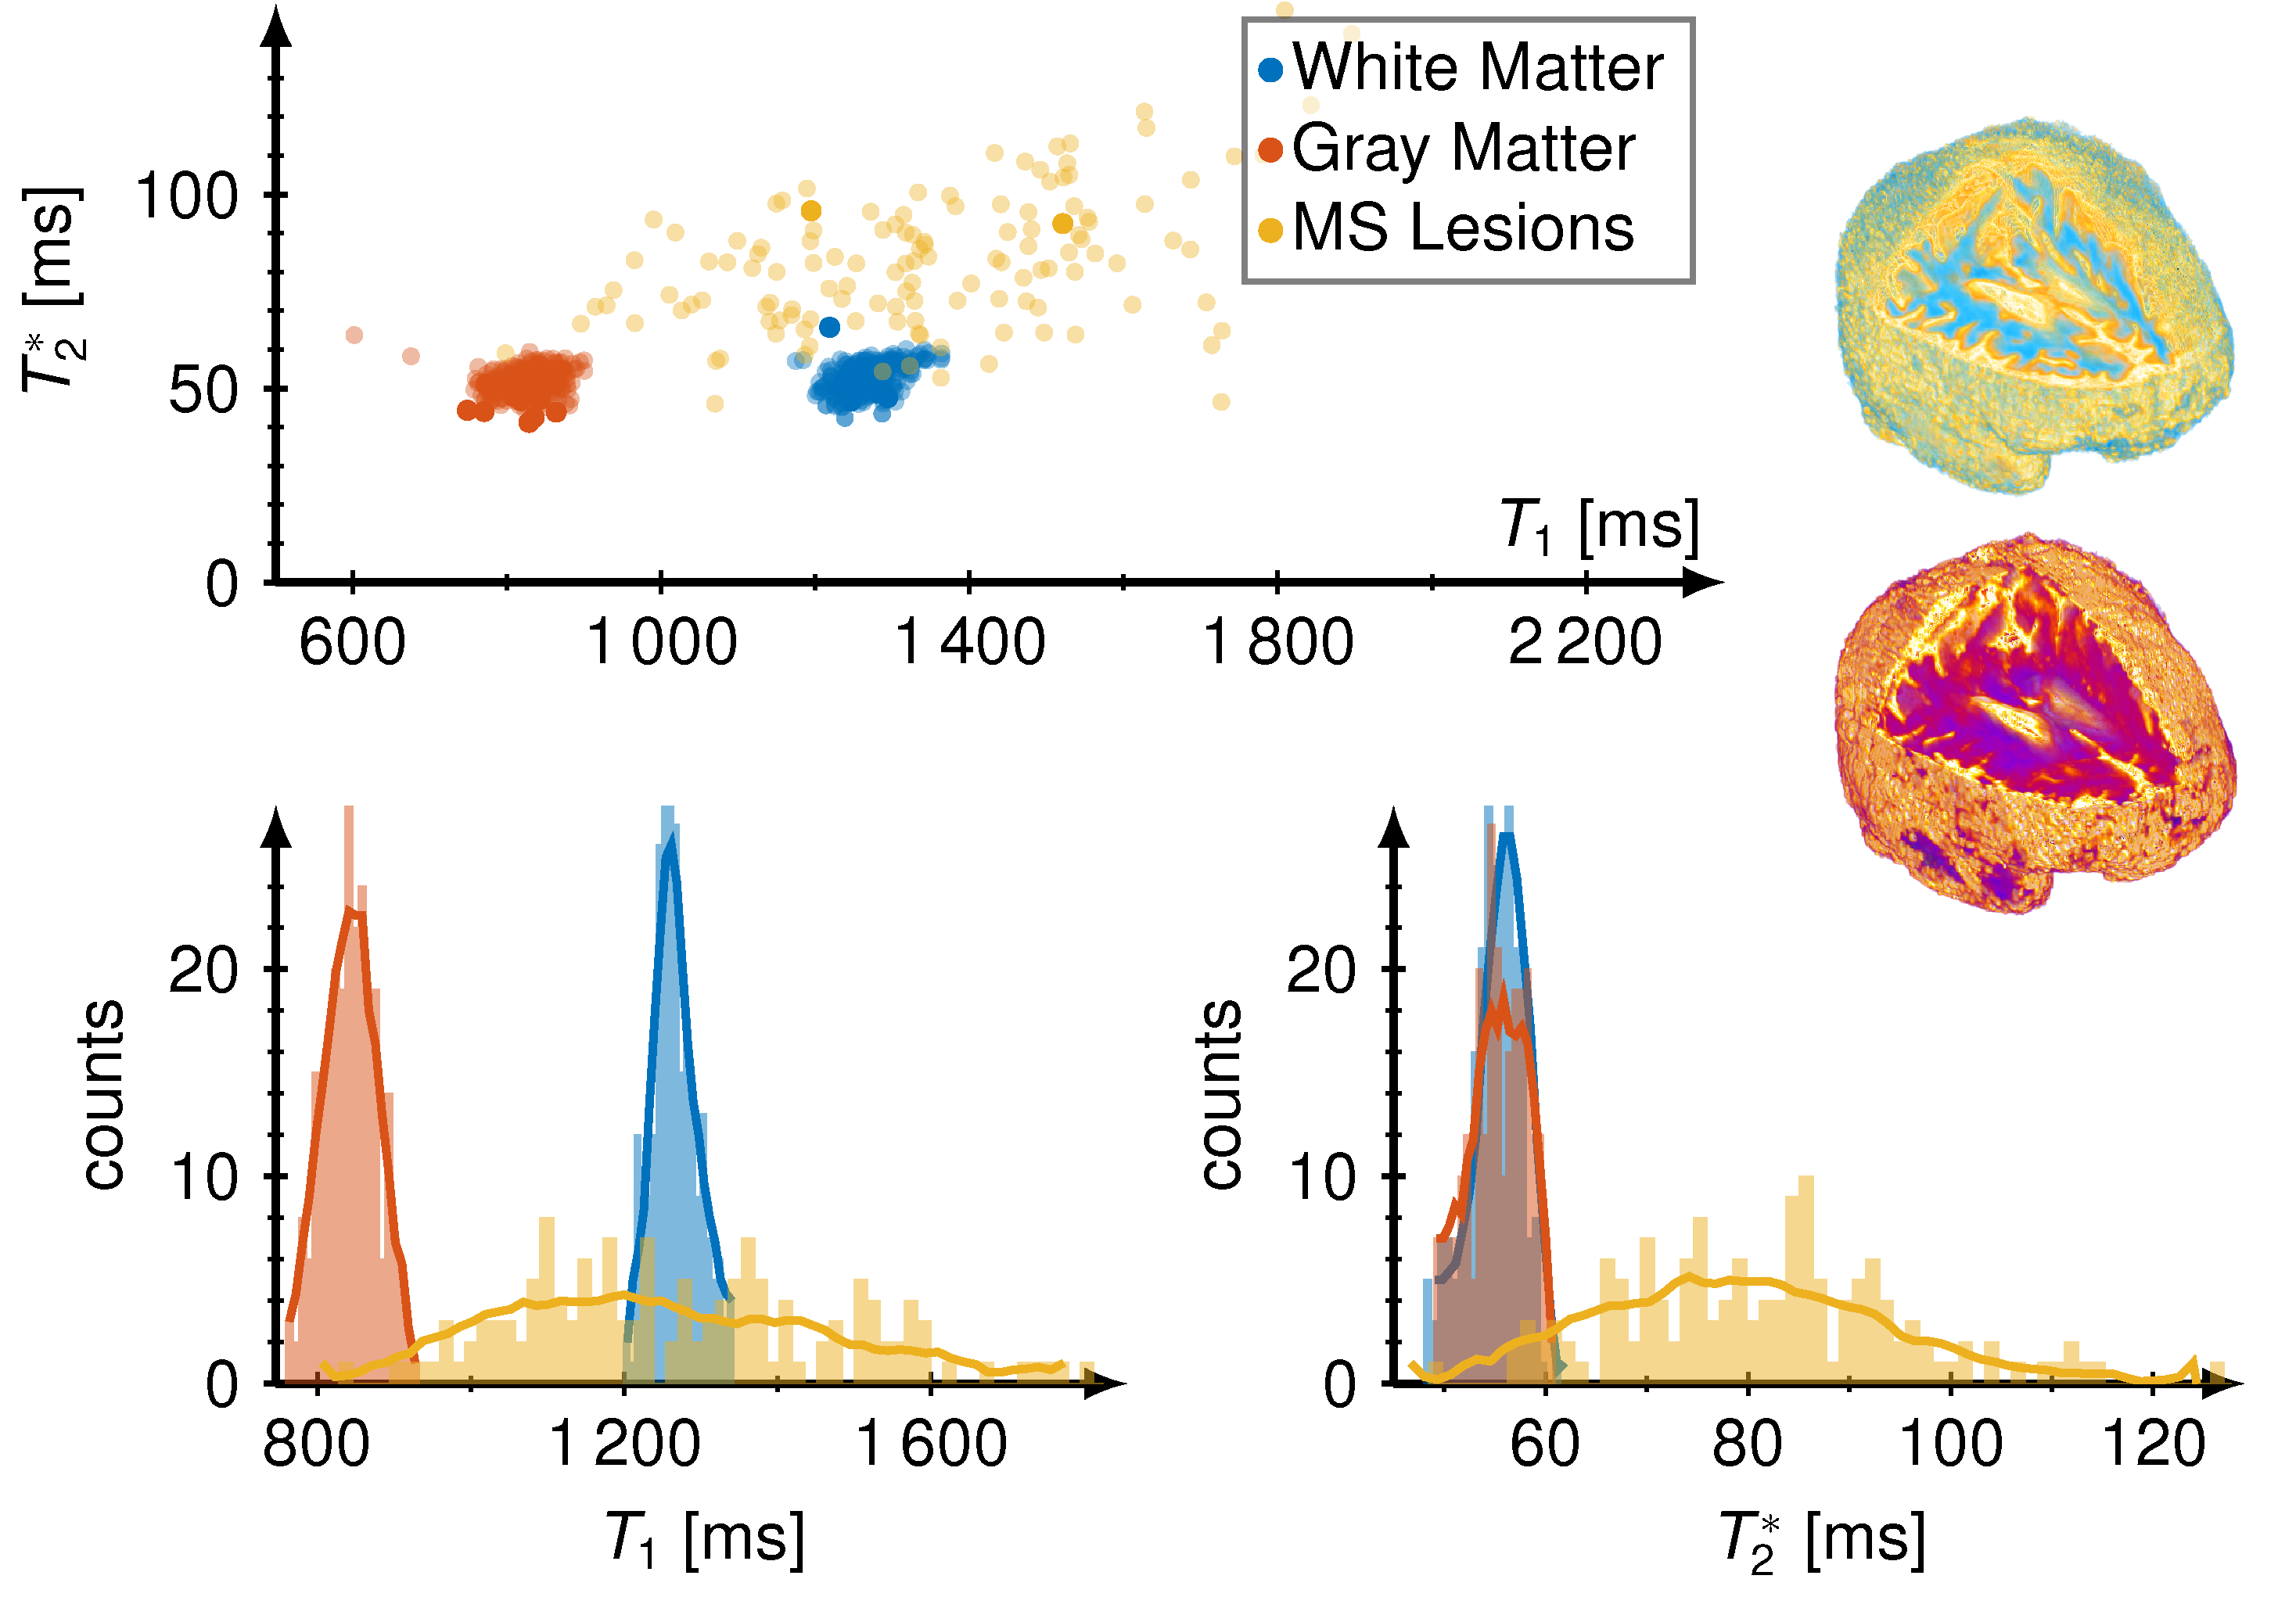
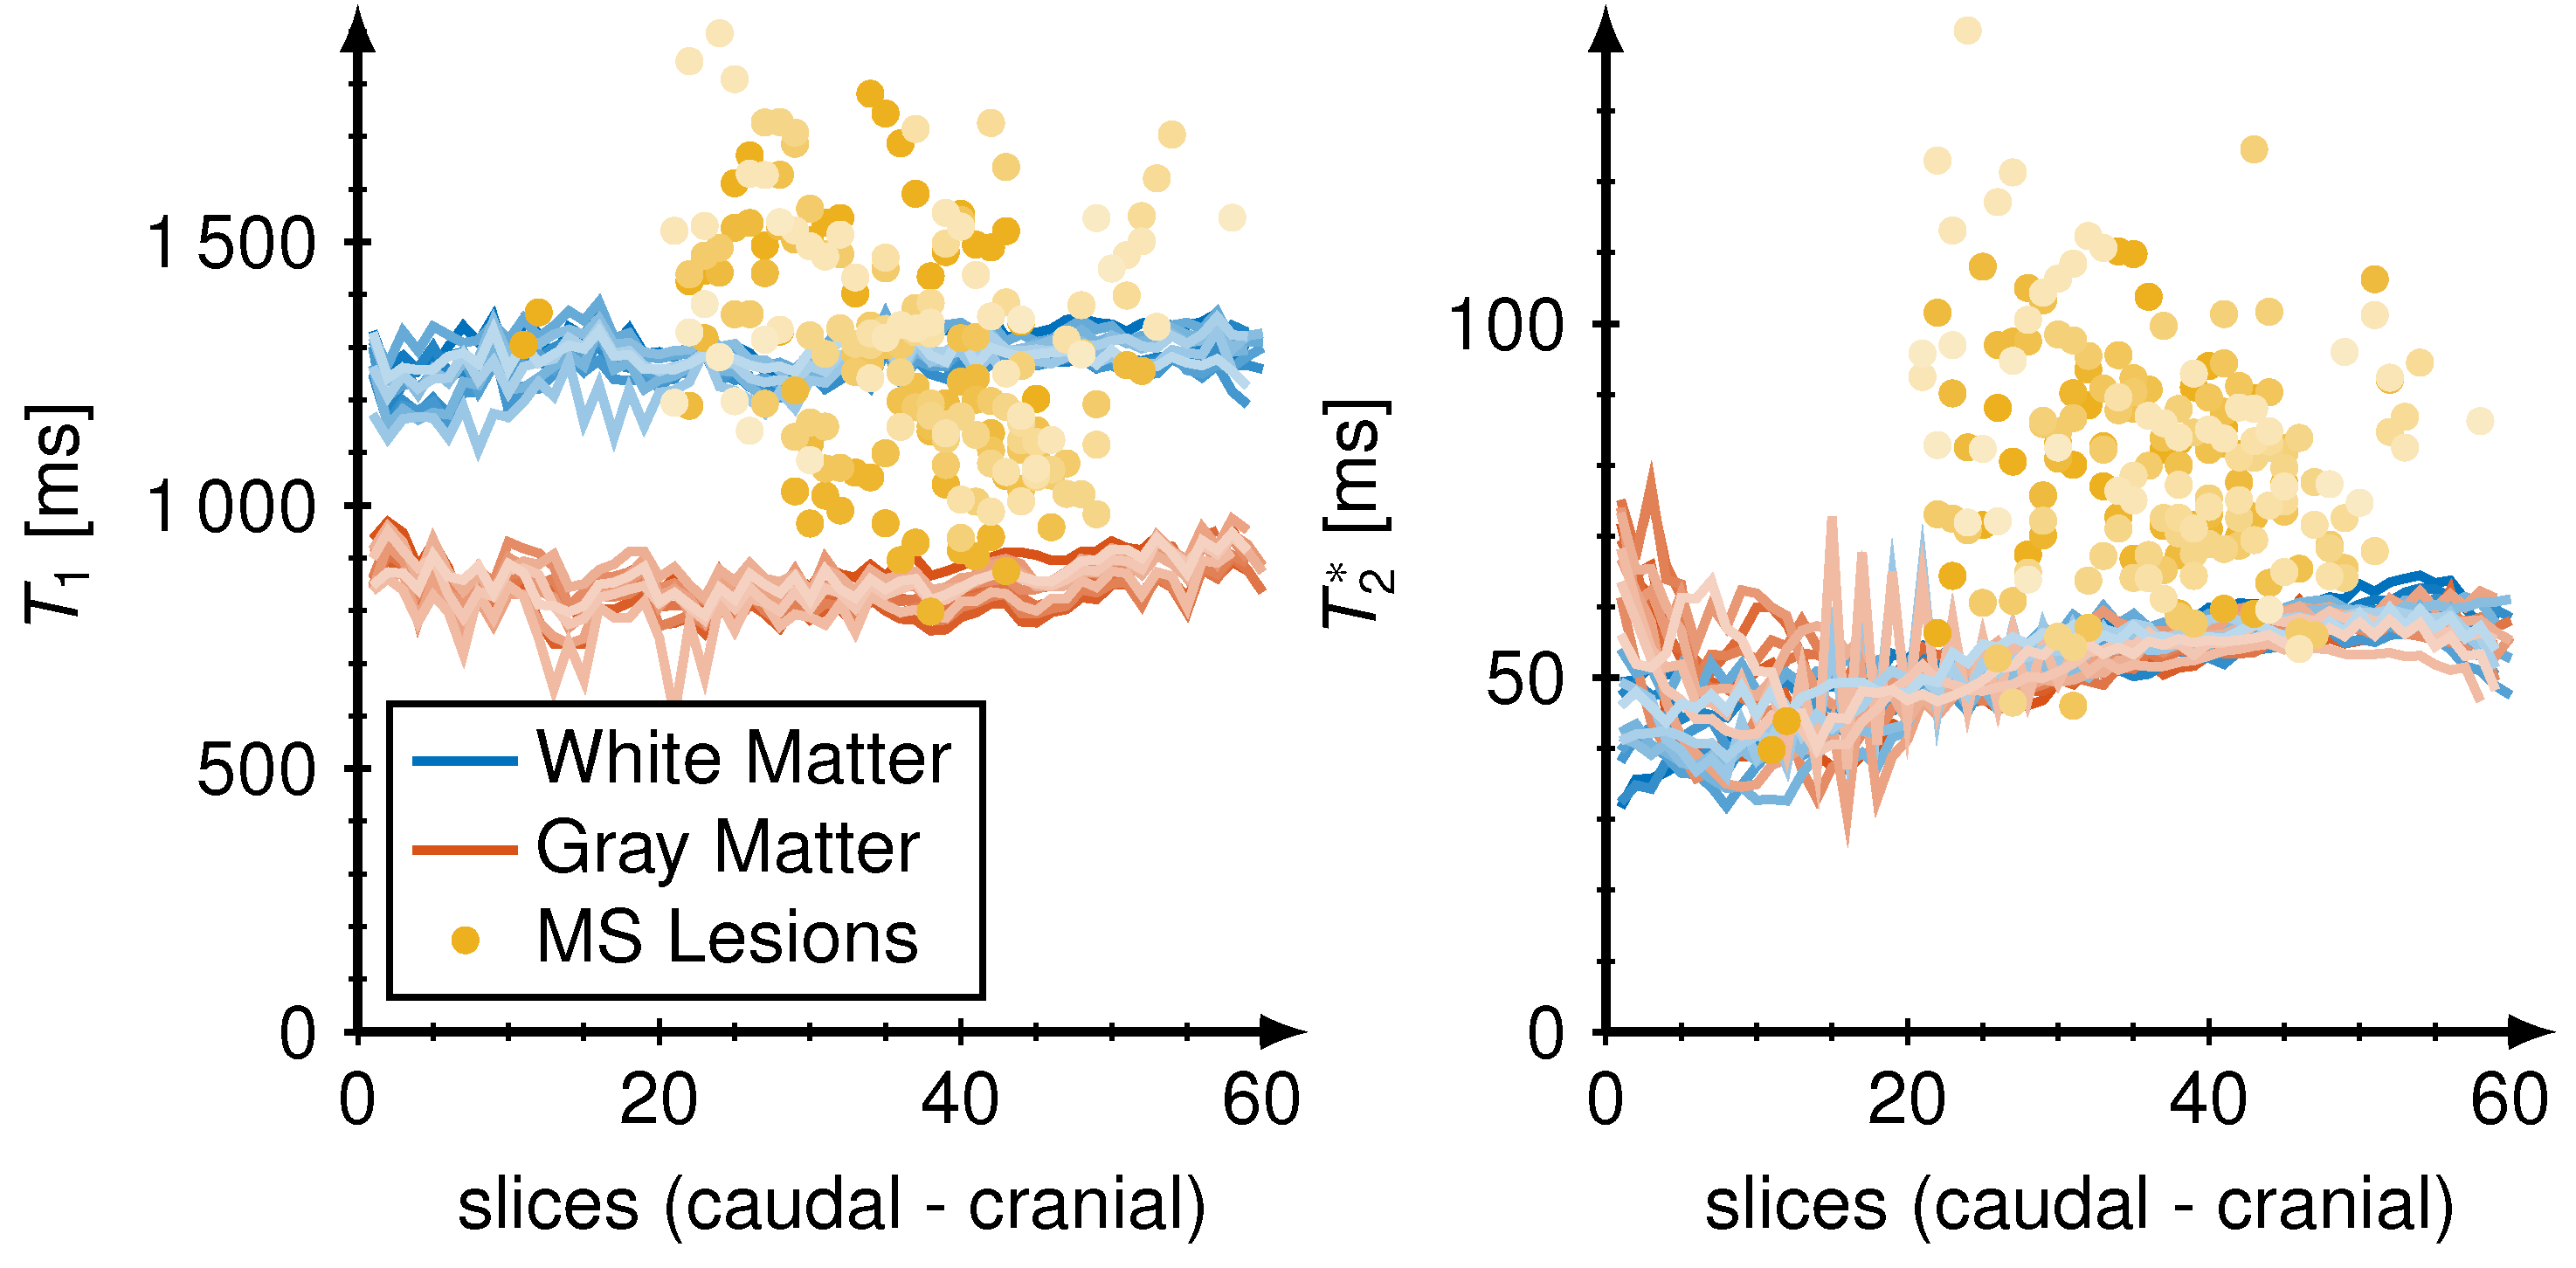
We measured T1 and T2* maps in vivo in 44 multiple sclerosis patients and calculated mean vales and standard deviations for all patients and slices. We found T1 / T2* in white matter 1259 ± 147 ms / 51 ± 9 ms, gray matter 834 ± 117 ms / 52 ± 9 ms and MS lesions 1896 ± 251 ms / 147 ± 34 ms, respectively. Figure 1 shows the representative maps of three slices covering MS lesions. Single MS lesions yielded mean values and standard deviations of T1 and T2* times up to 2271 ± 287 ms and 227 ± 39 ms. All T1 and T2* times are depicted for each patient and all slices in Fig. 2. Two distinct clusters are observed for white matter (blue) and gray matter (orange). MS lesions resulted in T1 times smaller and more often higher than white matter, whereas in T2* lesions consistently higher values than in white and gray matter are observed. T2* showed no significant difference between white and gray matter.Figure 3 shows the mean values of T1 and T2* for 12 different patients (increasing brightness) over all slices. Variations in mean T1 and T2* times over multiple slices were less than 10 %, however, T2* showed variations of up to 50 % for caudal slices.
Discussion
This study showed the benefit of using quantitative MRI to detect MS lesions. We showed that MRF can quantify T1 and T2* times of the whole brain in less than 5 minutes (Skyra) and 2 minutes (Prisma) with promising map quality and relaxation times comparable to the literature [4].A distinct separation between white and gray matter was observed in the T1, T2* space and a broad distribution was observed for MS lesions.
Caudal slices showed higher deviations as a results of distortion during the image acquisition due to susceptibility artifacts induced by the nasal cavities.
Conclusion
Using MRF-EPI for quantify T1 and T2* for the whole brain showed promising results in clinical routines to improve the work flow and detection of multiple sclerosis lesions. Further research will focus on characterizing the MS lesion types based on their distribution and T1, T2* times.Acknowledgements
No acknowledgement found.References
[1] Bonnier Guillaume, Roche Alexis, Romascano David, et al. Advanced MRI unravels thenature of tissue alterations in early multiple sclerosis Annals of Clinical and TranslationalNeurology. 2014;1:423-432.
[2] Ma Dan, Gulani Vikas, Seiberlich Nicole, et al. Magnetic resonance fingerprinting Nature. 2013;495:187–192.
[3] Rieger Benedikt, Akcakaya Mehmet, Pariente José C., et al. Time efficient whole-braincoverage with MR Fingerprinting using slice-interleaved echo-planar-imaging Sci Rep.2018;8:2045-2322.
[4] Bonnier Guillaume, Roche Alexis, Romascano David, et al. Multicontrast MRI Quantificationof Focal Inflammation and Degeneration in Multiple Sclerosis Biomed Res Int.. 2015.
Figures