1418
Measurement of white matter atrophy in multiple sclerosis using diffusion weighted imaging
Elisabetta Pagani1, Loredana Storelli1, Paolo Preziosa1,2, Federica Esposito2, Laura Cacciaguerra1,2, Massimo Filippi1,2,3, and Maria A. Rocca1,2
1Neuroimaging Research Unit, Institute of Experimental Neurology, Division of Neuroscience, IRCCS San Raffaele Scientific Institute, Milan, Italy, 2Neurology Unit, IRCCS San Raffaele Scientific Institute, Milan, Italy, 3Vita-Salute San Raffaele University, Milan, Italy
1Neuroimaging Research Unit, Institute of Experimental Neurology, Division of Neuroscience, IRCCS San Raffaele Scientific Institute, Milan, Italy, 2Neurology Unit, IRCCS San Raffaele Scientific Institute, Milan, Italy, 3Vita-Salute San Raffaele University, Milan, Italy
Synopsis
Gray matter is more relevant than white matter (WM) atrophy in explaining clinical disability and cognitive impairment in multiple sclerosis (MS). However, WM is a complex structure whose fiber orientation should be considered when investigating its morphology. In a group of MS patients and healthy controls, we applied constrained spherical deconvolution and fixel-based morphometry to estimate the distribution of WM fiber bundles and their cross-section area as a measure of atrophy. We found that the application of this approach in MS improved when accounting for the presence of lesions and that atrophy was specific of WM fiber bundles.
Introduction
Gray matter is more relevant than white matter (WM) atrophy in explaining clinical disability and cognitive impairment in multiple sclerosis (MS).1 However, WM is a complex structure whose fiber orientation should be considered when investigating its morphology.2 Constrained spherical deconvolution (CSD)3,4 is an advanced diffusion weighted (DW) model that provides an estimate of the distribution of fibers within each imaging voxel, contributing to better characterize regions with crossing-fibers.Objective
This study aimed at assessing the applicability of the DW CSD MRI model in MS, and to estimate a measure of WM atrophy for specific fiber bundles.Methods
Multi-shell DWI and 3D T1-weighted MRI scans were obtained from 45 MS patients and 45 age- and sex-matched healthy controls (HC). To assess the applicability of CSD in the presence of focal lesions, we performed the FOD estimation by computing the response functions starting from two different four-tissue segmentations: one performed on the original 3D T1-weighted image and the other performed using the 3D T1-weighted image after hyperintense lesion filling process.5 We compared the amplitude and directions of fiber orientation density (FOD) distributions between HC and MS, including also for the presence of lesions in the model. The ‘fixel-based morphometry’6 was then applied to estimate fiber bundle cross-section (FC) atrophy in MS against HC. Voxel-based analysis of fractional anisotropy (FA) was also performed.Results
Within lesion locations, we found significant differences (p<0.001) of FOD’s amplitude between MS and HC, and between MS patients when including the lesion filling technique (p<0.001) (Figure 1). By including lesions in the model, CSD was able to estimate FOD, even if fiber directions were significantly underestimated (p<0.001). The fixel-based morphometry showed a significant reduction of the WM FC in MS compared to HC that was specific for each fiber bundle (Figure 2). Decreases in FA in MS patients compared to HC involved less extensive regions with respect to FC.Conclusions
The multi-shell CSD method proved to be an advanced DW model that could be applied in MS for a fiber-specific study of the WM microstructure and fiber-bundle atrophy quantification, after accounting for the presence of MS lesions within the model.Acknowledgements
Partially supported by a grant from Fondazione Italiana Sclerosi Multipla (FISM2018/R/16).References
1. Roosendaal SD, Bendfeldt K, Vrenken H, et al. Grey matter volume in a large cohort of MS patients: relation to MRI parameters and disability. Mult. Scler. 2011;17(9):1098-106. 2. Fields RD. Neuroscience. Change in the brain's white matter. Science 2010;330:768-769. 3. Jeurissen B, Tournier JD, Dhollander, T, et al. Multi-tissue constrained spherical deconvolution for improved analysis of multi-shell diffusion MRI data. Neuroimage 2014;103:411-426. 4. Roine, T., Jeurissen, B., Perrone, D., Aelterman, J., Philips, W., Leemans, A., Sijbers, J., 2015. Informed constrained spherical deconvolution (iCSD). Med Image Anal 24, 269-281. 5. Battaglini M1, Jenkinson M, De Stefano N. Evaluating and reducing the impact of white matter lesions on brain volume measurements.Hum Brain Mapp. 2012;33(9):2062-71. 6. Raffelt DA, Tournier JD, Smith RE, et al.. Investigating white matter fibre density and morphology using fixel-based analysis. Neuroimage 2017;144:58-73.Figures
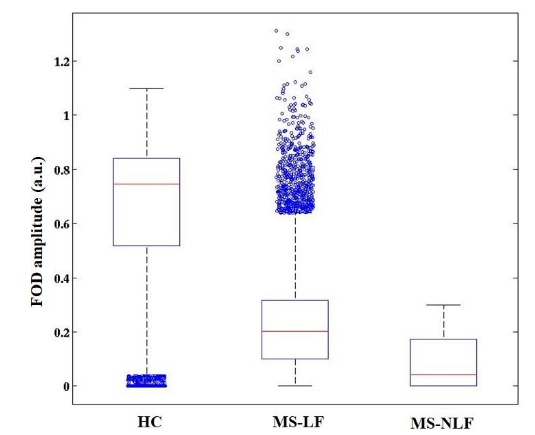
Figure 1. Distribution of FODs amplitudes. The Box and
Whisker plot for the distribution of FODs amplitude values within corresponding
regions of WM lesions for the healthy controls (HC), MS patients with the use
(MS-LF) and without the use (MS-NLF) of the lesion filled 3D T1-weighted MRI.
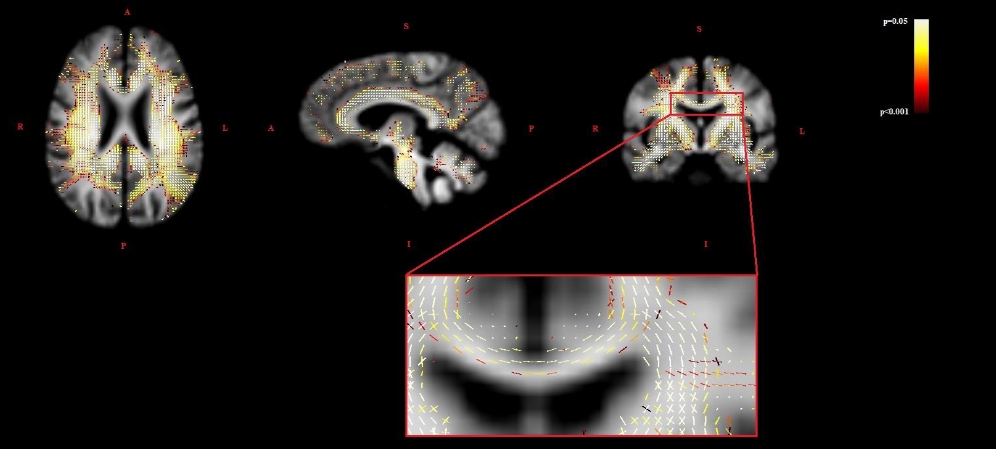
Figure 2. Fixel-based
analysis results. Fixels that were significantly decreased in the MS patients
compared to healthy controls for the fiber bundle cross-section (FC) metric are shown for a single axial,
sagittal and coronal slice, respectively. The zoomed insets exhibits
differences to specific fixels also in crossing-fiber regions, with fixels
colored by FWE-corrected p-value. R=right; L=left; A=anterior; P=posterior;
S=superior; I=inferior.