1416
Shape and Spatial Pattern Analysis through Covariance-based Estimations of MS lesions: the SSPACE-MS study1UCL Queen Square Institute of Neurology, University College London, London, United Kingdom, 2Neurology, Luton and Dunstable University Hospital, Luton, United Kingdom, 3Centre for Medical Image Computing, Department of Computer Science, University College London, London, United Kingdom, 4Centre for Medical Image Computing, Medical Physics and Biomedical Engineering department, University College London, London, United Kingdom, 5e-Health center, Universitat Oberta de Catalunya, Barcelona, Spain, 6Department of Medicine, St. George’s University of London, London, United Kingdom, 7University College London Hospitals Biomedical Research Centre, National Institute for Health Research, London, United Kingdom, 8Department of Brain and Behavioural Sciences, University of Pavia, Pavia, Italy, 9Brain MRI 3T Research Centre, IRCCS Mondino Foundation, Pavia, Italy
Synopsis
Lesion load is the main predictor of future disability in multiple sclerosis (MS) but its predictive power is limited possibly because key aspects of lesions, such as their spatial distribution, morphology or pathological substrate are not being considered. Here we demonstrate the relevance of shape and spatial features of white matter lesions in the development of disability in MS through a novel approach. This new methodological framework (SSPACE-MS) is based on the analysis of the covariance matrix defined by the spatial position of lesional voxels. It can be applied longitudinally and is easily implementable in clinical practice.
BACKGROUND
Multiple sclerosis (MS) is inflammatory-demyelinating condition that usually first affects people as young adults but evolves over decades.1 Its effects can be devastating, but are difficult to predict. Lesion load, determined using MRI, is currently the main predictor of future disability.2 However, at an individual level, lesion loads are poorly predictive, possibly because lesion location3, 4 and intensity of pathological abnormalities (not just their extent),5 which are also clinically relevant, are not being considered. Using MRI, and so in clinical practice, it is not possible to robustly assess lesion pathology, but it has been suggested that pathology may be approximated by lesion shape analysis.6-8In this study we assessed the relevance of the spatial distribution and shape of white matter (WM) lesions to disability in MS. To obtain such features we developed a novel approach, which can be applied longitudinally and be easily implemented in the clinic. This new framework (SSPACE-MS) assesses the covariance matrix defined by the spatial position of lesional voxels, providing us with rotationally/translationally-invariant descriptors of the spatial distribution of lesions in the brain (whole-brain) and lesion shape (lesion-wise).
More specifically, we aimed to assess the relationship between the new shape and spatial metrics and known parameters of brain tissue damage, their association with disability scores and how they change over time.
METHODS
Subjects:Sixty-two people with MS (29 relapsing-remitting, 19 secondary progressive, and 14 primary progressive) were assessed clinically (to determine the Expanded Disability Status Scale (EDSS) scores) and with MRI, at study baseline and at follow-up (average: 22 months).9
MRI acquisition & pre-processing:
Acquisition protocol: 3D T1-weighted (1x1x1 mm3), T2-weighted (1x1x3 mm3) and diffusion-weighted (60 directions at b=1200 s/mm2, 2x2x2 mm3) MRI scans at 3T (Philips Achieva MR scanner). Pre-processing: semi-automated segmentation of white matter (WM) T2 lesions by the same person at both time points; resample WM T2 lesion mask images to isotropic 3D T1 space (1x1x1 mm3); computation, for each subject and time point of: whole-brain normal-appearing WM (NAWM) and grey matter (GM) volumes, including deep (DGM) and cortical GM (CGM); within-lesion mean values of diffusion-tensor imaging (DTI) metrics: fractional anisotropy (DTI-FA) and axial/radial/mean diffusivity (DTI-AD/RD/MD).
SSPACE-MS analysis:
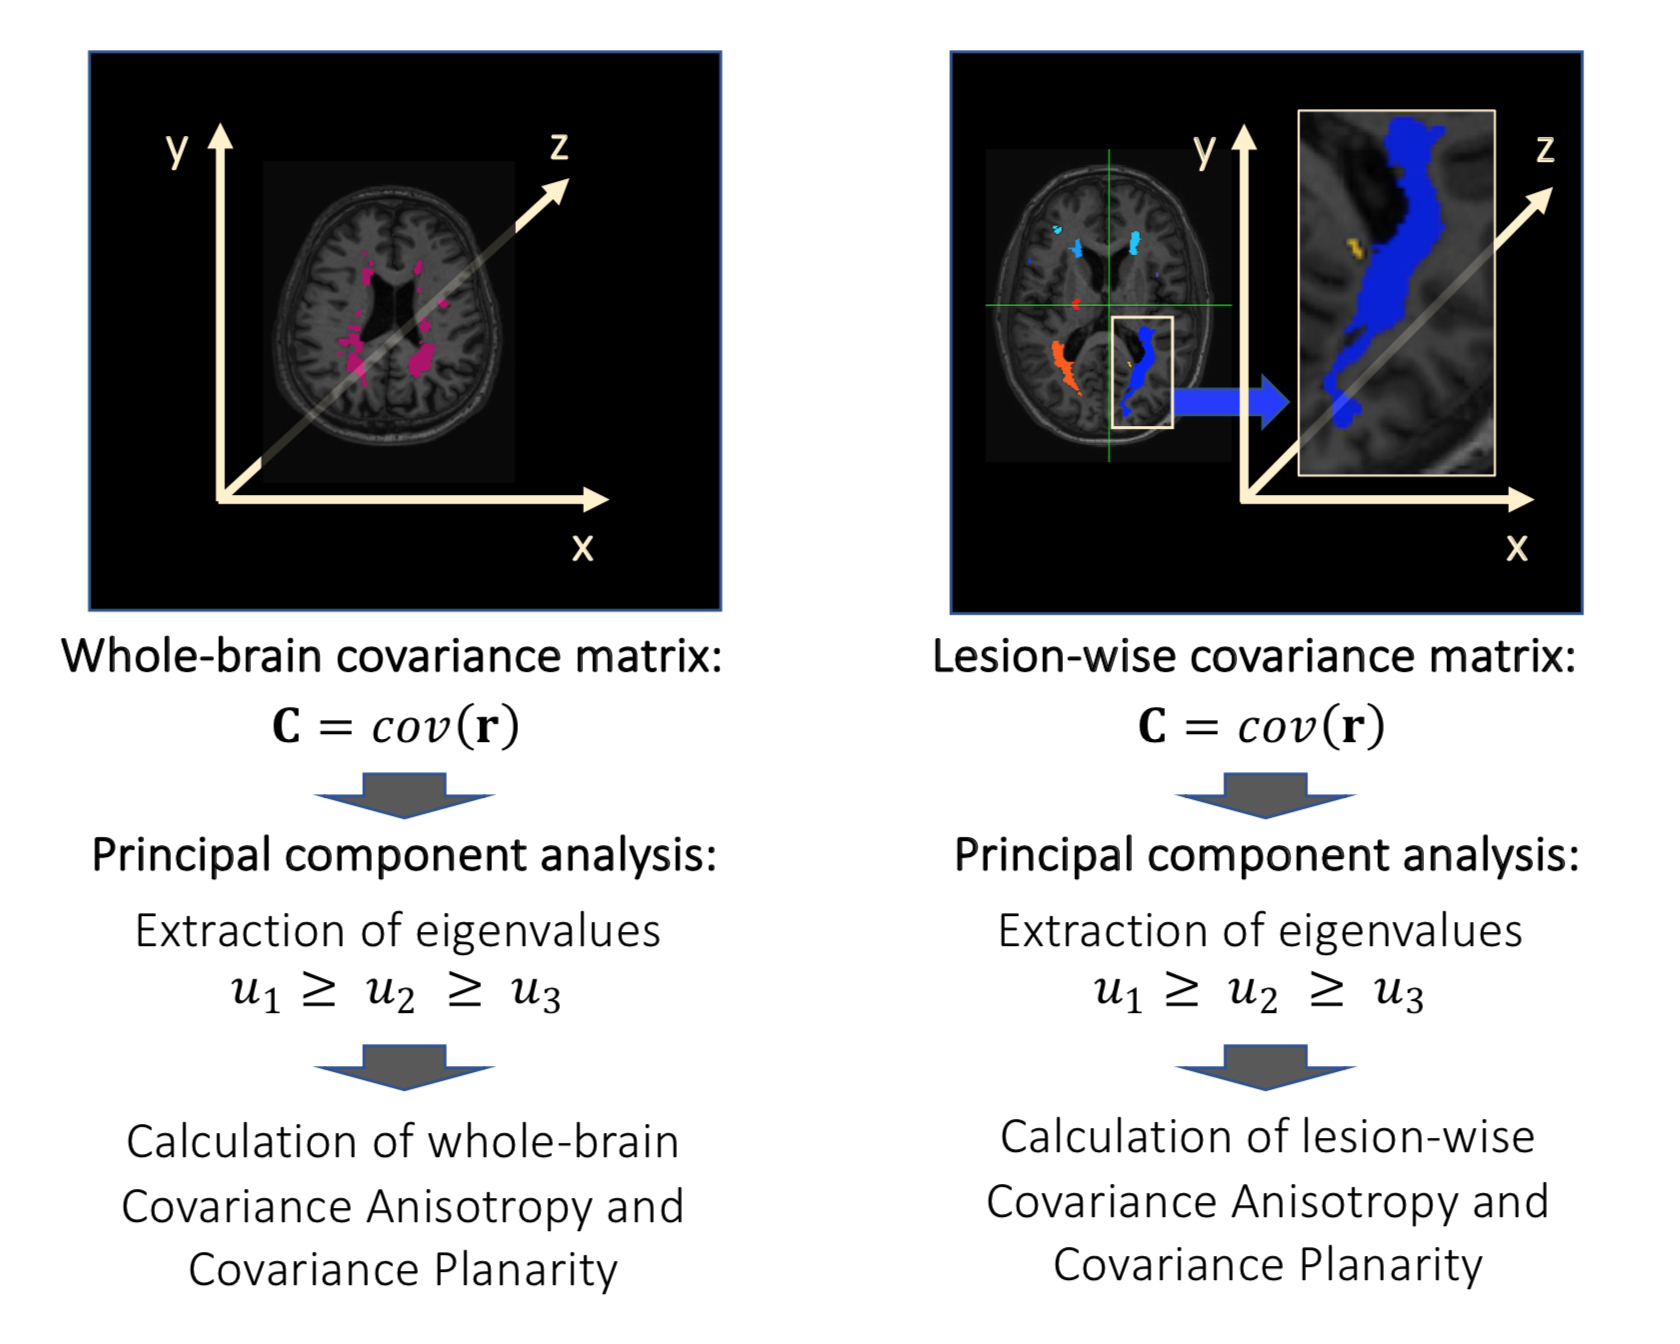
We followed these steps (Fig1):
1) Calculation of 3D positions r=(x,y,z) of lesional voxels for each subject;
2) Calculation of the spatial covariance matrix C=cov(r)=E[r rT] of the 3D positions r of lesional voxels for:
- all lesional voxels in the brain;
- all lesional voxels within a given lesion, for each lesion;
4) Calculation of rotationally/translationally-invariant spatial covariance metrics, referred to as geomorphometric metrics, which describe the shape of whole-brain lesion masks or of each individual lesion.10 These metrics are:
- Covariance Anisotropy (CA), and
- Covariance Planarity (CP).
$$CA=\frac{\sqrt{3}}{\sqrt{2}} \frac{\sqrt{(u_1-u)^2+(u_2 - u)^2+(u_3 - u)^2}}{\sqrt{u_1^2+u_2^2+u_3^2}} [1] $$
and
$$CP=\frac{1-3\sqrt{6}\det \ (\frac{C_{dev}}{||C_{dev}||})}{2}.[2] $$
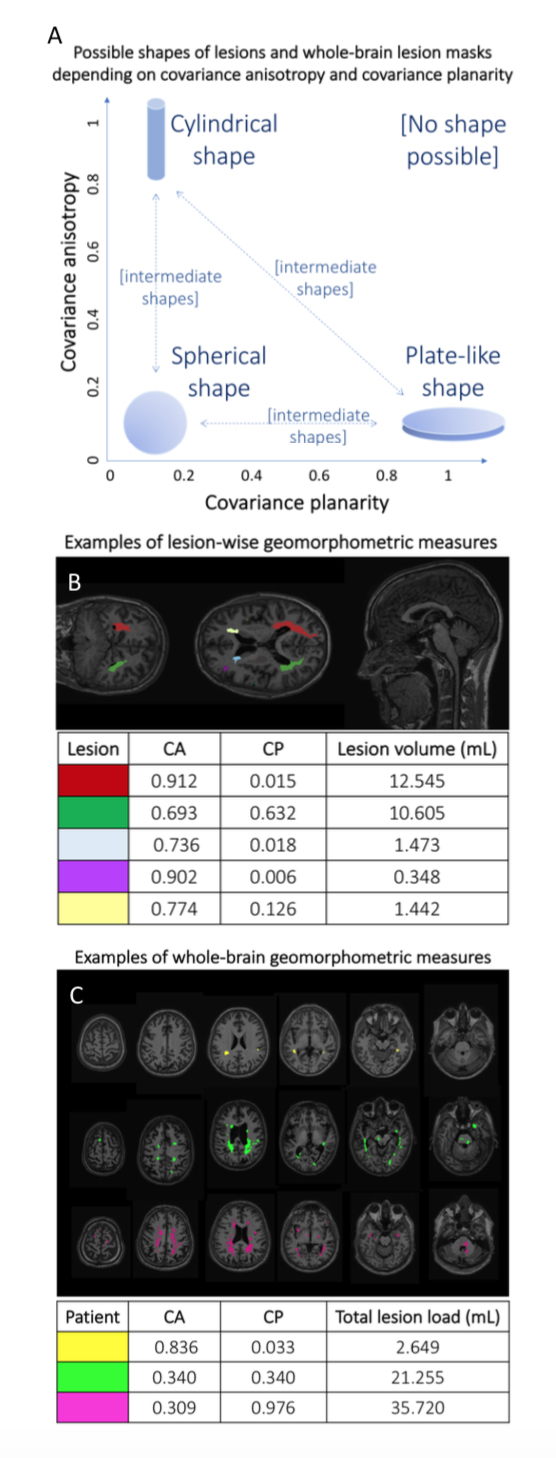
In equations [1] and [2], $$$u=\frac{u_1+u_2+u_3}{3},\bf C\tt_{dev}=\bf C\tt-\frac{tr(\bf C\tt)}{3}\bf I$$$ and $$$\tt||\bf C\tt _{dev}||=\sqrt{tr(\bf C\tt_{dev}{\bf C\tt_{dev}}^T)}$$$. Covariance is evaluated for $$$\bf r$$$ varying both within the whole-brain lesion mask or within an individual lesion, at each time point, obtaining CA and CP, common descriptors of ellipsoid shape,10 at whole-brain or lesion levels (Fig2). Afterwards, mean values of lesion-wise metrics were obtained for each patient and time point.
Statistical analyses:
Multiple linear regression and mixed effects models adjusting for confounders (age, gender, total lesion volume, mean lesion volume, disease duration) were used, as appropriate.
RESULTS
Table 1 shows patients’ main characteristics at baseline.Association with brain damage
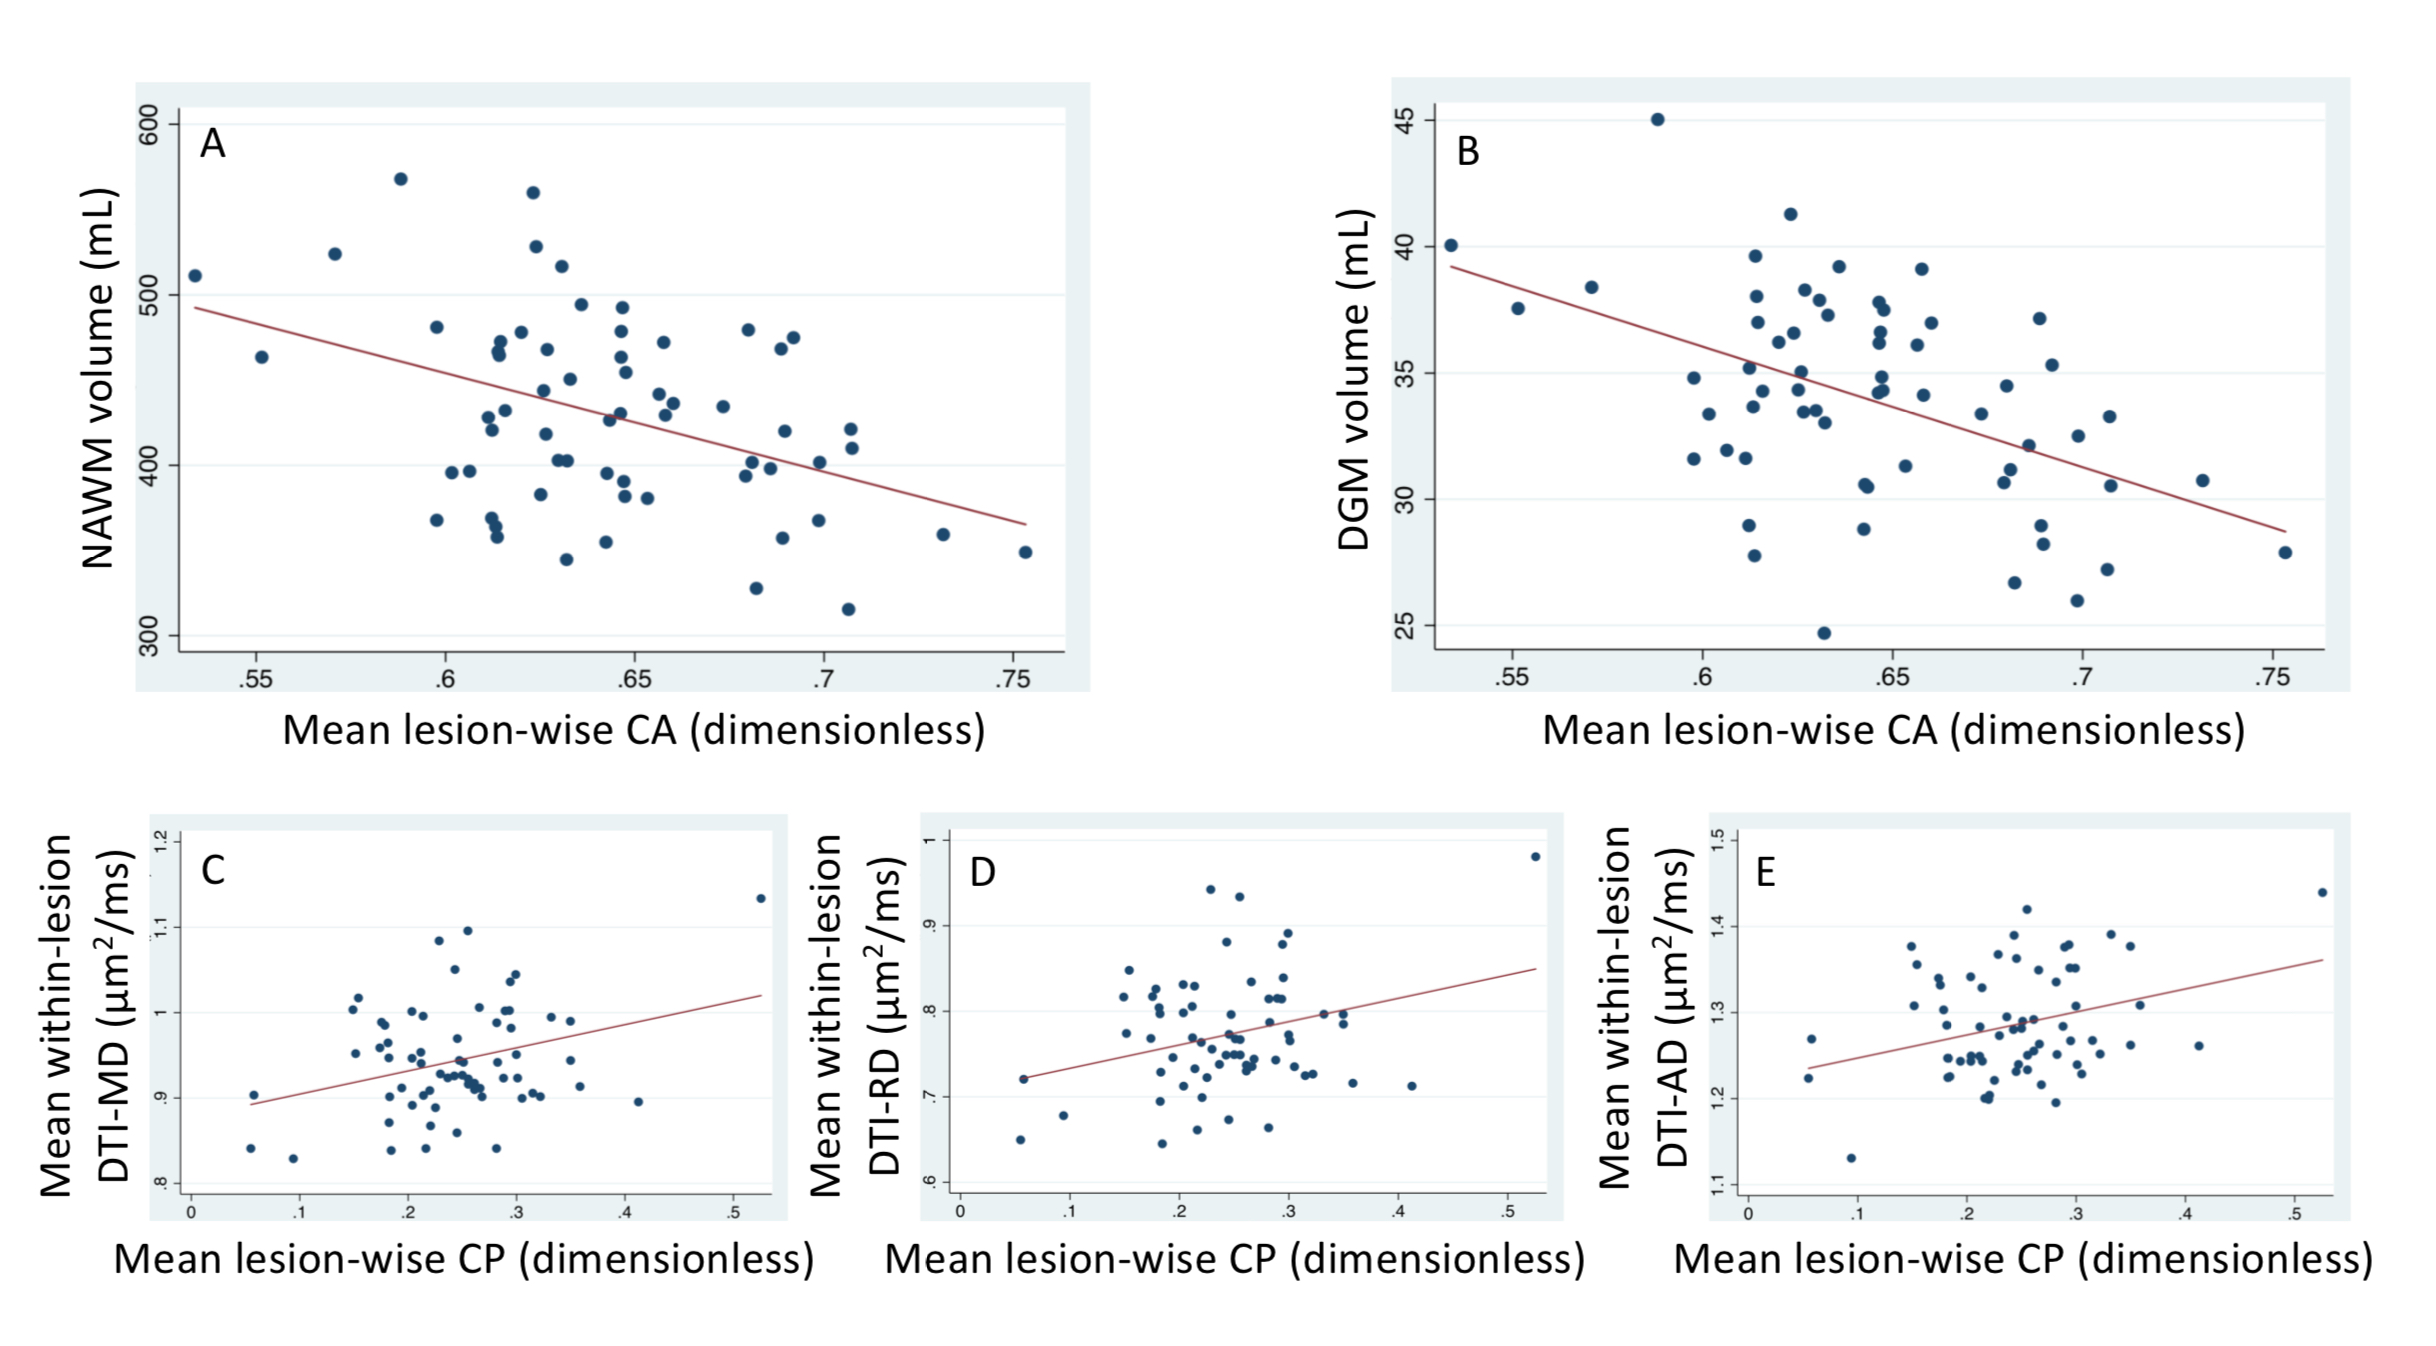
Greater whole-brain CP was associated with lower DGM volume (p=0.040). Greater mean lesion-wise CA was associated with lower NAWM volumes (p=0.036) and lower DGM volumes (p=0.006). Additionally, greater mean lesion-wise CP was associated with higher within-lesion DTI-MD, DTI-RD and DTI-AD (p=0.025, p=0.042, and p=0.011, respectively) (Fig3).
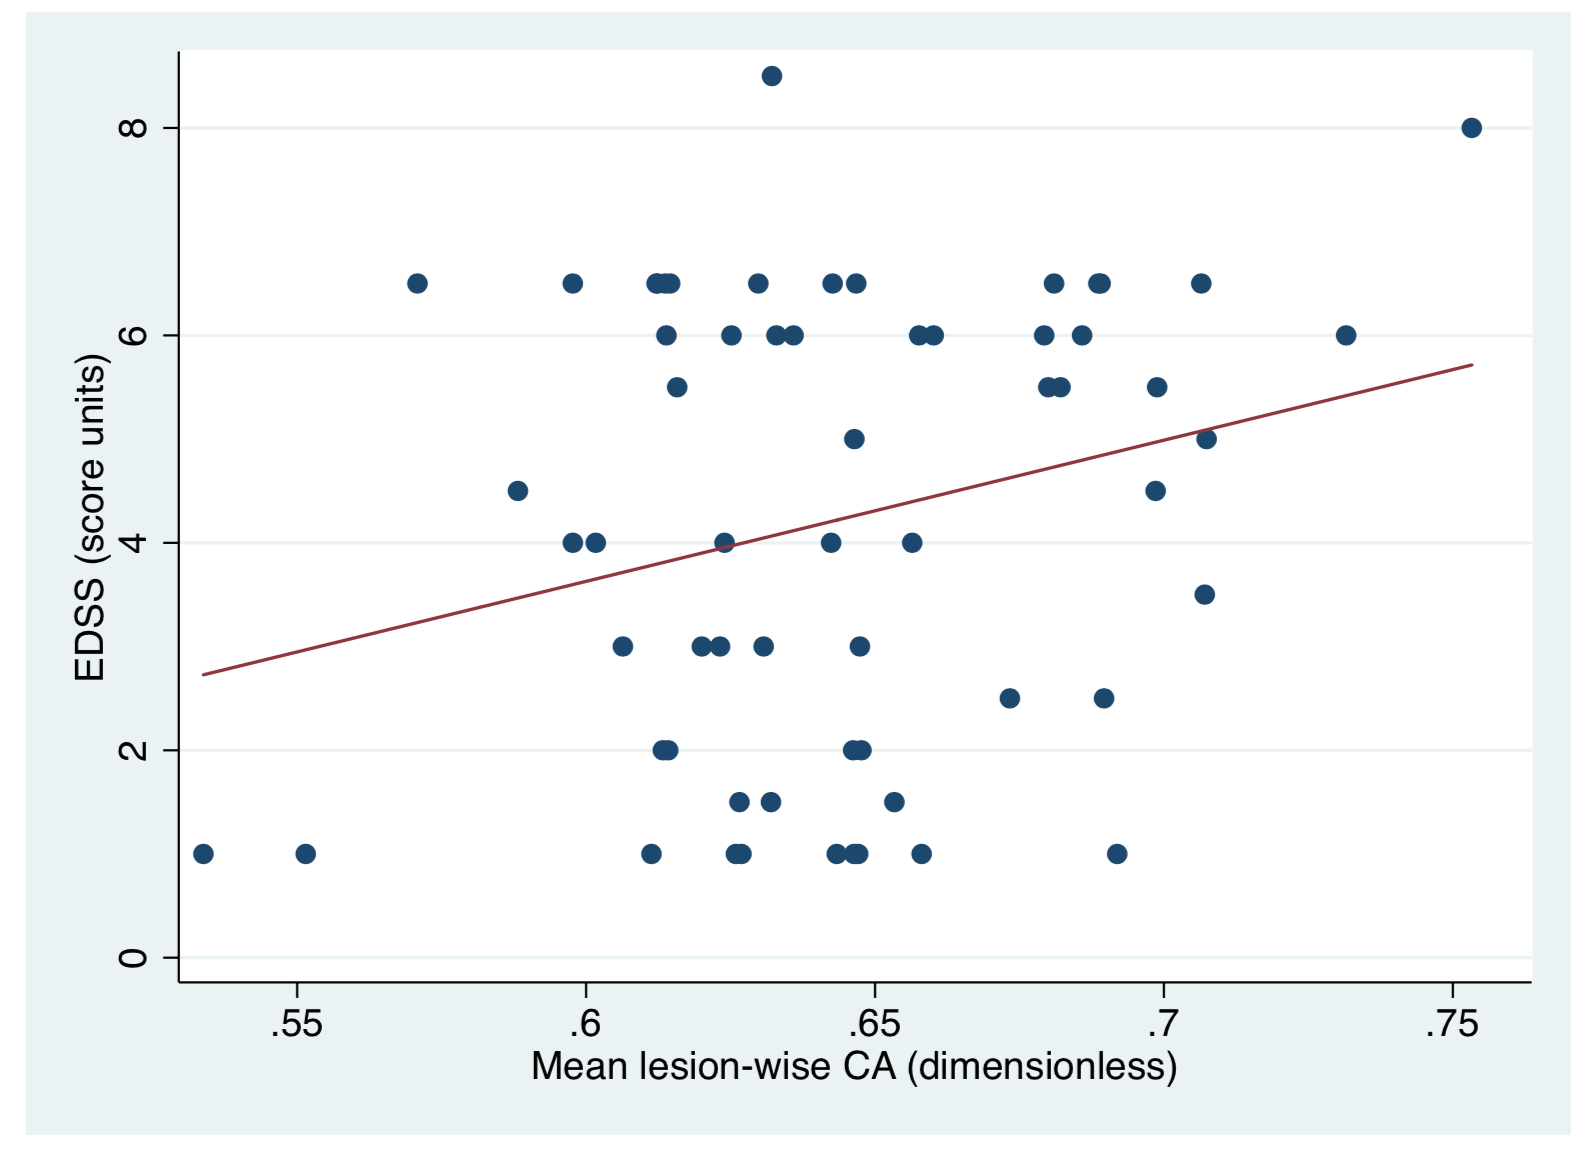
Association with disability
Greater mean lesion-wise CA strongly correlated with higher EDSS scores (p=0.004) (Fig4).
Change over time
Mean lesion-wise CA significantly increased over the 22-month period of time (p<0.001), whereas no significant changes in total lesion load (or other metrics) were observed.
DISCUSSION AND CONCLUSIONS
Here we present SSPACE-MS, a novel methodological approach to assess key aspects of WM lesions in MS, namely their spatial distribution and their shape. We also demonstrate that these features may be relevant to disease progression.Both whole-brain and lesion-wise geomorphometric features are associated with underlying brain tissue damage. Notably, those patients whose lesions are more anisotropic appear to have greater tissue damage, both outside and inside lesions. Additionally, patients with more anisotropic lesions tended to have greater levels of disability than patients with more isotropic lesions, and we speculate that this is due to the greater underlying damage that is associated to lesions with anisotropic shapes. Finally, our study suggests that lesion-wise CA is sensitive to change over time, more so than total lesion load, the predictor most commonly used in the clinic.
In conclusion, we show the potential of geomorphometric metrics to predict clinical outcomes, using scans obtained routinely in daily practice. Further studies confirming our results in other cohorts are warranted.
Acknowledgements
2015 postdoctoral research ECTRIMS Fellowships. Acknowledgments to the UCL-UCLH Biomedical Research Centre for ongoing funding; the European Union’s Horizon 2020 research and innovation programme under grant agreement No. 634541; the Engineering and Physical Sciences Research Council (EPSRC EP/R006032/1, M020533/1), Spinal Research (UK), Wings for Life (Austria), Craig H. Neilsen Foundation (USA) (jointly funding the INSPIRED study), Wings for Life (#169111), the UK Multiple Sclerosis Society (grants 892/08 and 77/2017), and Guarantors of Brain.References
- Thompson AJ, Baranzini SE, Geurts J, Hemmer B, Ciccarelli O. Multiple sclerosis. Lancet 2018;391:1622-1636.
- Fisniku LK, Brex PA, Altmann DR, et al. Disability and T2 MRI lesions: a 20-year follow-up of patients with relapse onset of multiple sclerosis. Brain 2008;131:808-817.
- He Y, Dagher A, Chen Z, et al. Impaired small-world efficiency in structural cortical networks in multiple sclerosis associated with white matter lesion load. Brain 2009;132:3366-3379.
- Filippi M, van den Heuvel MP, Fornito A, et al. Assessment of system dysfunction in the brain through MRI-based connectomics. Lancet Neurol 2013;12:1189-1199.5.
- Frischer JM, Weigand SD, Guo Y, et al. Clinical and pathological insights into the dynamic nature of the white matter multiple sclerosis plaque. Ann Neurol 2015;78:710-721.
- Newton BD, Wright K, Winkler MD, et al. Three-Dimensional Shape and Surface Features Distinguish Multiple Sclerosis Lesions from Nonspecific White Matter Disease. J Neuroimaging 2017;27:613-619.
- Elliott C, Belachew S, Wolinsky JS, et al. Chronic white matter lesion activity predicts clinical progression in primary progressive multiple sclerosis. Brain 2019;142:2787-2799.
- Elliott C, Wolinsky JS, Hauser SL, et al. Slowly expanding/evolving lesions as a magnetic resonance imaging marker of chronic active multiple sclerosis lesions. Mult Scler 2018:1352458518814117.
- Charalambous T, Tur C, Prados F, et al. Structural network disruption markers explain disability in multiple sclerosis. J Neurol Neurosurg Psychiatry 2019;90:219-226.
- Ennis DB, Kindlmann G. Orthogonal tensor invariants and the analysis of diffusion tensor magnetic resonance images. Magn Reson Med 2006;55:136-146.
Figures
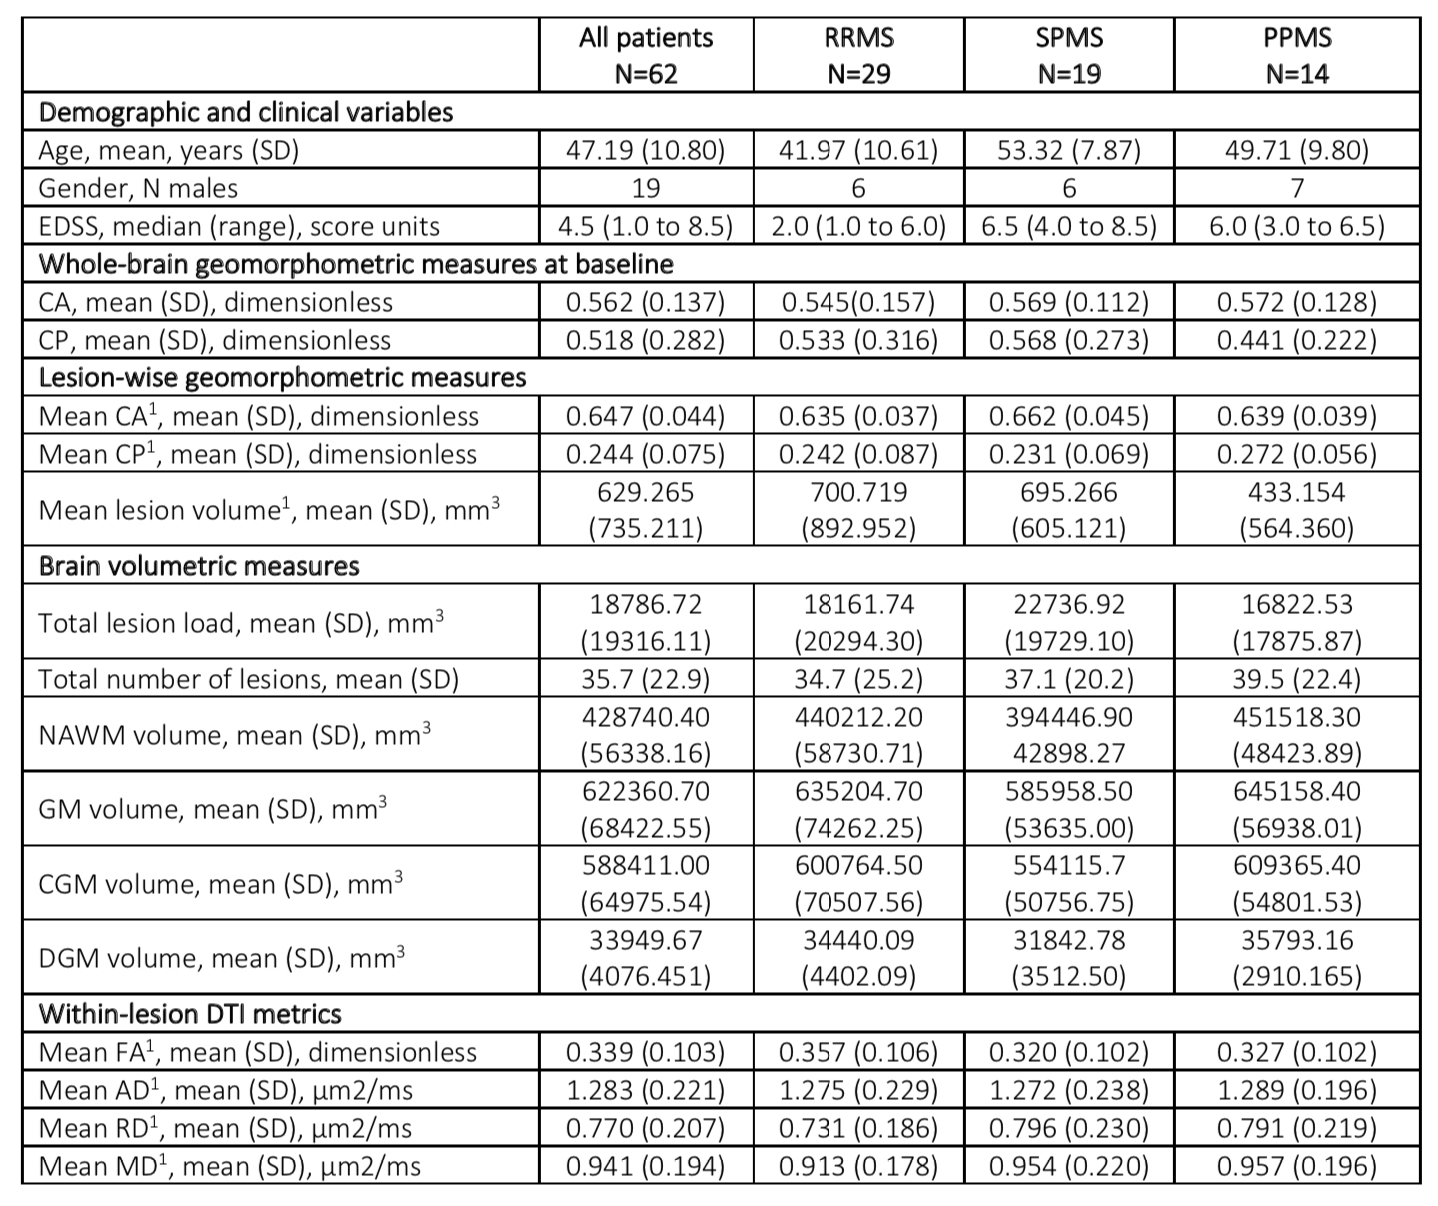
Table 1. Patients’ main characteristics at baseline. 1: Mean across lesions (each patient has a mean value of that metric). In the rest of the table, ‘mean’ refers to the ’sample mean’, i.e. across subjects. Abbreviations: AD: axial diffusivity; CA: covariance anisotropy; CGM: cortical grey matter; CP: covariance planarity; DGM: deep grey matter; DTI: diffusion tensor imaging; EDSS: expanded disability status scale; FA: fractional anisotropy; GM: grey matter; MD: mean diffusivity; N: number; NAWM: normal-appearing white matter; RD: radial diffusivity; SD: standard deviation.