1414
Segmentation of contrast enhancing lesions in multiple sclerosis using deep learning and a large cohort study1Diagnostic and Interventional Imaging, University of Texas Health Science Center at Houston, Houston, TX, United States
Synopsis
Multiple sclerosis (MS), a demyelinating disease of the central nervous system, affects more than two million people worldwide. Contrast enhancing lesions are thought to reflect active disease state and play a key role in MS management. Deep learning (DL) based on convolutional neural networks has reached state-of-art performance on semantic segmentation tasks. Using annotated images for 398 MS patients, we evaluated DL performance on segmentation of enhancing lesions. Our approach yielded Dice similarity coefficient of 0.78, true positive rate of 0.91, and false positive rate of 0.28 for test data. Network performance was excellent for enhancement volumes ≥70 µl.
Introduction
Hyper-intense multiple sclerosis (MS) lesions in the brain white matter are routinely observed on T2-weighted MRI scans. Some of these lesions, thought to reflect active disease state, show enhancement on post-contrast T1-weighted images. The total number/volume of enhancing lesions is commonly used as a secondary outcome measure in clinical trials on MS. It is, therefore, important to automatically segment enhancing lesions. Deep Learning (DL), a subfield of machine learning, can learn features from data without human intervention and has been applied to medical image segmentation tasks with excellent results. In this study we assessed the performance of a modified version of U-net on the segmentation of contrast enhancing lesions using a dataset of 398 MRI image volumes obtained as part of the CombiRx trial.1Methods
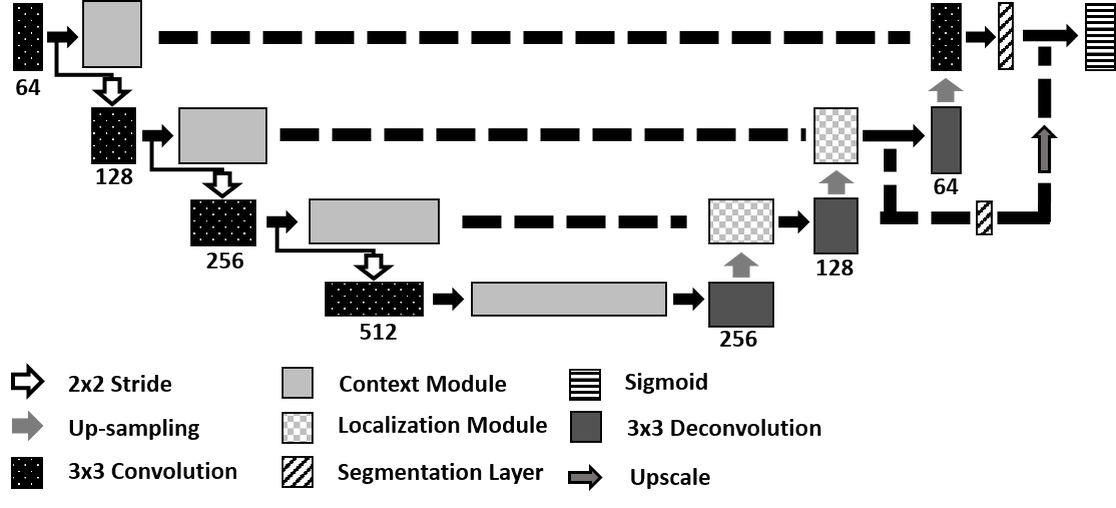
U-net is a fully convolutional neural network composed of multiple convolutional layers arranged in a contracting path, to identify abstract characteristics of the data, and an expanding path to encompass different abstraction levels into a single segmentation map. In this study, we used a 3D U-net (Figure 1) to segment MS contrast enhancing lesions. Multi-parametric MRI volumes comprised of FLAIR, T2-weighted, proton density-weighted, and pre- and post-contrast T1-weighted images served as input to the network for tissue segmentation. The dataset was partitioned into three sets of 278 (70% of scans), 40 (10%), and 80 (20%) samples for training, validation, and testing, respectively. Training was performed for 1000 epochs. The network weights that performed best on the validation data were retained. Optimization was performed using the Adam optimizer with initial learning rate of 10-4, and the weighted Dice coefficient was used as the loss function.2Segmentation quality was assessed using the Dice similarity coefficient (DSC), and lesion true positive (TPR) and false positive (FPR) rates. Lesions which were less than 20 µl were excluded. The network performance was assessed as a function of enhancement volume. For this purpose, the enhancement volumes were divided into six groups: 20-34 µl, 35-69 µl, 70-137 µl, 138-276 µl, 277-499 µl, and ≥500 µl.
All computations were performed on 4 GTX 1080Ti Graphical Processing Units (GPU) in the Maverick2 supercomputer at Texas Advanced Computing Center (TACC). Computing was implemented using Python, and DL algorithms were developed using the Keras library with Tensorflow as backend.3, 4 Performance analysis and data processing used the Nibabel, scikit-image, and scikit-learn libraries.
Results
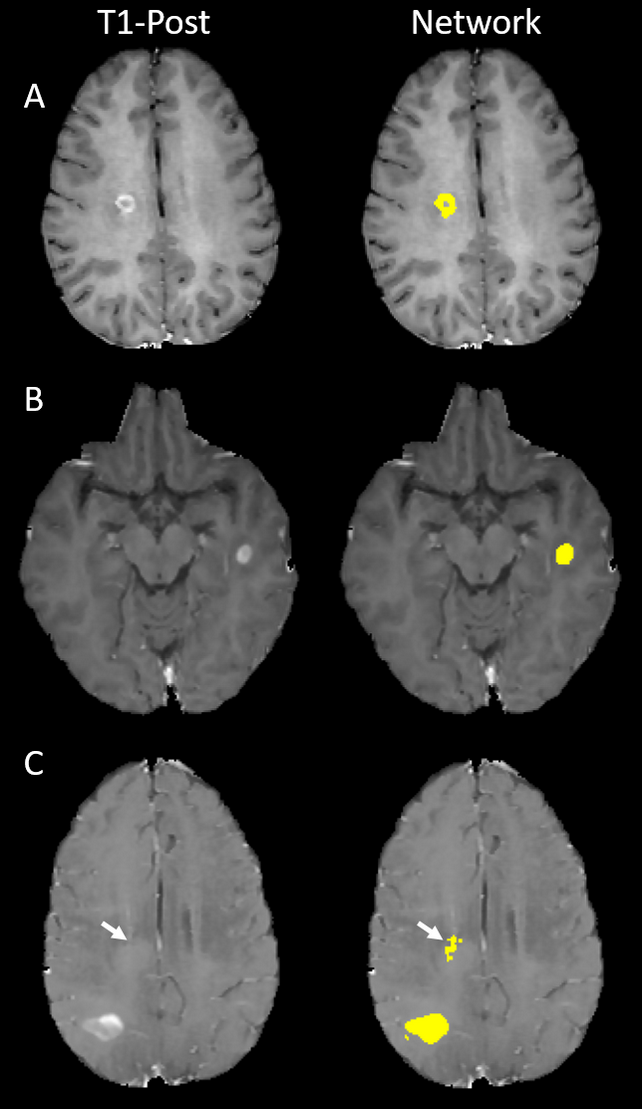
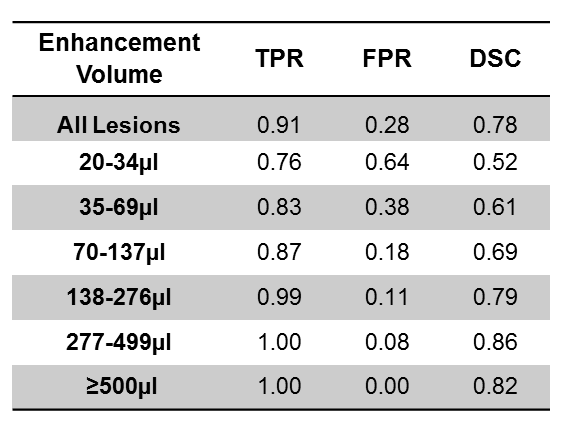
DSC, TPR, and FPR for different lesion volumes are summarized in Table 1. For the largest enhancement, TPR was 1, FPR was 0, and DSC was 0.82. As the enhancement volume decreased, TPR decreased and FPR increased. For the smallest enhancement volume, TPR was 0.76, FPR was 0.64, and DSC was 0.52. All the three performance measures rapidly improved for volumes ≥70 µl. The DSC, TPR, and FPR values averaged over all enhancement volumes were 0.78, 0.91, and 0.28, respectively. Figure 2 shows examples of correct and incorrect segmentation of enhancing lesions using the proposed DL model.Discussion
Application of DL to segment enhancing lesions in MS was investigated using a dataset of 398 MRI brain volumes. Based on the performance measures reported on Table 1, segmentation of enhancements larger than 70 µl is very accurate. This suggests that a DL model consisting of an ensemble of networks with branches specialized on different enhancement volumes may improve the segmentation quality for all lesion sizes.Conclusion
This study demonstrated successful application of DL for the segmentation of gadolinium enhancing lesions in multiple sclerosis patients. Robust segmentation and detection of lesions is observed for enhancing volumes ≥70 µl.Acknowledgements
This work is supported in part by the NIH grant #1R56NS105857-01 and funds from the Biomedical Engineering Chair. We acknowledge Texas Advanced Computing Center, Austin, TX for providing access to the GPU clusters used in this study.References
1. Lublin FD, Cofield SS, Cutter GR, Conwit R, Narayana PA, Nelson F, Salter AR, Gustafson T, Wolinsky JS, CombiRx Investigators. Randomized study combining interferon and glatiramer acetate in multiple sclerosis. Annals of neurology. 2013 Mar;73(3):327-40.
2. Isensee F, Kickingereder P, Wick W, Bendszus M, Maier-Hein KH. Brain tumor segmentation and radiomics survival prediction: Contribution to the brats 2017 challenge. InInternational MICCAI Brainlesion Workshop 2017 Sep 14 (pp. 287-297). Springer, Cham.
3. Chollet F, (2015). Keras. Retrieved from https://github.com/keras-team/keras
4. M. Abadi, B. P. (2016). TensorFlow: A System for Large-Scale Machine Learning. 12th USENIX Symposium on Operating Systems Design and Implementation.
Figures