1412
CNN-based classification of multiple sclerosis using BOLD venographic imaging (SWI) data1Medical Physics Group / IDIR, Jena University Hospital, Jena, Germany, 2Department of Neurology, Medical University of Graz, Graz, Austria, 3Michael Stifel Center for Data-driven Sciences, Friedrich-Schiller-University Jena, Jena, Germany
Synopsis
Convolutional neural network (CNN) was proposed to identify multiple sclerosis patients and healthy subjects while susceptibility-weighted imaging (SWI) was used for MRI scans preprocessing in order to disclose important features hidden in brain venograms. Using only one two-dimensional slice for each subject makes the proposed algorithm easy-applied and useful for clinical practice.
Introduction
Multiple sclerosis (MS) is a disease of the central nervous system characterized by forming lesions representing inflammation and demyelination regions in the brain and spinal cord. Clinicians widely use magnetic resonance imaging (MRI) for diagnosing and monitoring the progress of this disease. Although one can identify the disease pattern on different MR contrasts, expert knowledge and experience are required to diagnose the disease correctly. Nowadays, deep learning algorithms and mainly convolutional neural networks (CNN) show remarkable progress in biomedical image analysis in order to support clinicians in decision-making. Most of these applications using deep learning are aiming to perform automate lesion segmentation based on FLAIR and/or T2-weighted structural MRI. However, lesion patterns can be quite heterogeneous and are not necessarily unique for MS. Additionally, other contrasts like susceptibility-weighted imaging (SWI)1 have shown the potential to differentiate between healthy controls and MS cases, e.g., central veins surrounded by plaques2, iron depositions3, and changes in a venous volume over disease stages4,5. For these reasons, we propose a CNN based algorithm for differentiating between MS patients and healthy volunteers based on susceptibility-weighted images, not requiring any lesion segmentation.Methods
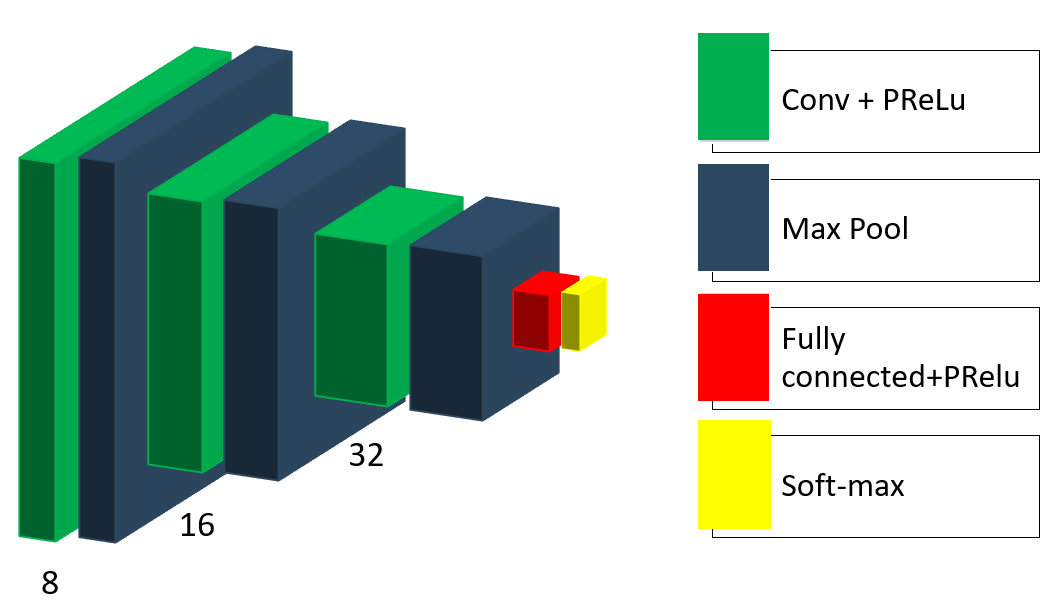
In our study, we collected data from 66 multiple sclerosis patients and 66 healthy subjects. The data was acquired within a bilateral research project (Graz/Jena) on a 3T MRI (Siemens Prisma), using a 20-channel head coil. The acquisition protocol parameters for a T1w multi-echo-gradient echo sequence were as follows: alpha= 35°; TE(1-5)= [8,12; 13,19; 19,26; 24,33; 29,40 ms]; TR= 37 ms, matrix-size= 168x224, FOV= 168x224 mm, slice thickness= 1 mm, number of slices= 192.We propose the following architecture of the neural network with empirically adjusted hyperparameters (Figure 1). The CNN consists of three convolutional layers with parametric rectified linear unit (PReLU) activation functions followed by max-pooling layers. One fully connected layer with PReLU activation and an output layer with soft-max activation complete the structure of the model. Besides, we applied dropout regularization to the output of the last max-pooling layer.
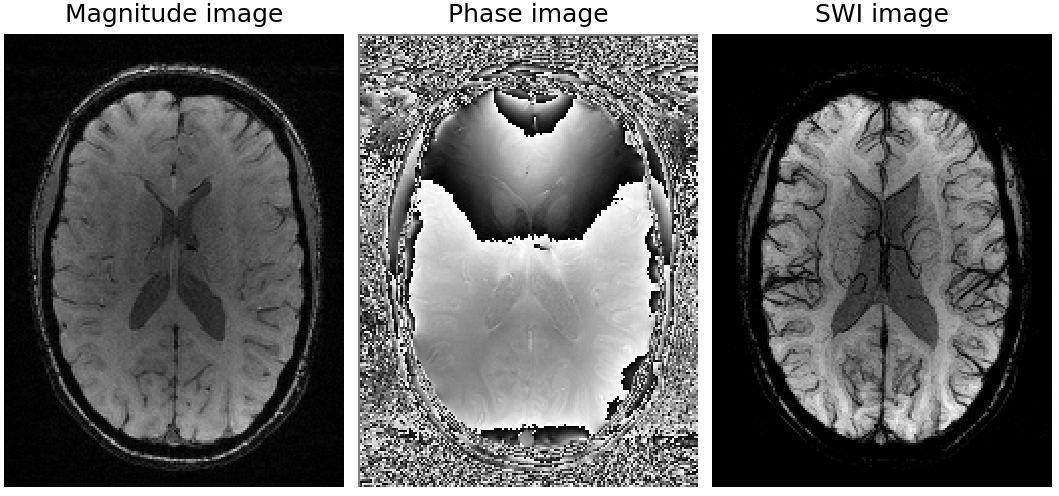
Every scan in the dataset was preprocessed based on the SWI routine (Figure 2), where the original T1-weighted magnitude image was multiplied four times with the phase mask, which in turn was filtered with a kernel size of 128. Next, the minimum intensity projection was computed over 14 slices. All images were standardized on a single-slice basis by normalizing the signal intensity to zero mean and unit variance. Only one two-dimensional transversal slice at a predefined slice position of each subject was used as an input for the CNN.
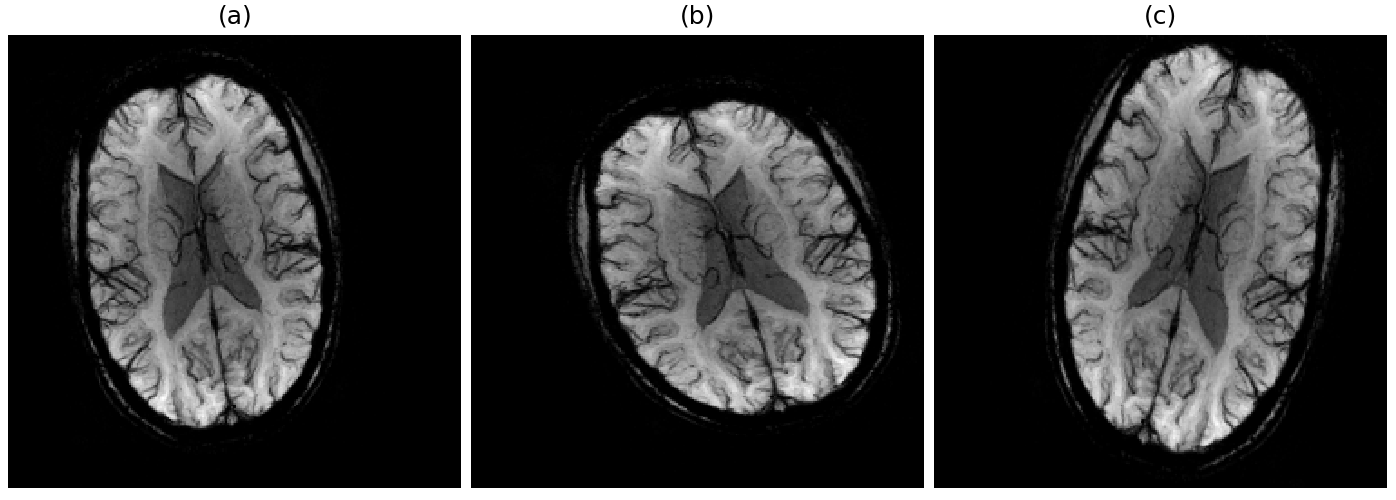
In every iteration of a training epoch, a batch of randomly augmented samples (Figure 3) replaces the corresponding input batch. This in-place augmentation technique was used to avoid overfitting and increase robustness to the new data. We set several data augmentation settings to our data generator, such as image rotation from -20 to 20 degrees, shifting in width range of [0, 20] pixels, and height range of [0, 12] pixels, scaling from 0.7 to 1.0 factor and horizontal flipping. The data generator in our model randomly transforms an image according to the predefined settings.
We employed a hold-out validation to evaluate the performance of the approach. In every experiment, the dataset was randomly split into train and test sets each containing 33 samples per class.
Results
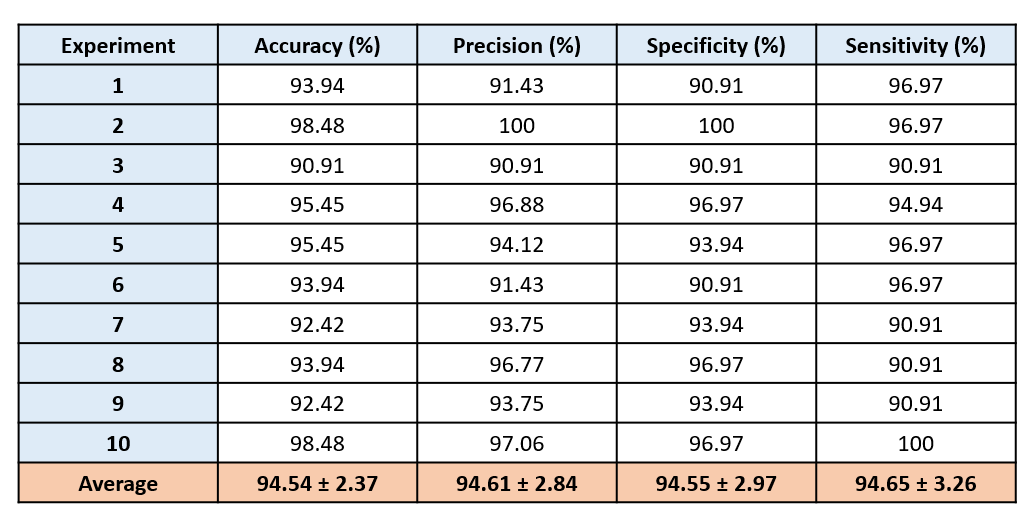
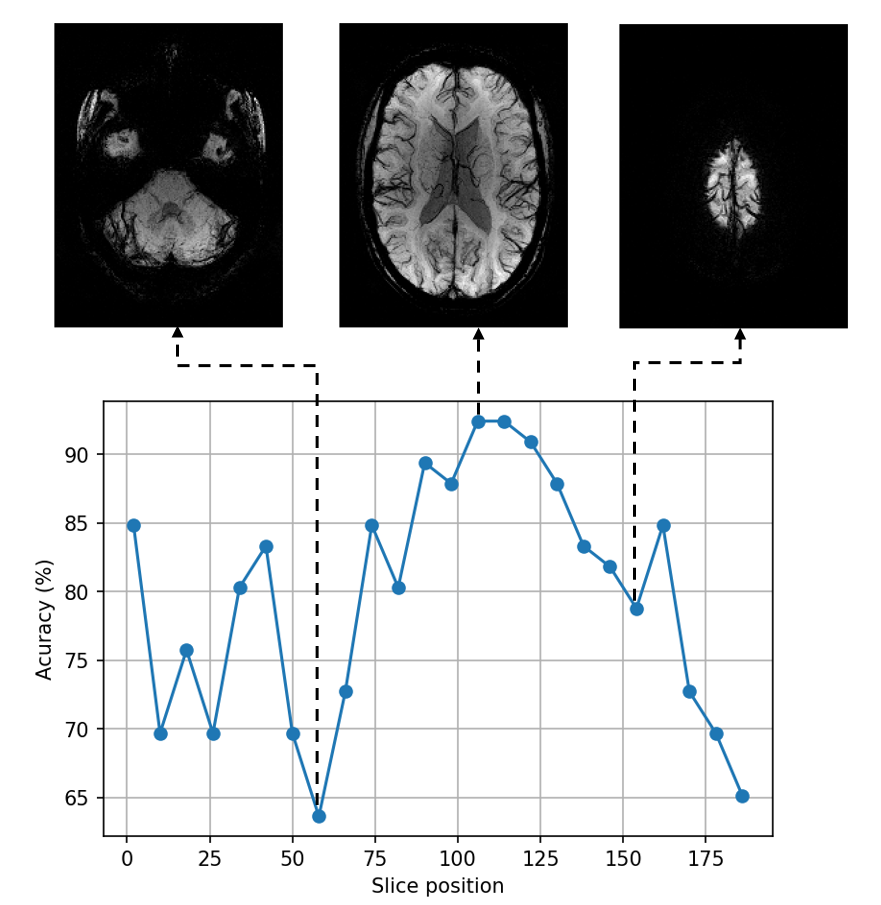
Table 1 shows the results of 10 repetitions of the experiment. The average accuracy is 94.54%, precision is 94.61%, specificity is 94.55%, and sensitivity is 94.65%. In some experiments, an accuracy increases up to 98.48% due to 100% recognition of either MS or healthy class.Figure 4 depicts how slices taken from different transversal positions starting from downwards are affecting the performance of the CNN. These are statistical results of two runs for each slice position. We can observe that there are high fluctuations for slices 1-58. After that, the accuracy curve gradually increases, reaching its maximum value at more than 90% and then decreases to 65%.
Discussion and Conclusion
The proposed algorithm shows results distinct from state-of-the-art CNN-based approaches for MS identification6,7. Although these approaches gained an accuracy of more than 98%, some crucial differences are making it challenging to compare adequately with our method. Thus, we used only one slice for each subject in each training run while Zhang. et al.6 and Wang et al.7 used all the slices associated with lesions and applied different preprocessing methods and image contrasts. Moreover, the proposed CNN has fewer layers preventing our model from overfitting.The results showed that our approach has good potential in MS diagnosis. Data augmentation helps to solve the problem of available data limitation and contributes to a good performance of the neural network. Besides, proper preprocessing reveals the brain venous system that has useful features for distinguishing between MS patients and healthy controls. Using only one slice of MRI scan for disease prediction is close to the current clinical practice. Therefore, the proposed approach might be applied by neuroradiologists as an independent opinion.
In the future, we will continue the research taking into consideration different echo times, number of slices and layers. We would also like to classify not only MS patients and healthy subjects but different MS phenotypes.
Acknowledgements
This study is financially supported by the Carl-Zeiss-Foundation (The project "A Virtual Werkstatt for Digitization in the Sciences"), the German Research Foundation (RE-1123/21-1) as well as the Austrian Science Foundation (FWF I3001-B27).References
1. Reichenbach J.R., Barth M., Haacke E.M., Klarhofer M., Kaiser W.A. and Moser E. High-resolution MR venography at 3.0 Tesla. Journal of Computed Assisted Tomography. 2000; 24(6):949-957.
2. Tan I.L., van Schijndel R.A., Pouwels P.J., van Walderveen M.A., Reichenbach J.R., Manoliu R.A., Barkhof F. MR venography of multiple sclerosis. AJNR Am J Neuroradiol. 2000;21:1039-1042.
3. Haacke E.M., Cheng N.Y., House M.J., Liu Q., Neelavalli J., Ogg R.J., Khan A., Ayaz M., Kirsch W., Obenaus A. Imaging iron stores in the brain using magnetic resonance imaging. Magn Reson Imaging. 2005;23:1-25.
4. Dal-Bianco A., Hametner S., Grabner G., Schernthaner M., Kronnerwetter C., Reitner A., Vass C., Kircher K., Auff E., Leutmezer F., Vass K., Trattnig S. Veins in plaques of multiple sclerosis patients - a longitudinal magnetic resonance imaging study at 7 Tesla. Eur. Radiol. 2015;25(10):2913-2920.
5. Beggs C.B., Shepherd S.J., Dwyer M.G., Polak P., Magnano C., Carl E., Poloni G.U., Weinstock-Guttman B., Zivadinov R. Sensitivity and specificity of SWI venography for detection of cerebral venous alterations in multiple sclerosis. Neurol. Res. 2012;34(8):793-801.
6. Zhang Y-D., Pan C., Sun J., Tang C. Multiple sclerosis identification by convolutional neural network with dropout and parametric ReLU. J. Comput. Sci. 2018;28:1-10.
7. Wang S.-H., Tang C., Sun J., Yang J., Huang C., Phillips P., Zhang Y-D. Multiple sclerosis identification by 14-layer convolutional neural network with batch normalization, dropout, and stochastic pooling. Front. Neurosci. 2018;12:818.
Figures