1411
Pediatric-Onset Multiple Sclerosis: Imaging with Focus on Posterior Fossa Involvement1Neuroscience Department, Bilkent University, Ankara, Turkey, 2National Magnetic Resonance Research Center (UMRAM), Bilkent University, Ankara, Turkey, 3Faculty of Medicine, Pediatric Neurology, Hacettepe University, Ankara, Turkey, 4Faculty of Medicine, Department of Radiology, Hacettepe University, Ankara, Turkey
Synopsis
Pediatric-onset-Multiple-Sclerosis (POMS) has been reported to have larger and higher number of T2 lesions as with more frequent posterior fossa involvement compared to adults. We aimed to analyze POMS patients morphological, microstructural alterations and their correlates with clinical characteristics with emphasis on posterior system. SUIT,Freesurfer and TBSS were used for spatialized parcellation, and analysis. Cerebellum except paramedian structures and cerebral cortices showed volume reductions, cerebral white matter and midbrain showed reduced FA and increased MD,AD,RD. Total and periventricular lesion loads, thalamic volumes showed correlations with special clinical metrics. Multiparametric brain MRI may reveal information on tissue changes and clinical correlates.
Introduction
Reports state more frequent relapses with faster recovery and more extensive axonal injury1,2, larger and higher total number of T2 lesions, more frequent posterior fossa involvement in first brain MRI at diagnosis in pediatric-onset Multiple Sclerosis (POMS) compared to adults3. Lesion load measures poorly correlate with the extent of the disease and clinical status. We aimed to analyze images in POMS patients to search for morphological, microstructural alterations and their correlates with clinical characteristics. Because of reportedly more frequent lesions, we focused more on posterior fossa involvement in POMS.Methods
The study protocol was approved by IRB and all participants gave informed consent.Subjects
Twenty-two patients with POMS and 19 healthy controls(HCs)(M/F; 5/17, 3/16; Mean age+-SD; 18.04+- 1.83 and 16.47+- 2.58 respectively; p>0.05) participated in the study. Demographic and clinical features including disease onset age, duration of the disease, number of total episodes, episodes related to sensory, motor, brainstem and cerebellar symptoms, and Expanded Disability Status Scale (EDSS) score of the patients at the time of imaging were documented.
Image Acquisition
All participants underwent MR imaging on 1.5 T scanner (Achieva, Philips, Netherlands). Imaging protocol included structural 3D T1-weighted, 3D FLAIR imaging and diffusion tensor imaging (DTI) of the whole brain obtained in 32 independent directions.
Data Processing and Analysis
Hyperintense lesion load volumes (cm3) were calculated using volBRain(4,5) for periventricular, juxtacortical and deep white matter from 3D FLAIR images. Additionally, we drew the lesions in the cerebellum and brainstem manually and calculated their volumes using FSL-Maths6.
Then, structural analyses were performed using Freesurfer image analysis package version 6.0.0 Preprocessing steps included removal of non-brain tissue, subcortical segmentation7 and identification of white matter/gray matter boundary based on cortical reconstruction and volumetric parcellation. Cortex was then registered to Desikan Killiany Atlas and parcelled into volumetric units, automatically parcellated and combined to create average volume for total gray matter (GM) and lobar regions. Significant differences in whole brain volume were compared for the patients and HCs using GLM embedded in the QDEC (Query, Design, Estimate, and Contrast) interface of Freesurfer v6.0.0, the cluster-corrected significance level was set to 5% and Monte Carlo null hypothesis simulations were applied. Cerebellar segmentation and related volume measurement was performed using a spatially unbiased infra-tentorial template (SUIT)8.
We used tract-based spatial statistics (TBSS)9 included in the FSL v.6.0 package for voxelwise whole-brain DTI. After preprocessing of the diffusion-weighted data, diffusion tensor fitting (FSL DTIFit), and calculation of FA, MD, AD, RD maps, FA maps were registered and aligned to the average space as input for TBSS, and the mean FA skeleton was computed. A permutation-based inference with 500 permutations was performed for voxel-wise statistics on FA. Threshold-free cluster enhancement output was obtained and corrected for multiple comparisons. Family-wise error (FWE)-corrected maps were obtained with P-values <0.05. Cluster-based thresholding was performed, which included Gaussian smoothing, application of a threshold (t: 1.5), and forming clusters from 26 neighboring suprathreshold voxels.
Statistical analysis for group differences and correlation of imaging data with clinical parameters was performed using SPSS v.17.0 for Windows.
Results
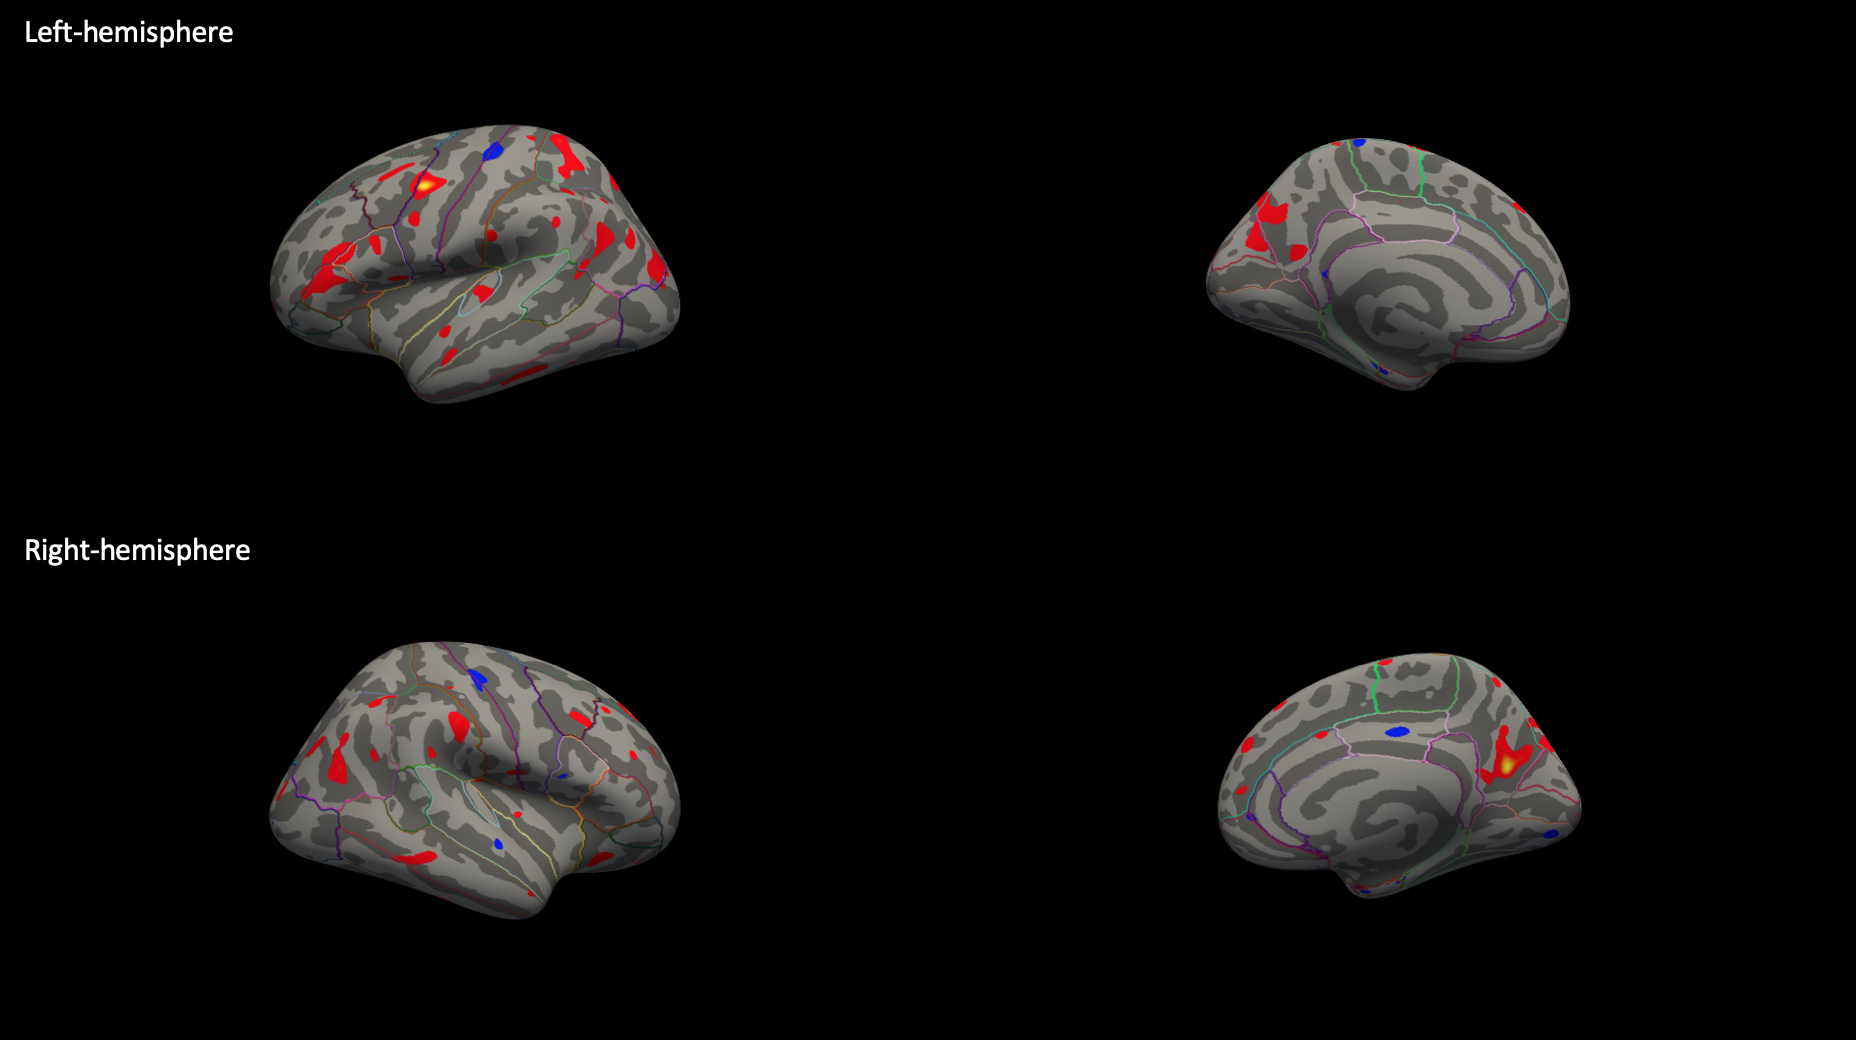
Structural ChangesAs compared with HCs, patients showed significantly reduced volumes in bilateral thalamus, and central-mid-anterior segments of the corpus callosum. There were also extensive reductions in hemispheric cortical volume at p of <0.05 as displayed on 3D surface –rendered inflated maps (Figure1).
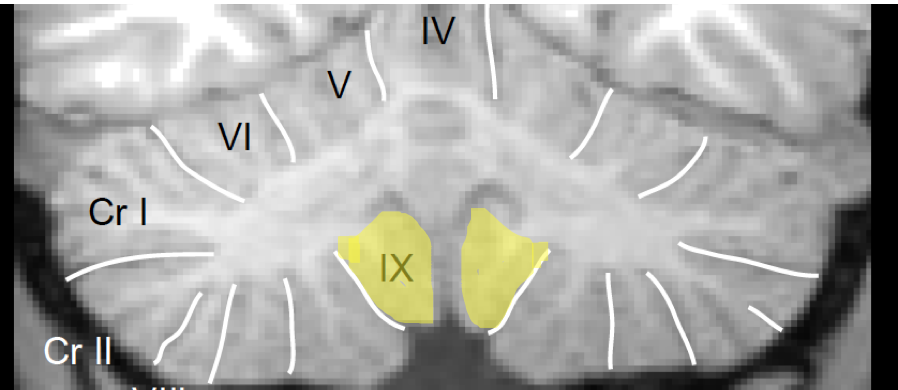
SPM-SUIT revealed that 23 of totally 28 regions of the cerebellum and vermis showed statistically significant reduced volumes in the patients. Areas without cerebellar volume reduction were mainly the paramedian cerebellar structures (Figure2).
Lesion Burden and Correlations with Morphometric Changes and Clinical Metrics
Total and particularly periventricular lesion load showed positive correlation with duration of disease (p=0.01 and p=0.001 respectively), and negative correlation with disease-onset age (p=0.01 for both) and positively correlated with EDSS (0.024 and p=0.018). Deep WM lesions had a significant positive correlation with events related to brainstem (p=0.026), infratentorial lesions with number of motor episodes (p=0.016). Juxtacortical lesion loads did not reveal any correlation with clinical findings (p>0.05). EDSS itself had correlation with cerebellar tests abnormality (p=0.00) and periventricular lesion load (p=0.018).
Total or compartmental lesion loads did not have any correlation with corpus callosum and thalamus volumes (p>0.05). However, thalamus volumes showed negative correlations with number of demyelinating episodes (p=0.005) and number of sensory episodes (p=0.01).
Whole-brain DTI/TBSS
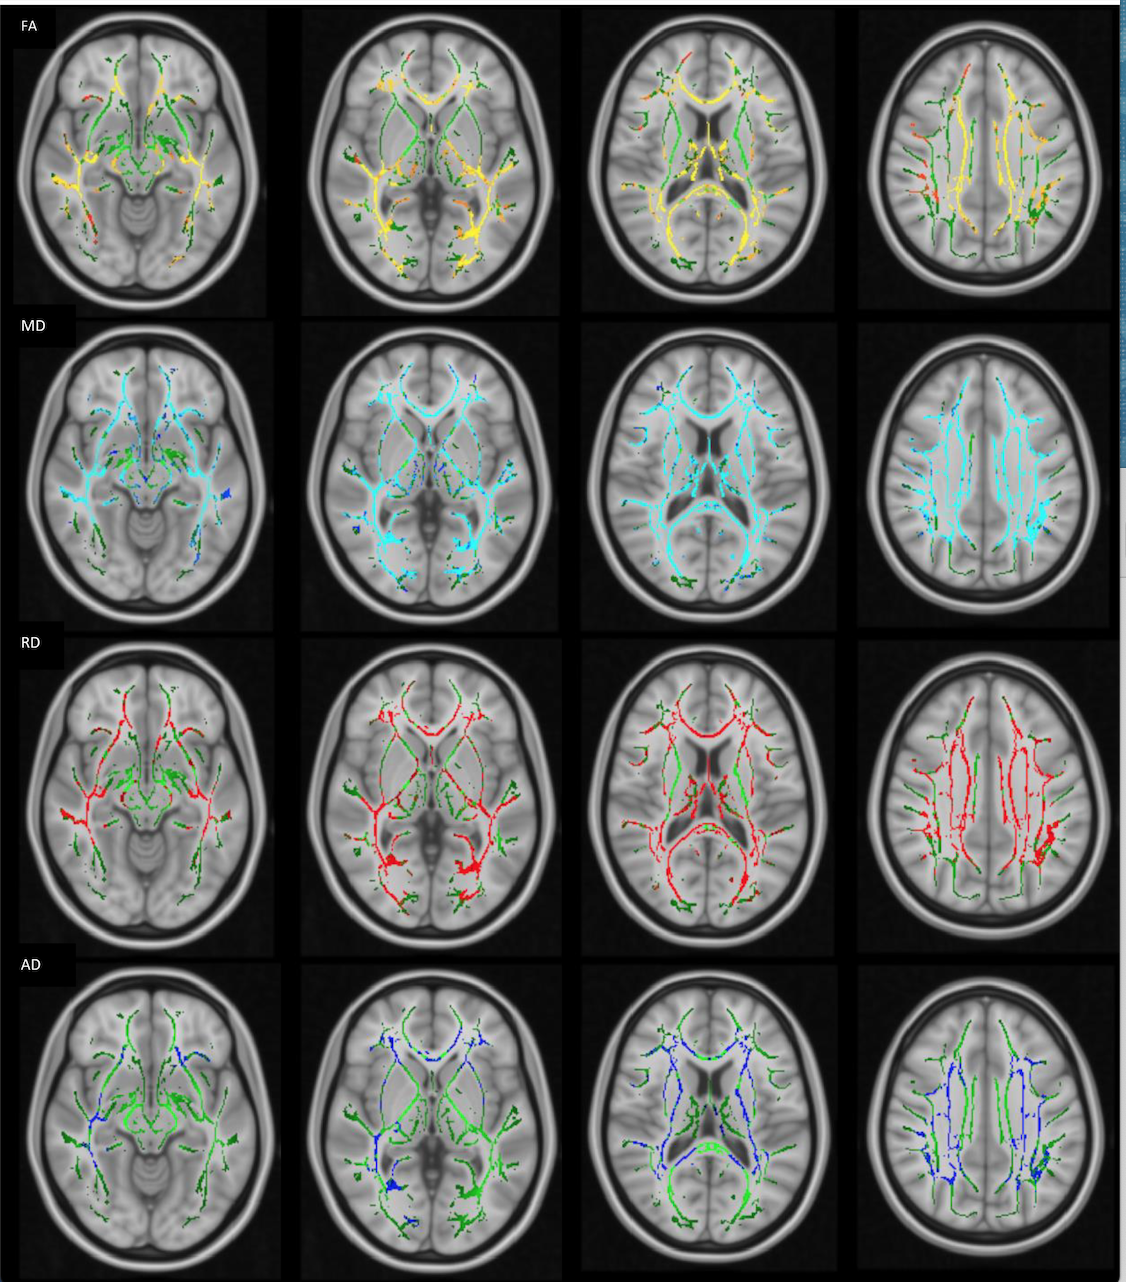
TBSS maps revealed widespread reduction in FA and increase in MD, RD and AD values prominent in the corpus callosum, internal-external capsules, superior longitudinal fascicles, optic radiations. Surprisingly there was no detected significant voxel in the cerebellum, and cerebral peduncles including corticospinal tracts showed similar changes (Figure3).
Conclusion
Compared to HC, POMS patients showed widespread volume reduction in the cerebellum, cerebral cortex and both thalami and anterior corpus callosum. Lesion loads, mostly periventricular lesions had positive correlation with duration of the disease and EDSS, and decreased volume of thalami was related to total number of demyelinating episodes and sensory events. Detailed multiparametric imaging analysis of posterior fossa involvement is necessary to reveal distinct clinical course, thus in turn more effective treatment in POMS patientsAcknowledgements
No acknowledgement found.References
- Belman AL et al. Characteristics of Children and Adolescents With Multiple Sclerosis. Pediatrics. 2016 Jul;138(1). pii: e20160120. doi: 10.1542/peds.2016-0120.
- Benson LA et al. Elevated relapse rates in pediatric compared to adult MS persist for at least 6 years. Mult Scler Relat Disord. 2014 Mar;3(2):186-93. doi: 10.1016/j.msard.2013.06.004.
- Waubant E et al. Difference in disease burden and activity in pediatric patients on brain magnetic resonance imaging at time of multiple sclerosis onset vs adults. Arch Neurol. 2009 Aug;66(8):967-71.
- Floriana De Angelis et al., New MS diagnostic criteria in practice. Practical Neurology, 2019; http://dx.doi.org/10.1136/practneurol-2018-001945
- volBrain. Automated MRI Brain volumetry system (http://volbrain.upv.es)
- Centre for Functional MR Imaging of the Brain, Oxford University, Oxford, UK, http://www.fmrib.ox.ac.uk/fsl).
- Fischl B, Salat DH, Busa E, Albert M, Dieterich M, Haselgrove C, et al. Whole brain segmentation: automated labeling of neuroanatomical structures in the human brain. Neuron 2002;33:341–55.
- A Spatially Unbiased Atlas fort he Cerebellum and Brainstem (SUIT). http://www.diedrichsenlab.org/imaging/suit.htm
- Smith SM, Jenkinson M, Johansen-Berg H, Rueckert D, Nichols TE, Mackay CE, Watkins KE, Ciccarelli O, Cader MZ, Matthews PM, Behrens TE. Tract-based spatial statistics: voxelwise analysis of multi-subject diffusion data. Neuroimage. 2006 Jul 15;31(4):1487-505.
Figures