1408
Microstructure changes in secondary progressive multiple sclerosis measured using advanced quantitative MRI of the brain and spine1NMR Research Unit, UCL Queen Square MS Centre, Queen Square Institute of Neurology, Faculty of Brain Sciences, University College London, London, United Kingdom, 2Neurology Department, , Luton and Dunstable University Hospital, Luton, United Kingdom, 3Centre for Medical Image Computing, Department of Computer Science, University College London, London, United Kingdom, 4Philips Healthcare, Guilford, United Kingdom, 5IRCCS Mondino Foundation, Pavia, Italy, 6Centre for Medical Image Computing, Medical Physics and Biomedical Engineering, University College London, London, United Kingdom, 7Universitat Oberta de Catalunya, Barcelona, Spain, 8Department of Brain and Behavioural Sciences, University of Pavia, Pavia, Italy, 9Brain MRI 3T Center, IRCCS Mondino Foundation, Pavia, Italy
Synopsis
Multiple Sclerosis (MS) is a complex disease whose mechanisms of progression still remain unclear. The use of quantitative MRI techniques in a multi-modal fashion, i.e. acquisition of more than one contrast type, can help to non-invasively measure changes in the tissue at a microstructural level during the disease course. Moreover, evidence of spinal cord involvement and its role in the diagnosis and prognosis is mounting. Here, we aim to address both needs by developing a multi-modal qMRI protocol for joint investigation of brain and spinal cord microstructure, and we report findings from a small cohort of people with MS.
Introduction
Multiple sclerosis (MS) is an inflammatory and neurodegenerative disease involving both brain and spinal cord. There is evidence that quantitative (q)MRI techniques can correlate with clinical scores and patient disability better than conventional qualitative MRI1,2, due to their increased sensitivity to key pathological processes (i.e. axonal loss, de-myelination and inflammation). One example is the g-ratio index3, where quantitative parameters obtained from different modalities (e.g. diffusion-weighted and magnetization transfer imaging), are combined into a single metric designed to be specific to de-myelination4.Despite the promise of providing accurate and absolute quantification of relevant biophysical tissue properties, qMRI parameters still retain, to a variable extent, dependency on the way data are acquired5, and processed6, which overall limit their value and practical utility7.
In this study, we present a unified approach for multi-modal qMRI to study MS, which makes use only of single-shot spin-echo (ssh-SE-)EPI sequences. By matching a fundamental part of the data acquisition across different modalities, we aim to minimize errors propagations throughout the processing pipeline when computing quantitative parameters, such as the g-ratio. Moreover, we extend the approach to the spinal cord by using a reduced field-of-view (rFOV) version of the same sequences used in the brain8, to enable the investigation of the same quantitative parameters, simultaneously in the brain and in the spinal cord.
We report evidence from a cohort of secondary progressive MS (SPMS) patients and healthy controls.
Methods
A cohort of four SPMS patients (3F, 53(41-61) years, EDSS=5.5(4-6.5)) and eight healthy controls (3F, 50.8(44-60) years) underwent the MRI protocol described in table 1, using a 3T Philips Ingenia CX scanner (Best, The Netherlands) and a 32-channel receive coil. The protocol consists of a series of quantitative techniques (diffusion-weighted imaging, magnetization transfer imaging and relaxometry imaging), based entirely on ssh-SE-EPI readouts, and encompassing both brain and spinal cord acquisition.The quantitative data acquired underwent the processing pipeline9,10 outlined in figure 1. Automatic tissue type (and lesion) segmentation (with threshold >0.9) was performed on the anatomical scans (using BAMOS/GIF11,12 methods for the brain, and the spinal cord toolbox13 for the cord), and registered to the quantitative maps.
Differences between controls and patients were investigated for a set of quantitative parameters in (normal appearing) white matter ((NA)WM), (normal appearing) grey matter ((NA)GM), and lesions (LES) region-of-interests (ROIs) for both brain and spinal cord. The following parameters were considered: longitudinal relaxation time (T1), bound pool fraction (BPF), intracellular volume fraction (ICF) from multi-compartment SMT14, orientation dispersion index (ODI) from NODDI15, fractional anisotropy (FA), and mean diffusivity (MD) from DTI. Additionally, a g-ratio-weighted index was calculated in brain and spinal cord WM, by combining BPF and ICF as: $$g=\sqrt{\frac{1}{1+\frac{BPF}{ICF}}}$$
Results
Quantitative metrics show alterations in lesions, when compared to the surrounding NA tissues, as depicted in figure 2. This trend is visible both in the brain and in the spinal cord, and consistent within the two structures (e.g. BPF, ICF and FA decreases, T1 and MD increases, when comparing LES to NAWM, both for brain and spinal cord).The comparison of the same quantitative parameters across structures (i.e. brain vs. spinal cord) highlights some differences: T1 and FA are systematically higher in the spinal cord compared to the brain (mean T1 in WM(NAWM)=895.7(923.5)ms for the brain, 1212.3(1280.7)ms for the spinal cord; mean FA in WM(NAWM)=0.429(0.398) for the brain, 0.576(0.491) for the spinal cord), while BPF and ODI are lower in the spinal cord compared to the brain (mean BPF in WM(NAWM)=0.108(0.104) for the brain, 0.062(0.062) for the spinal cord; mean ODI in WM(NAWM)=0.238(0.245) for the brain, 0.135(0.175) for the spinal cord).
When looking at changes in LES, similar trends are observed in brain and spinal cord, although with some subtle differences: for example BPF decreases less in the cord compared to the brain, while the opposite is true for T1 (figure 3).
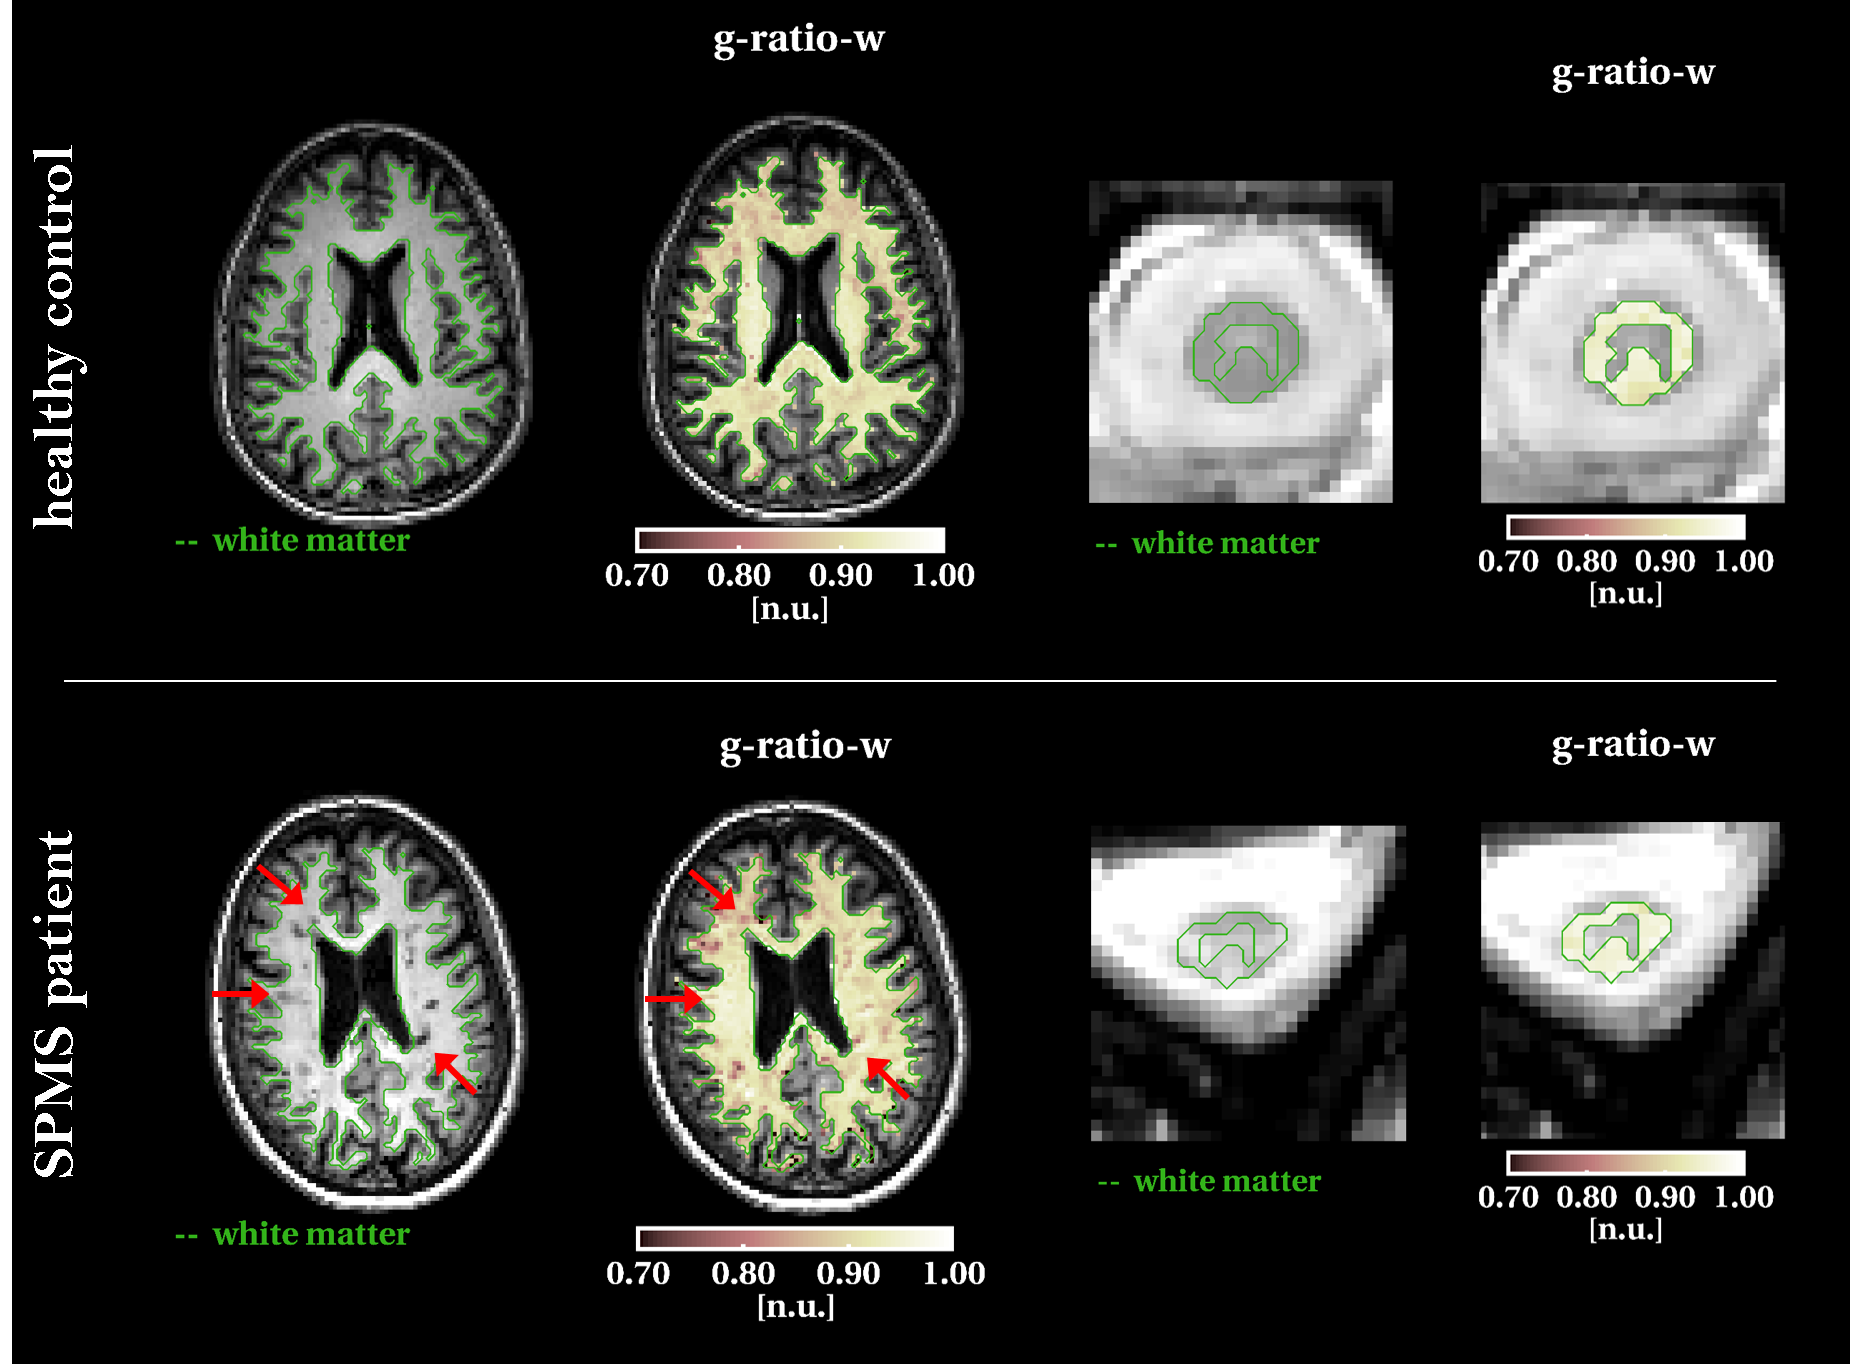
Example g-ratio-weighted maps for brain and spinal cord are shown in figure 4, for one MS case and one healthy subject. In the SPMS case, the g-ratio-weighted map appears more heterogeneous throughout the WM, with only some of the lesions clearly visible.
Discussion and Conclusion
In this study we have investigated how qMRI parameters change in SPMS, by imaging a cohort of patients and age-matched controls with a novel multi-modal qMRI protocol.The unique features of this approach are: (i) the use of a unified readout for the acquisition of different contrasts, (ii) the inclusion of a dedicated set of quantitative scans for the spinal cord, based on the same readout.
In such a way, the same parameters can be obtained for brain and spinal cord within the same session, and with minimal differences in terms of acquisition sequence and processing. Moreover, promising combined metrics, such as a g-ratio-weighted index, can be obtained without having to deal with different distortions and noise levels among different modalities.
These parameters are expected to provide a better insight into the mechanisms underlying tissue damage in MS, and the joint analysis of brain and spinal cord may highlight key areas that drive disease progression. Results presented here are, indeed, the initial evidence of a larger study where we aim to understand the microstructural changes that cause progression in MS.
Acknowledgements
This project is funded by the UK Multiple Sclerosis Society (grant 77/2017). Acknowledgements to the UCL-UCLH Biomedical Research Centre for ongoing funding; the European Union’s Horizon 2020 research and innovation programme under grant agreement No. 63454; the Engineering and Physical Sciences Research Council (EPSRC EP/R006032/1, M020533/1); Spinal Research (UK), Wings for Life (Austria), Craig H. Neilsen Foundation (USA) (jointly funding the INSPIRED study); Wings for Life (#169111), and Guarantors of Brain.References
1. Harrison D., Shiee M., Bazin N., et al. Tract-specific quantitative MRI better correlates with disability than conventional MRI in multiple sclerosis. Journal of neurology 2013; 260(2):397-406.
2. Levesque I. R., Giacomini P. S., Narayanan S., et al. Quantitative magnetization transfer and myelin water imaging of the evolution of acute multiple sclerosis lesions. Magnetic resonance in medicine 2010; 63(3):633-640.
3. Stikov N., Campbell J. S., Stroh T., et al. In vivo histology of the myelin g-ratio with magnetic resonance imaging. Neuroimage 2015; 118:397-405.
4. Cercignani M., Bouyagoub S. Brain microstructure by multi-modal MRI: Is the whole greater than the sum of its parts?. Neuroimage 2018; 182:117-127.
5. Stikov N., Boudreau M., Levesque I. R., et al. On the accuracy of T1 mapping: searching for common ground. Magnetic resonance in medicine 2015; 73(2):514-522.
6. Papinutto N. D., Maule F., Jovicich J. Reproducibility and biases in high field brain diffusion MRI: An evaluation of acquisition and analysis variables. Magnetic resonance imaging 2013; 31(6):827-839.
7. Campbell J.S., Leppert I. R., Narayanan S., et al. Promise and pitfalls of g-ratio estimation with MRI. Neuroimage 2018; 182:80-96.
8 . Wheeler-Kingshott C. A., Hickman S. J., Parker G. J., et al. Investigating cervical spinal cord structure using axial diffusion tensor imaging. Neuroimage 2002;16(1), 93-102.
9. Veraart J., Novikov D. S., Christiaens D., et al. Denoising of diffusion MRI using random matrix theory. NeuroImage 2016; 142:394-406.
10. Kellner E., Dhital B., Kiselev V.G., et al. Gibbs‐ringing artifact removal based on local subvoxel‐shifts. Magnetic resonance in medicine 2016;76(5):1574-1581.
11. Sudre C., Cardoso M. J., Bouvy W. H., et al. Bayesian model selection for pathological neuroimaging data applied to white matter lesion segmentation. IEEE transactions on medical imaging 2015; 34(10): 2079-2102.
12. Cardoso M. J., Modat M., Wolz R., et al. Geodesic information flows: spatially-variant graphs and their application to segmentation and fusion. IEEE transactions on medical imaging 2015; 34(9):1976-1988.
13. De Leener B., Lévy S., Dupont S.M., et al. SCT: Spinal Cord Toolbox, an open-source software for processing spinal cord MRI data. NeuroImage 2017; 145(Pt A): 24-43
14. Kaden E., Kelm N. D., Carson, R. P., et al. Multi-compartment microscopic diffusion imaging. NeuroImage 2016;139:346-359.
15. Zhang H., Schneider T., Wheeler-Kingshott C. A., et al. NODDI: practical in vivo neurite orientation dispersion and density imaging of the human brain. Neuroimage 2012; 61(4):1000-1016.
Figures
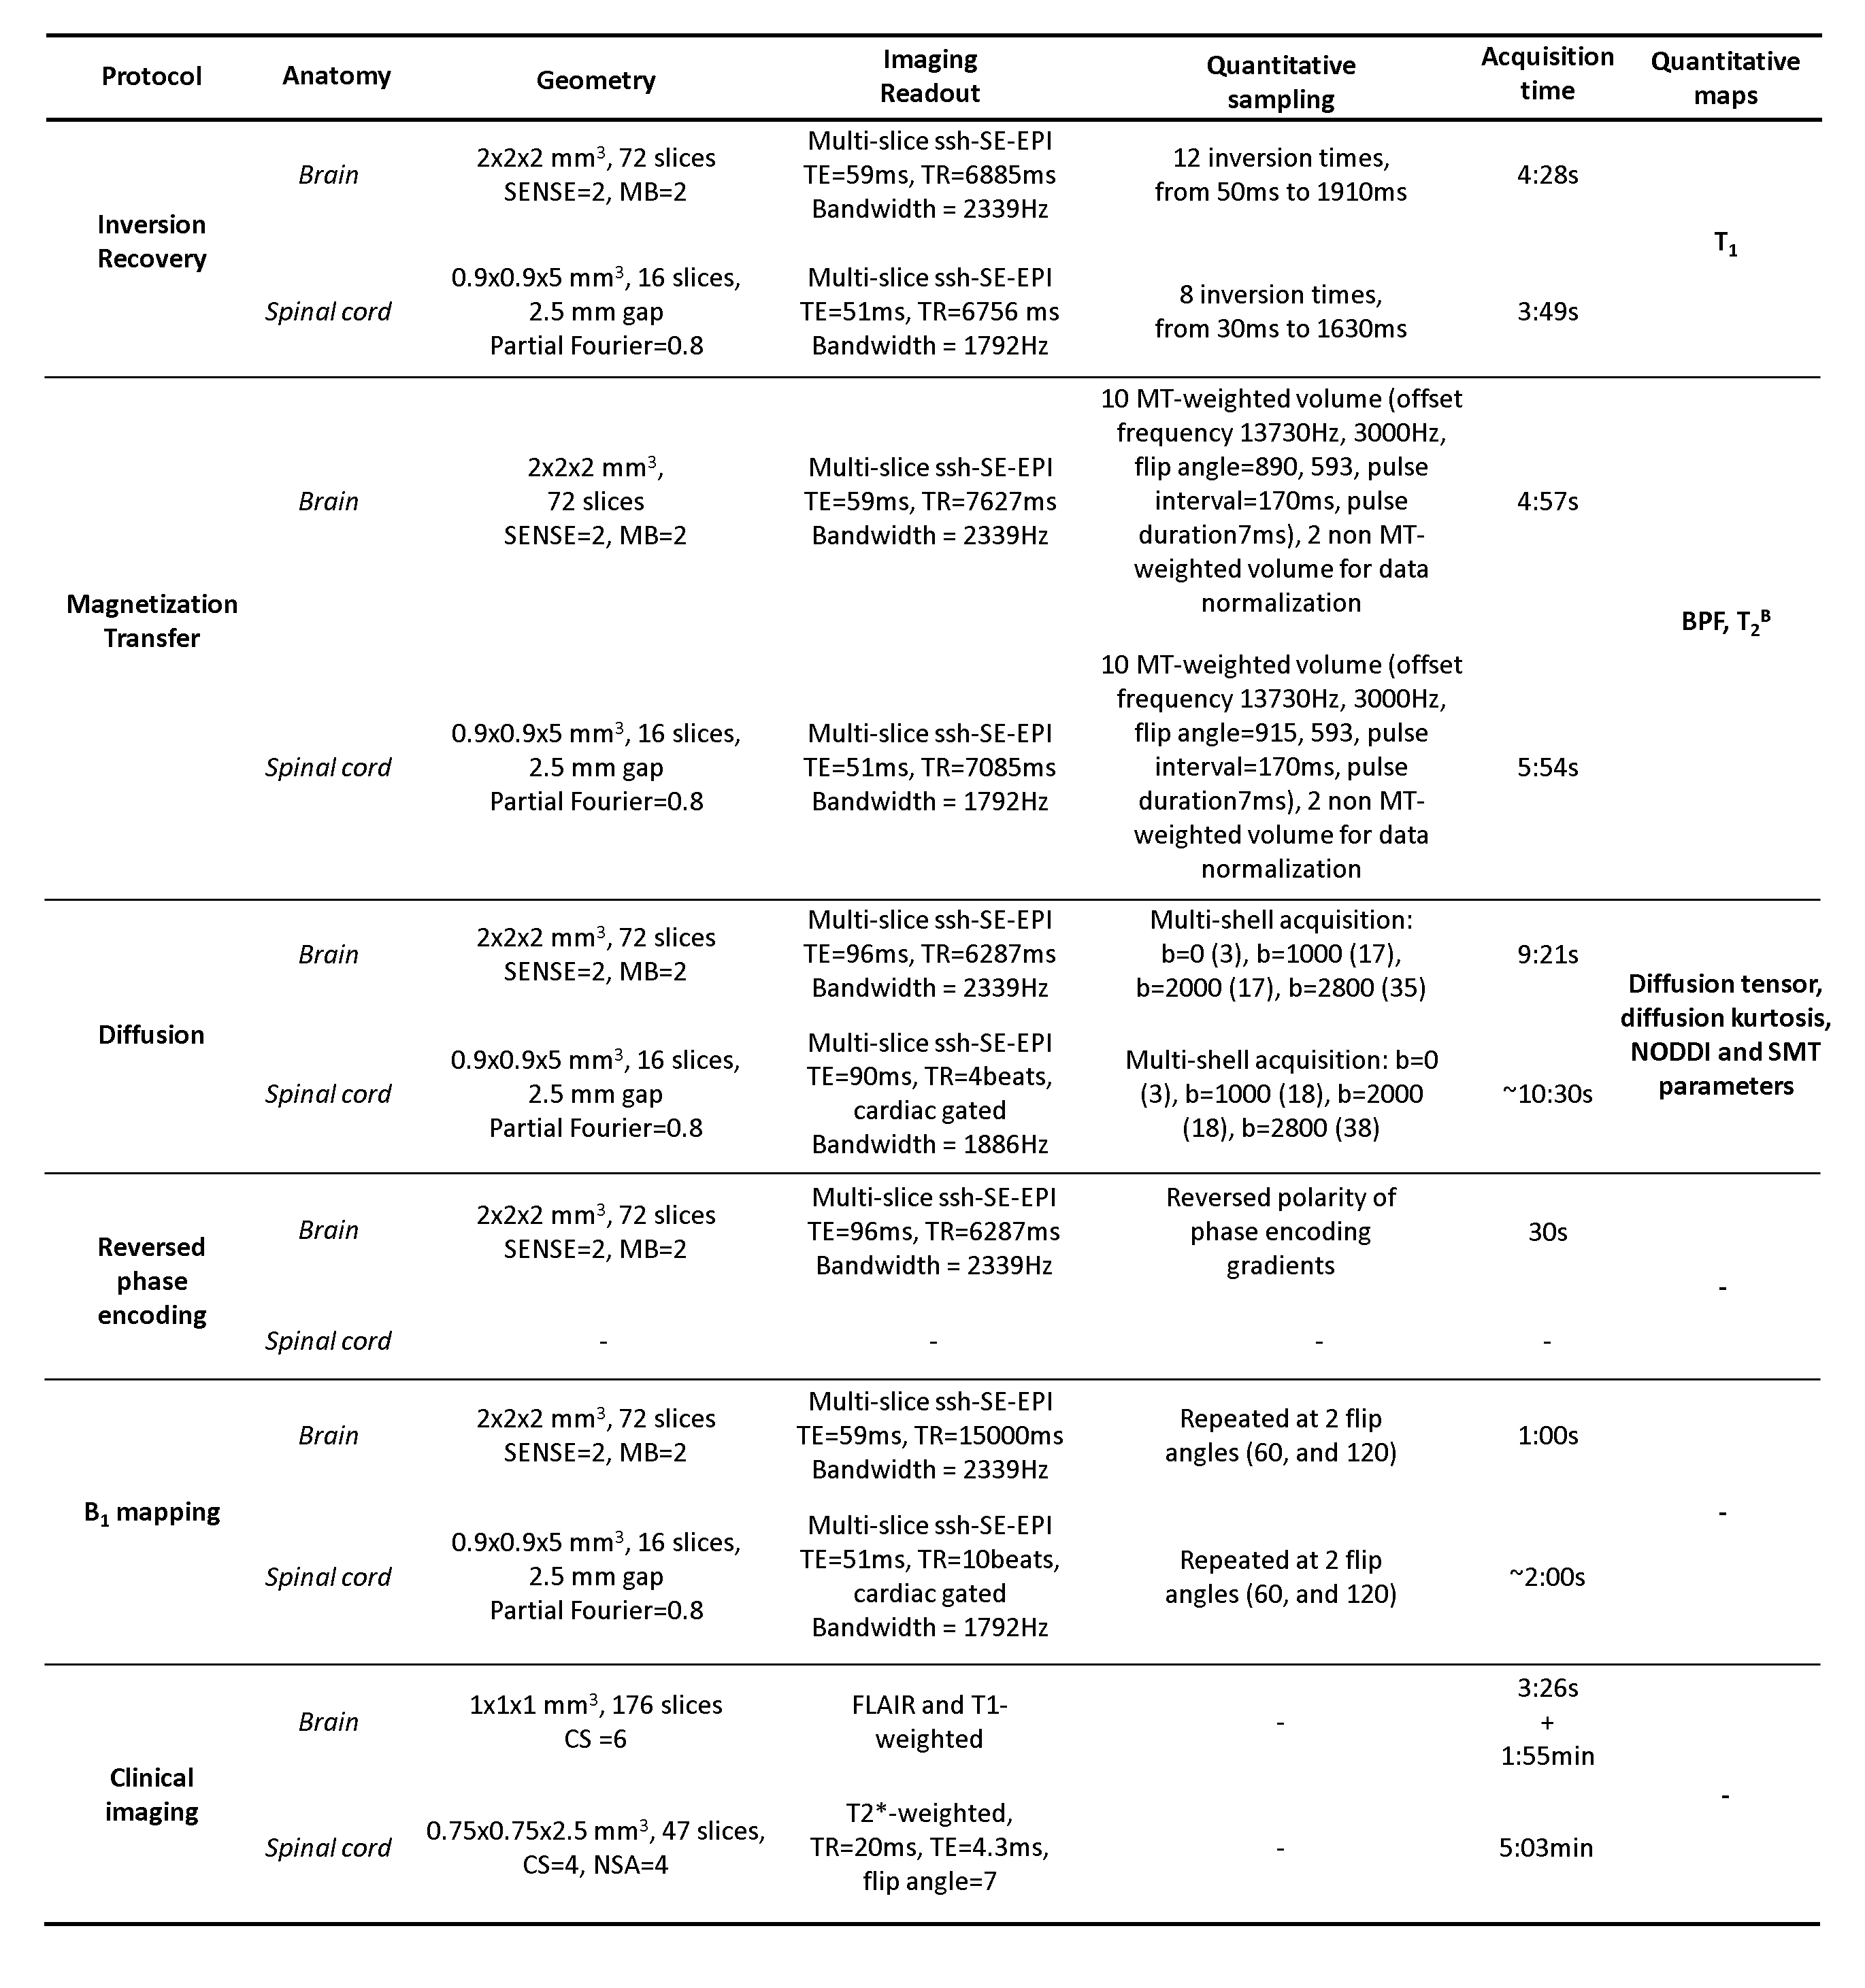
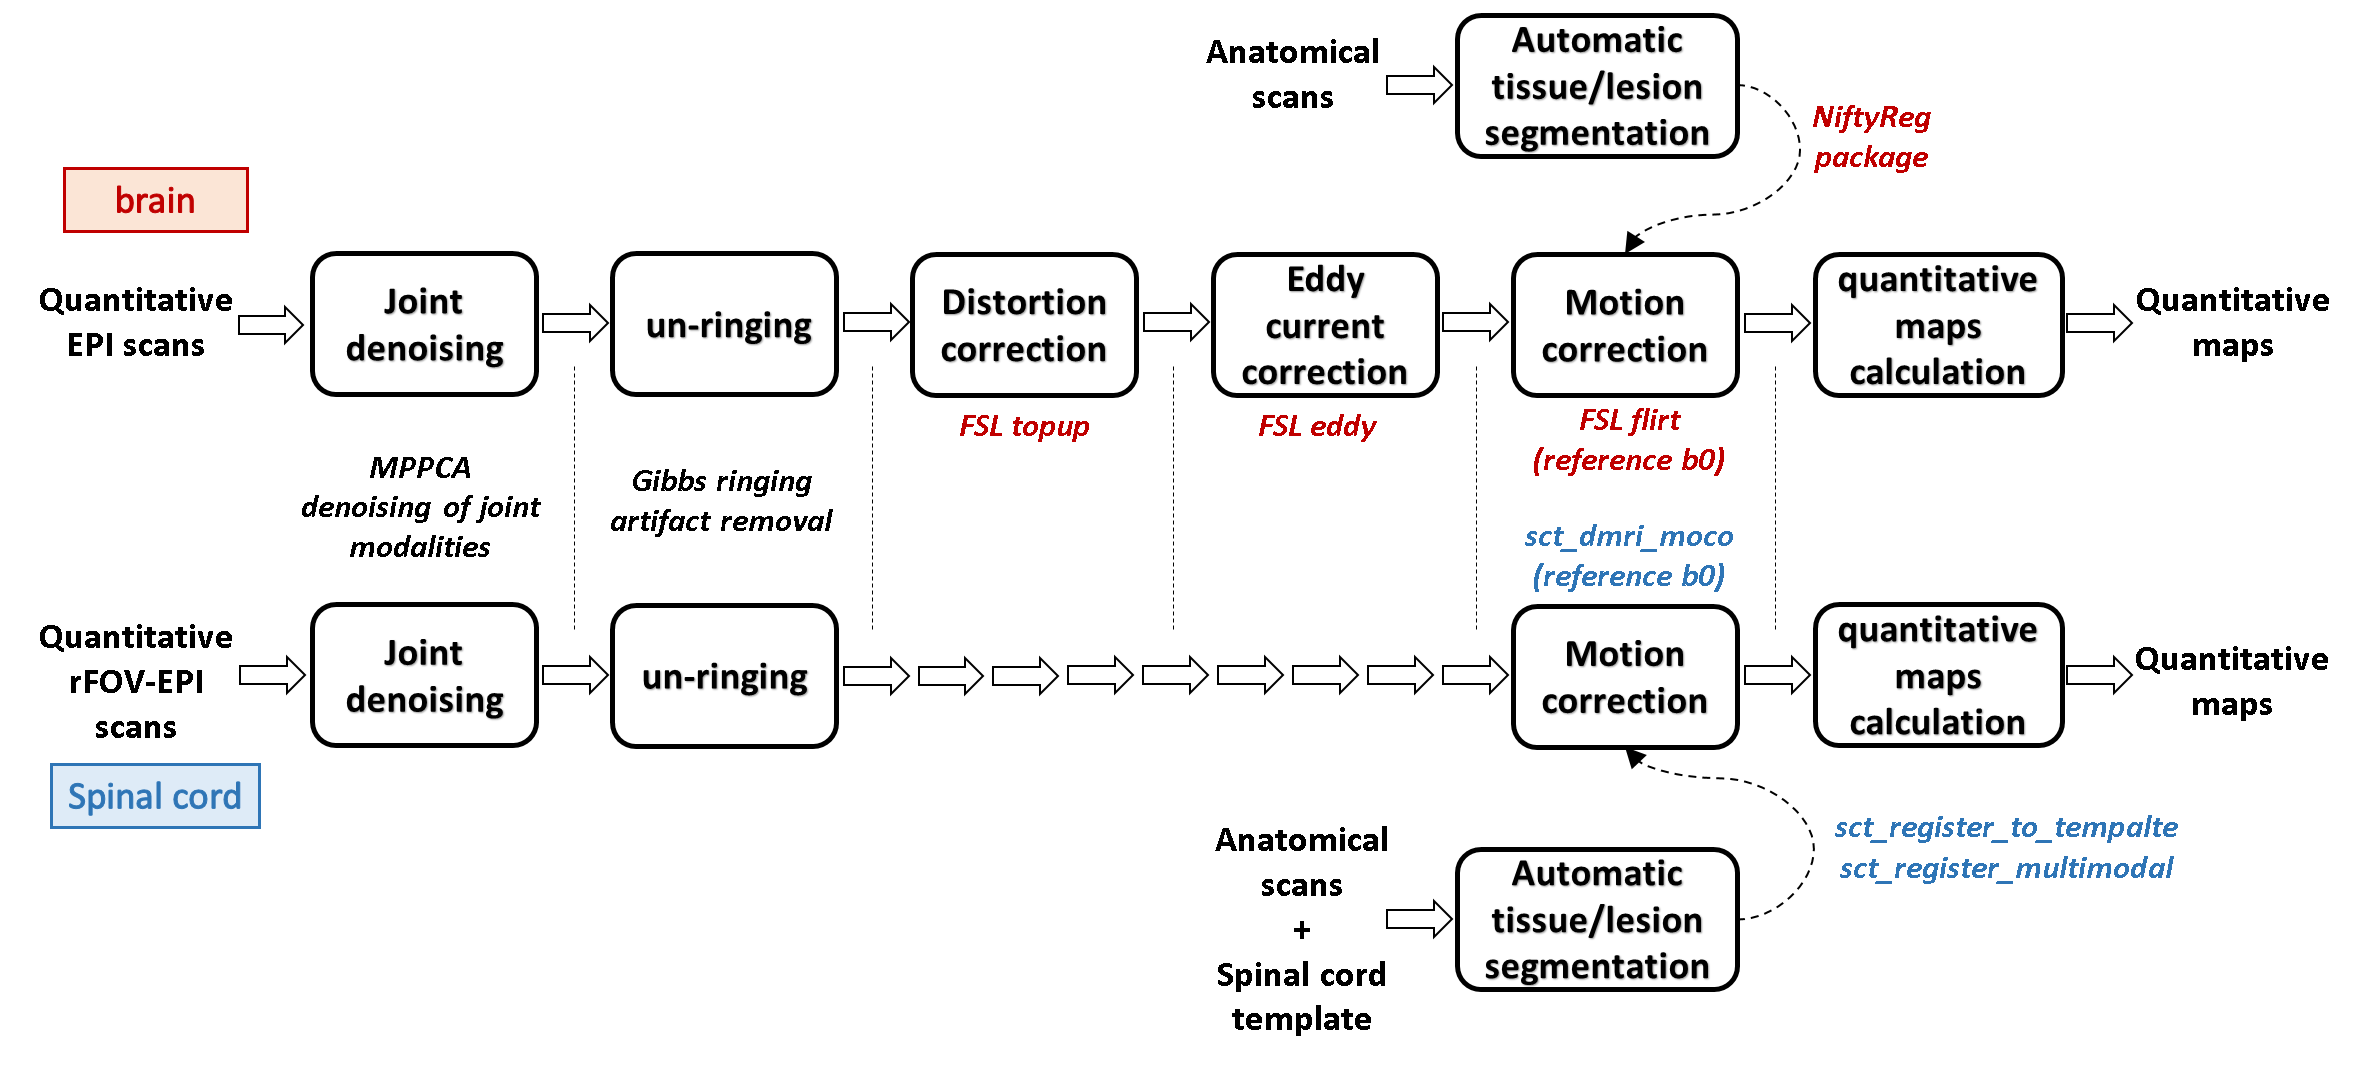
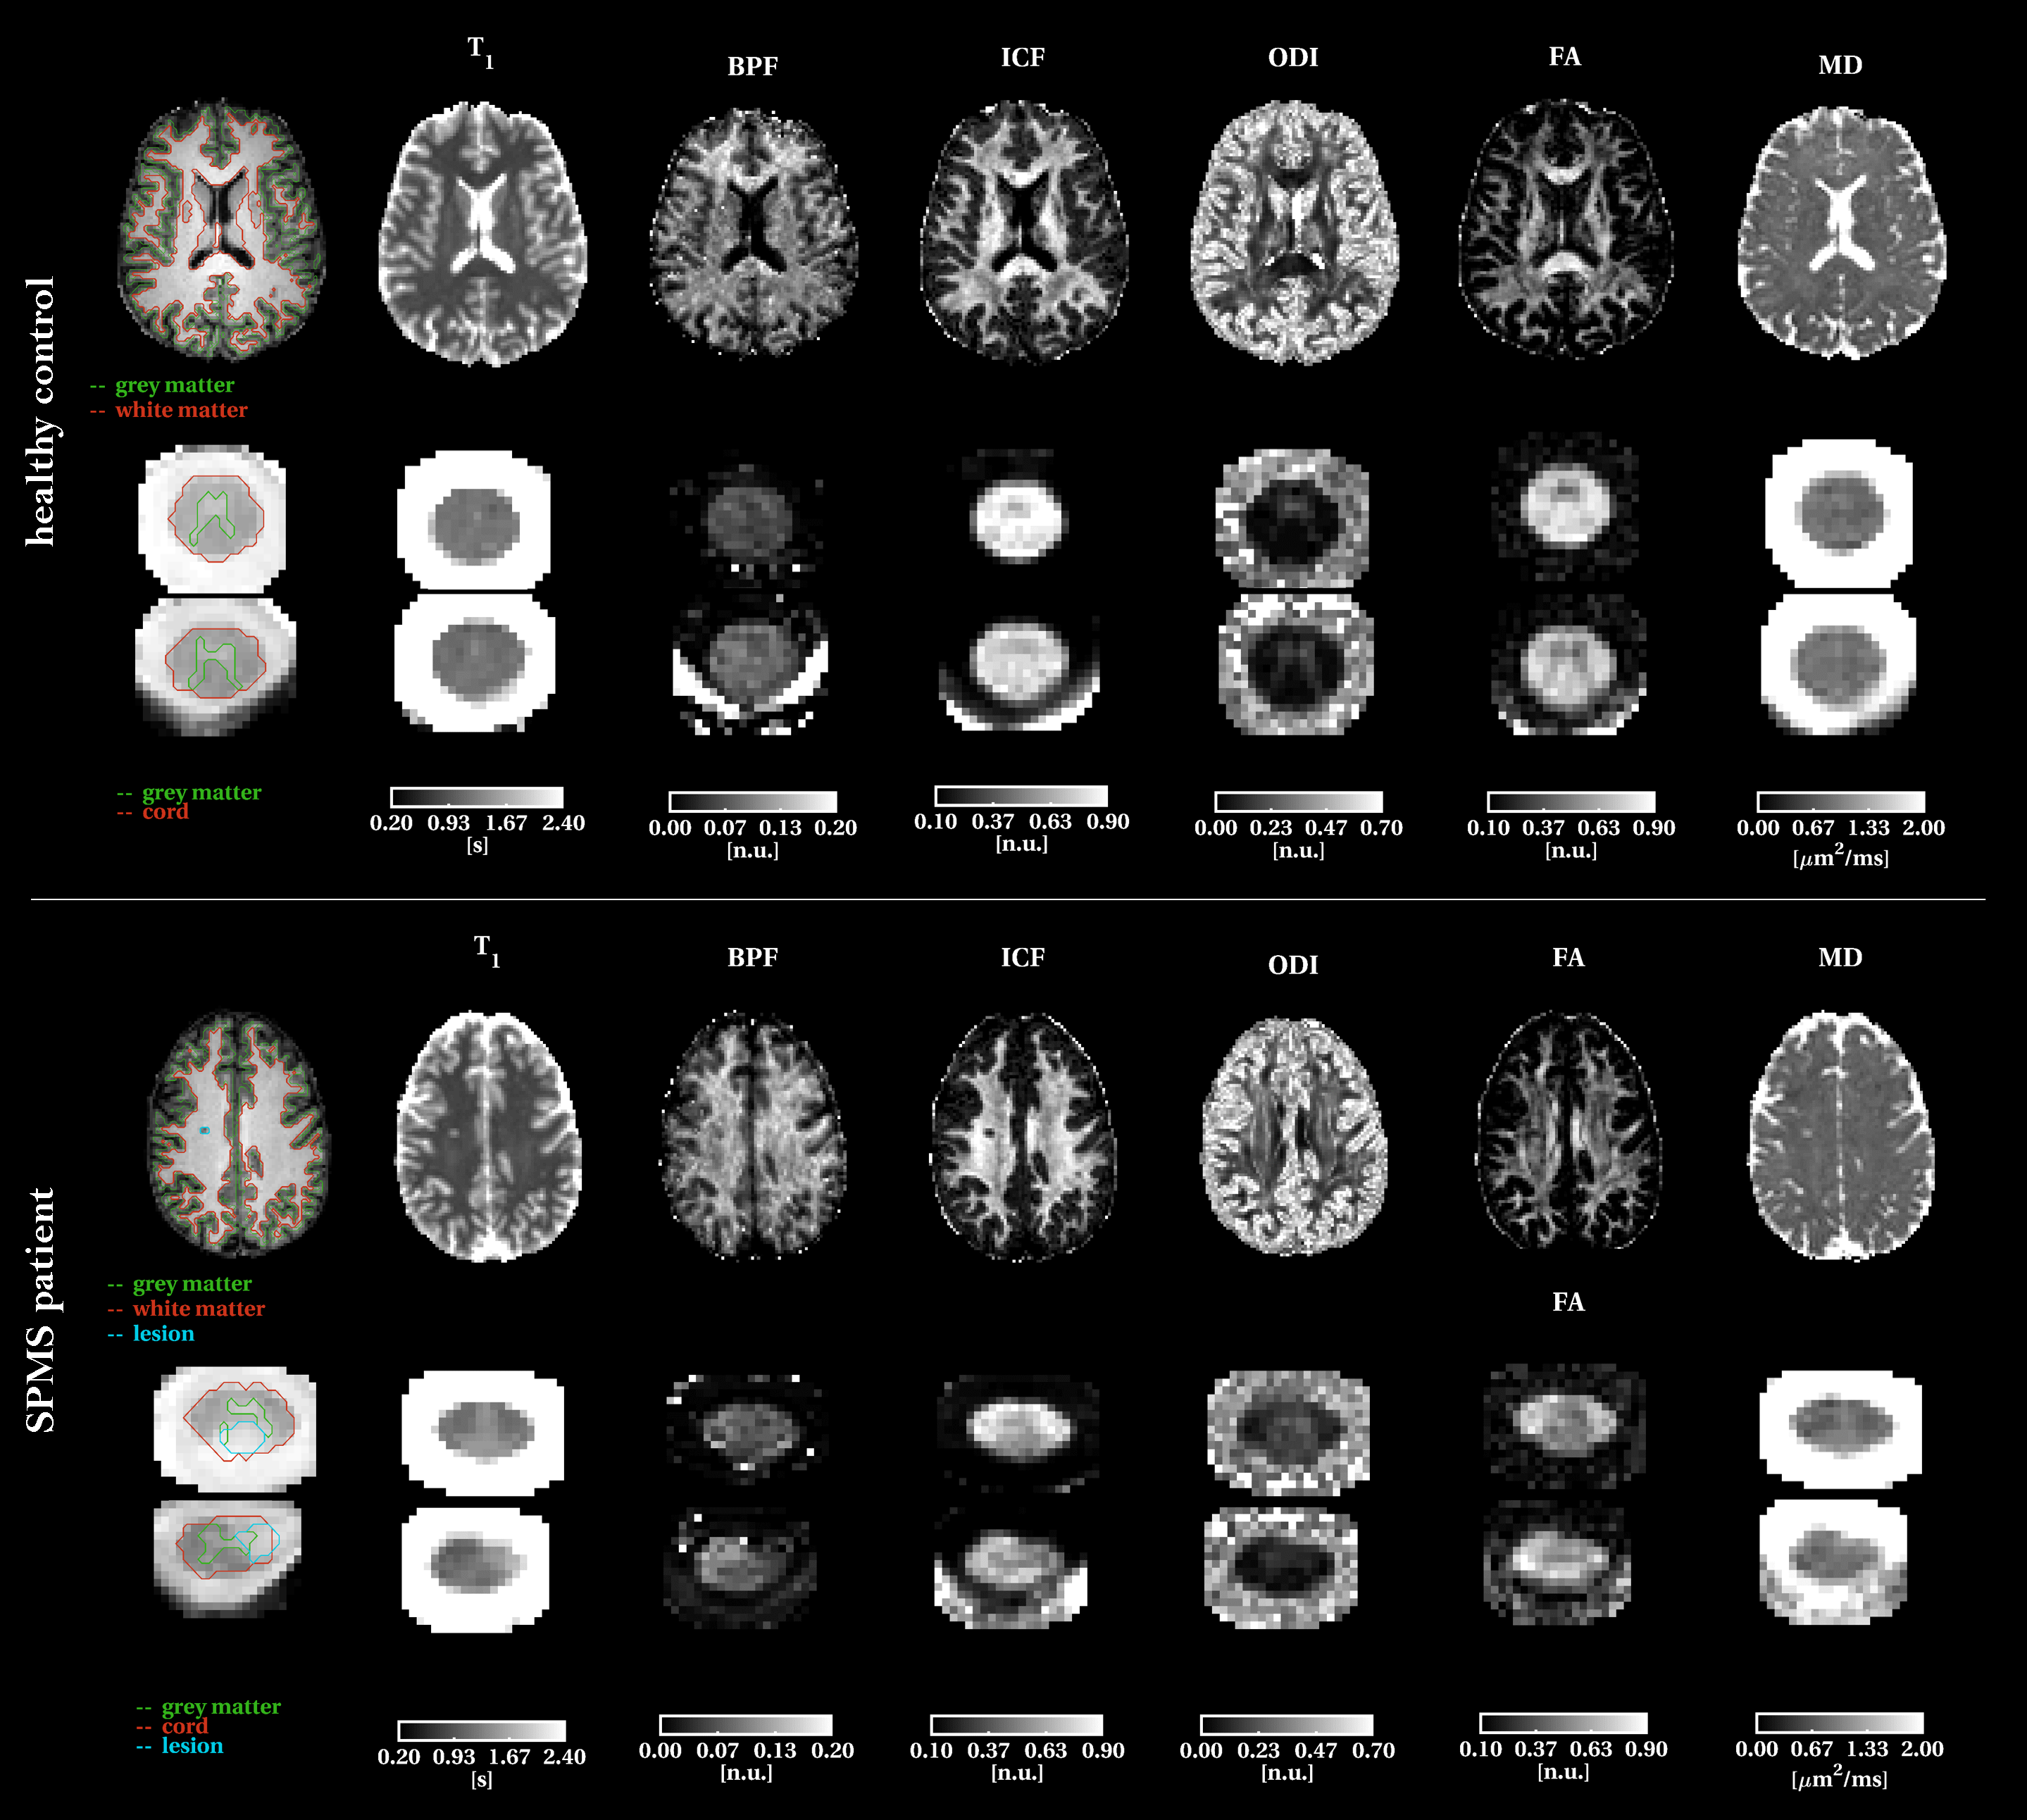
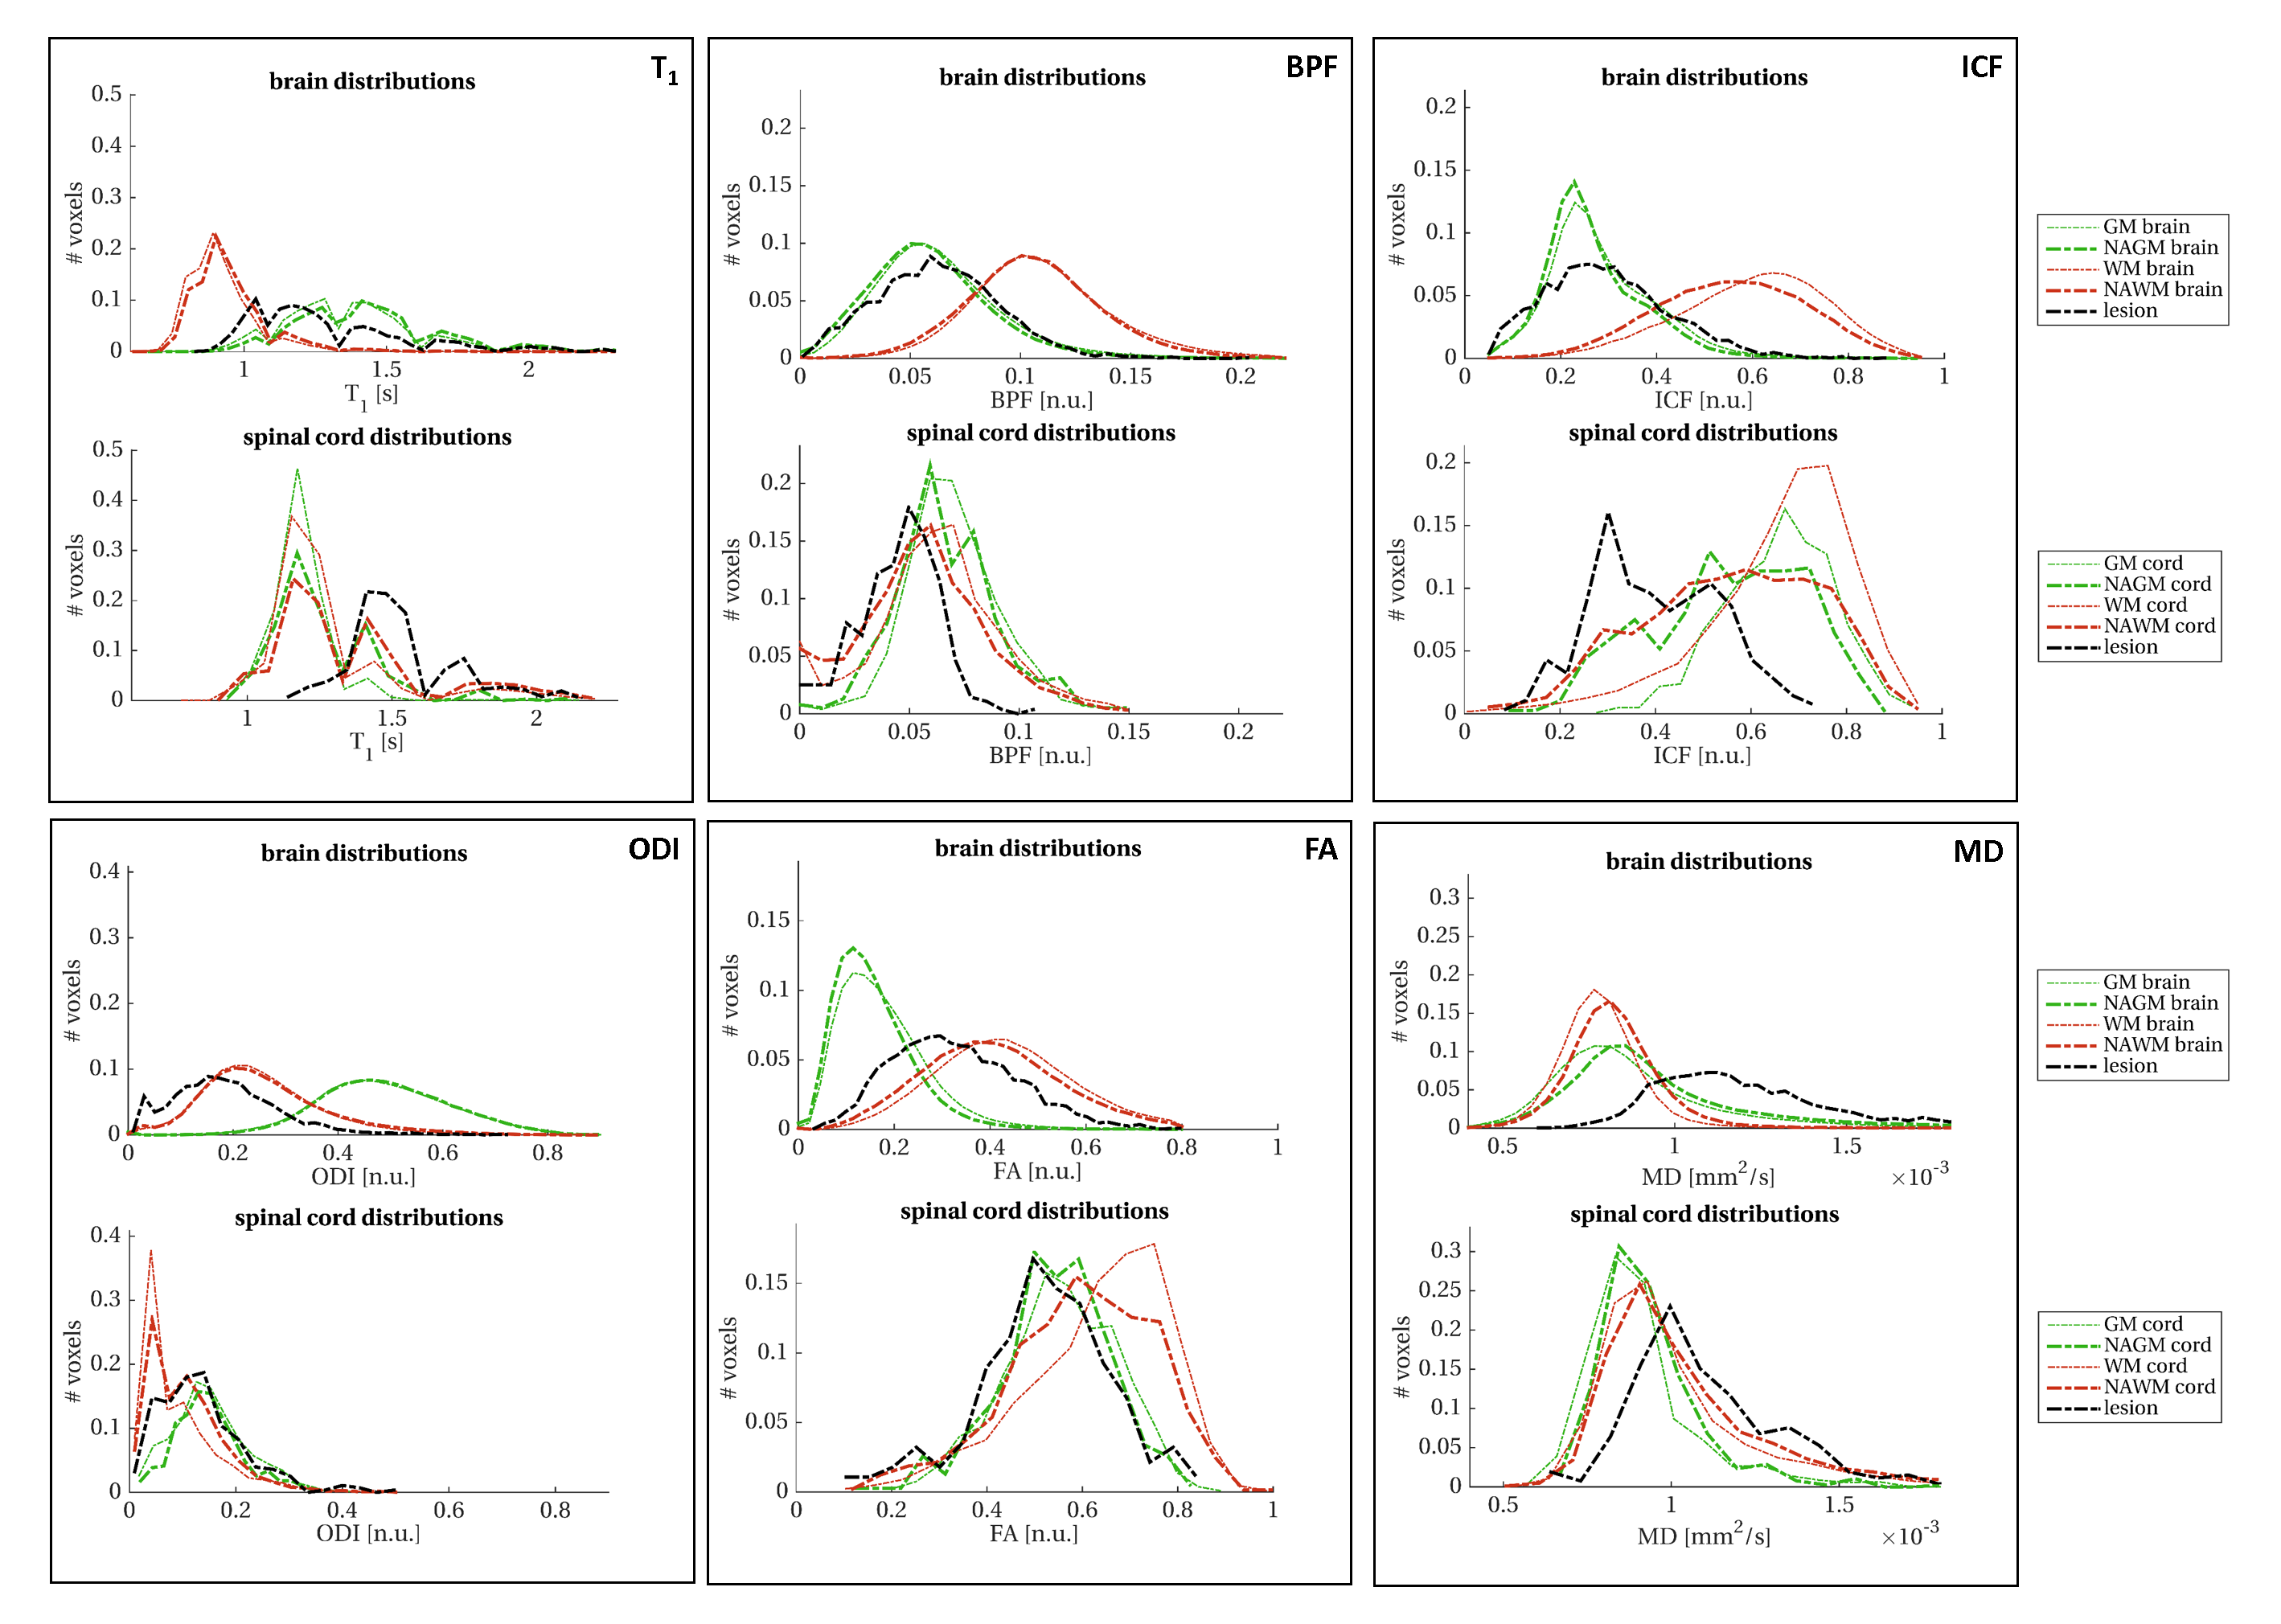
Figure 3: Comparison of quantitative parameters between brain and spinal cord. Each box reports a quantitative parameter (from top left to bottom right): longitudinal relaxation time (T1), bound pool fraction (BPF), intracellular volume fraction (ICF), orientation dispersion index (ODI), fractional anisotropy (FA) and mean diffusivity (MD). Different colours refer to different ROIs: white matter in red, grey matter in green and lesions in black. Thick lines refer to the patient population, thin lines to healthy controls.