1407
Clinical relevance of multiparametric MRI assessment of spinal cord damage in multiple sclerosis
Elisabetta Pagani1, Raffaello Bonacchi1,2, Alessandro Meani1, Laura Cacciaguerra1,2, Ermelinda De Meo1,2, Paolo Preziosa1,2, Maria A. Rocca1,2, and Massimo Filippi1,2,3
1Neuroimaging Research Unit, Institute of Experimental Neurology, Division of Neuroscience, IRCCS San Raffaele Scientific Institute, Milan, Italy, 2Neurology Unit, IRCCS San Raffaele Scientific Institute, Milan, Italy, 3Vita-Salute San Raffaele University, Milan, Italy
1Neuroimaging Research Unit, Institute of Experimental Neurology, Division of Neuroscience, IRCCS San Raffaele Scientific Institute, Milan, Italy, 2Neurology Unit, IRCCS San Raffaele Scientific Institute, Milan, Italy, 3Vita-Salute San Raffaele University, Milan, Italy
Synopsis
Cervical spinal cord involvement is common in multiple sclerosis (MS). We performed a comprehensive multiparametric MRI study to explore pathophysiological substrates of damage and to identify the most accurate imaging predictors of disability and disease course. We found that the processes contributing to disability differ according to the stage of the disease. In relapsing-remitting MS patients, lesions and microstructural damage to cervical spinal cord tracts have a prominent role, whereas in progressive MS patients, cervical cord grey matter atrophy becomes clinically meaningful.
Introduction
Cervical spinal cord (cSC) involvement is common in multiple sclerosis (MS). However, partly due to technical issues, no comprehensive multiparametric MRI study has been performed yet.Objective
To explore pathophysiological substrates of cSC damage in MS patients and to identify the most accurate imaging predictors of disability and disease course, using a multiparametric MRI approach.Methods
One-hundred and eleven MS patients, 57 with relapsing-remitting (RR) and 54 with progressive MS (PMS), and 32 age- and sex-matched healthy controls (HC) underwent brain and cSC 3 Tesla MRI with pulse sequences for assessing lesions and atrophy, and a diffusion-weighted scan for microstructural damage. Neurological assessment included Expanded Disability Status Scale (EDSS) scoring, and Nine-Hole Peg Test and 25-Foot Walking Test for limb function. Brain T2-hyperintense lesion volume (LV) were measured using Jim software.1 Whole brain, grey matter (GM) and white matter (WM) atrophy were assessed using SIENAX.2 For the cSC analysis, T2-hyperintense LV and diffusion tensor derived metrics were calculated between the C1 and C5 vertebral levels for the whole SC, the GM, WM, dorsal columns and lateral funiculi, applying a probabilistic regional atlas available in the Spinal Cord Toolbox,3 previously registered to the T2-weighted image space (Figure 1). Total SC cross-sectional area was calculated on 2D phase-sensitive inversion recovery sequences, using the active surface method,4 whereas GM was manually segmented. Between group differences and associations of MRI variables with these metrics were explored by age-, sex- and phenotype-adjusted linear models.Results
MS patients had cSC lesions, higher brain T2-LV, brain and cSC atrophy and microstructural damage, compared to HC. In MS patients, multivariable analysis identified brain GM volume, cSC lateral funiculi fractional anisotropy (FA) and lateral funiculi T2-LV as independent predictors of EDSS score. The independent predictors of EDSS score were cSC lateral funiculi FA, brain T2-LV and cSC lateral funiculi T2-LV in RRMS (R2=0.48); and cSC lateral funiculi FA and cSC GM atrophy in PMS (R2=0.52). Similar results were confirmed for limb function tests. Logistic regression analysis identified cSC GM atrophy and cSC T2-LV as independent predictors of phenotype (AUC=0.964).Conclusions
cSC involvement has a central role in explaining disability in MS. The processes contributing to disability differ according to the stage of the disease. In RRMS, lesions and microstructural damage to cSC tracts have a prominent role, whereas in PMS, cSC GM atrophy becomes clinically meaningful.Acknowledgements
No acknowledgement found.References
1. Jim 8, Xinapse Systems Ltd., Colchester, United Kingdom 2. Smith SM, Zhang Y, Jenkinson M, et al. Accurate, robust and automated longitudinal and cross-sectional brain change analysis. NeuroImage 2001;17(1):479-489. 3. Levy S, Benhamou M, Naaman C, et al. White matter atlas of the human spinal cord with estimation of partial volume effect. Neuroimage 2015;119:262-271. 4. Horsfield MA, Sala S, Neema M, et al. Rapid semi-automatic segmentation of the spinal cord from magnetic resonance images: application in multiple sclerosis. Neuroimage 2010;50:446-455.Figures
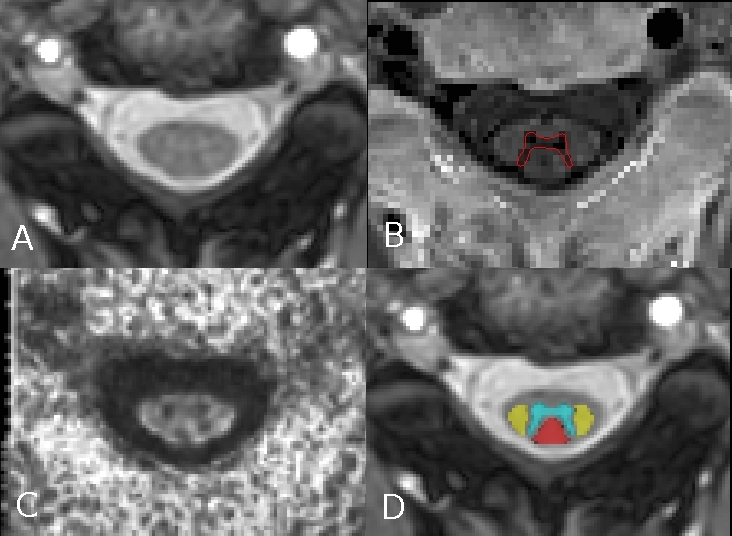
Figure 1. Cervical spinal cord MRI analysis. Representative axial slice at the
C2-C3 vertebral level from a multiple sclerosis patient: A) T2-weighted image; B) grey
matter segmentation on axial PSIR sequence; C) fractional anisotropy map; D)
spinal cord regional atlas registered to the T2-weighted image (grey matter in cyan, dorsal columns
in red, lateral funiculi in yellow).