1406
The Effect of AREX Correction on APT CEST MRI of Lesions within the Spinal Cord of MS Patients1Vanderbilt University Institute of Imaging Sciences, Vanderbilt University Medical Center, Nashville, TN, United States, 2Department of Biomedical Engineering, Vanderbilt University, Nashville, TN, United States, 3Department of Radiology and Radiological Sciences, Vanderbilt University Medical Center, Nashville, TN, United States, 4Department of Neurology, Vanderbilt University Medical Center, Nashville, TN, United States
Synopsis
Spinal cord damage in multiple sclerosis often leads to the formation of inflammatory lesions. APT CEST has been proposed as an MRI biomarker capable of detecting the underlying biochemical changes associated with lesion formation, however, CEST findings are susceptible to confounding influences such as the macromolecular magnetization transfer contribution and changes to longitudinal relaxation. AREX is a proposed method which corrects for these contributors and may improve measurement of the CEST component in vivo. In this study we sought to compare MT- and T1-corrected AREX to an uncorrected CEST quantification method in SC lesions of MS patients.
Introduction
Multiple sclerosis (MS) and many other neurodegenerative diseases result in significant damage to the spinal cord (SC), often presenting as lesions [1]. MRI is ubiquitously used to detect lesions within the SC; however, these lesions are non-specific and often do not reflect patient disability. Recently, chemical exchange saturation transfer (CEST) has been proposed as an MRI biomarker capable of detecting the underlying biochemical changes which occur prior to and during lesion development. Amide proton transfer (APT) CEST is an MRI contrast approach sensitive to mobile endogenous solutes such as proteins and peptides, as well as tissue pH [2]. Endogenous CEST effects are often confounded by a number of contributing factors, including the macromolecular component present in all magnetization transfer experiments, RF-spillover effects, and changes to T1 relaxation. Apparent exchange-dependent relaxation rate (AREX) [3] is a proposed CEST quantification approach which corrects for the previously mentioned confounders. In this study, we sought to evaluate the changes in contrast between AREX and uncorrected APT measurements within the lesions of early-stage MS patients.Methods
Fourteen healthy volunteers and seven MS patients were recruited for this study after informed consent (Table 1 for demographics). A 3T whole body scanner (Philips, Best, Netherlands) and a 16-channel sensitivity encoding (SENSE) neurovascular coil were used to acquire all images. We acquired a single slice between the C3 and C4 vertebrae. All images were registered to a multi-slice, multi-echo gradient echo (mFFE) prior to analysis. A WASSR sequence was performed for B0 field correction. The CEST sequence consisted of a single 150ms 2µT saturation pulse acquired at 36 asymmetric offset frequencies between ±5 ppm and corrected for respiration according to By et al [4]. Additional parameters include: FOV = 160mm x160mm, voxel size = 1mm x 1mm, SENSE = 2(RL), TR/TE = 305/12ms, α = 20°, NSA = 5. T1 mapping for AREX calculation was done using a multi flip angle sequence. Additional parameters include: FOV= 160mm x 160mm, voxel size = 1.5mm x 1.5mm, TR/TE = 20/4.6ms, α = 5,15,20,25,30°. Gray and white matter segmentation was done using Spinal Cord Toolbox [5], while lesion segmentation was done manually and verified by a trained clinician. Lesions were detected in each MS subject within the region of interest. APT asymmetry was calculated by integrating the difference between 3.2 to 3.8 ppm and -3.2 to -3.8 ppm. For AREX, we inverted the Z spectrum generated by the CEST experiment, then multiplied by the R1 map generated by our multi-flip angle sequence.Results
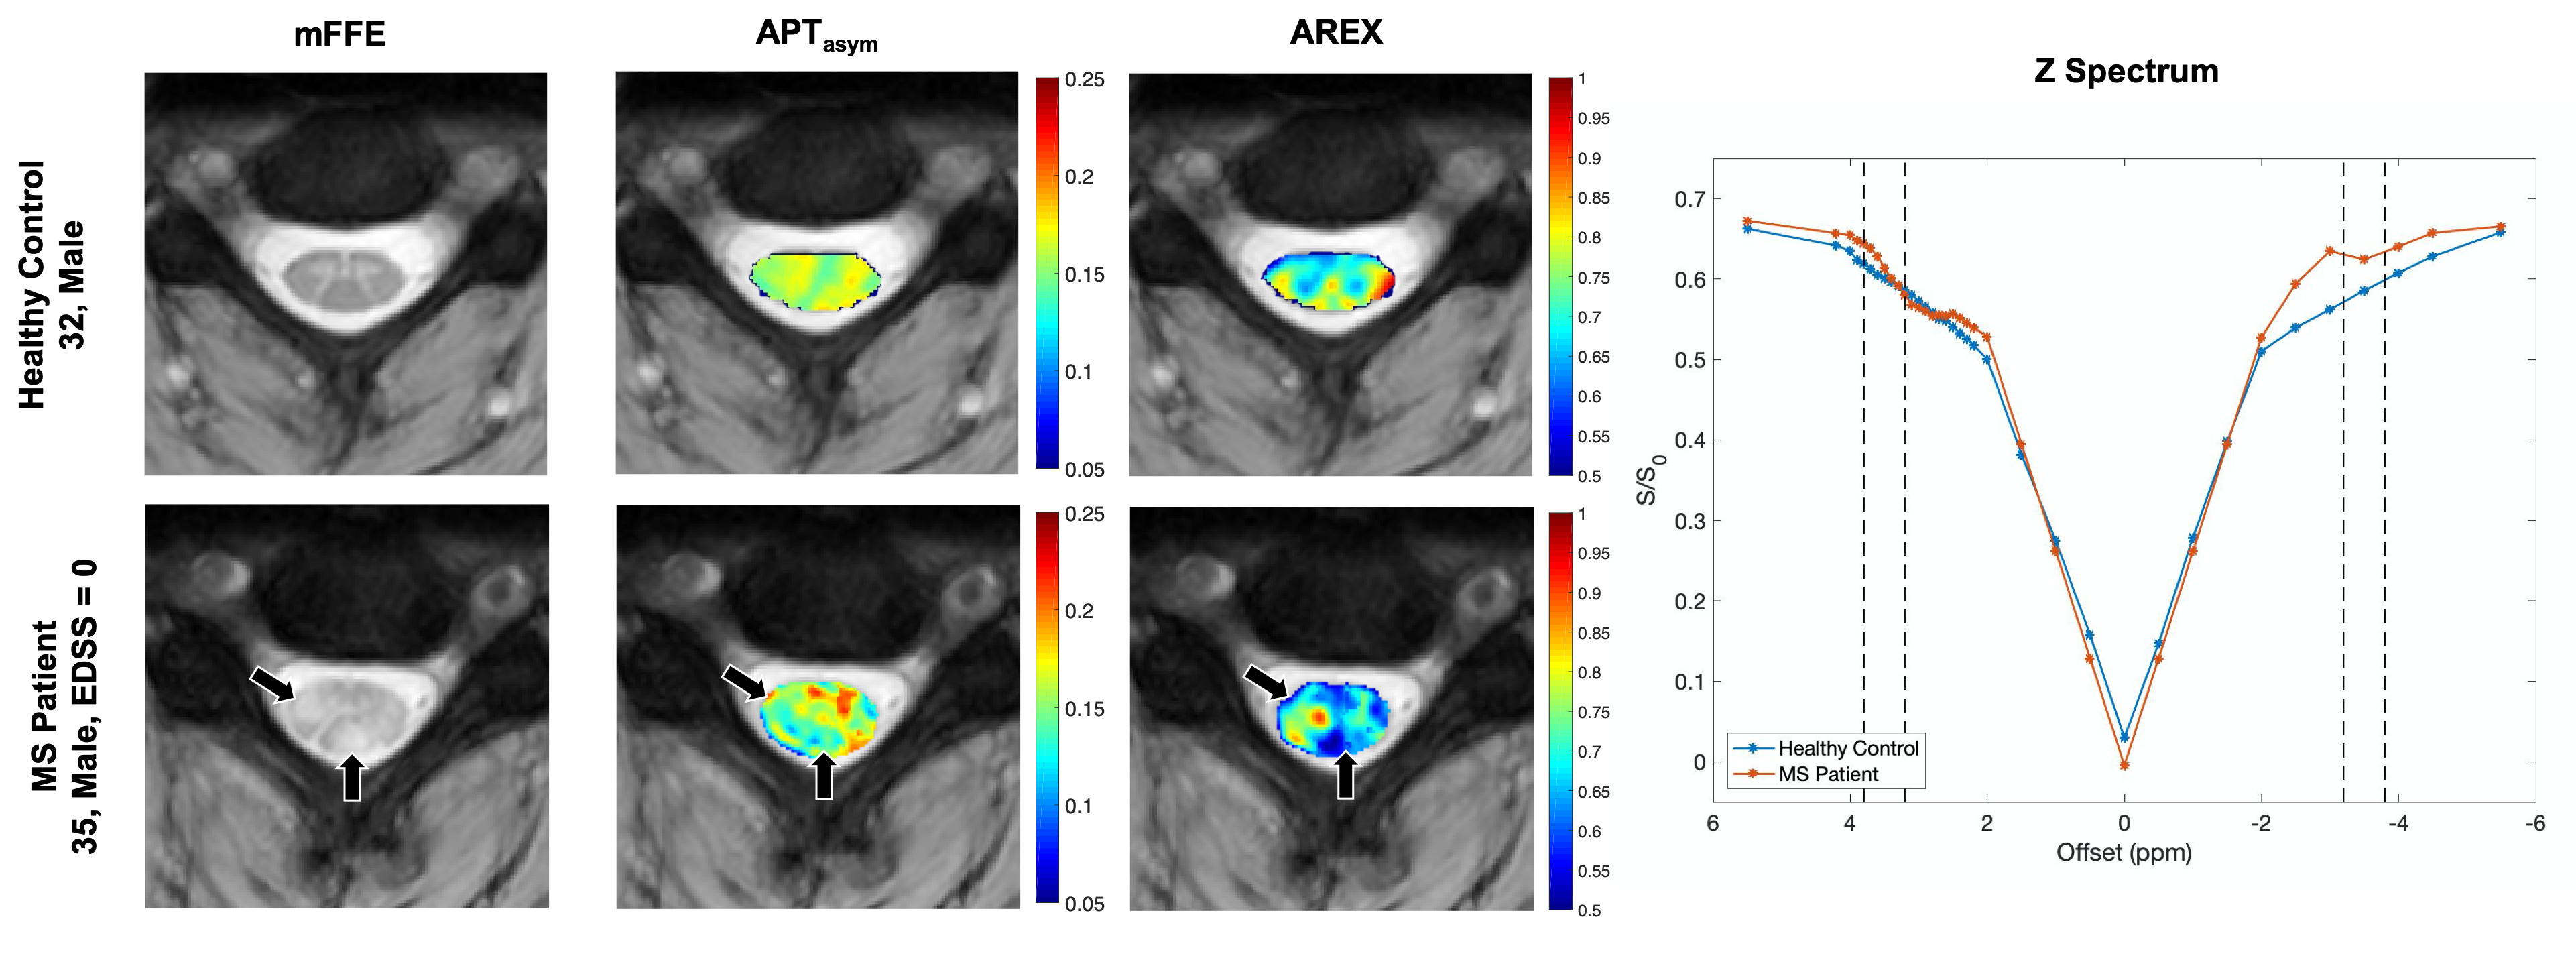
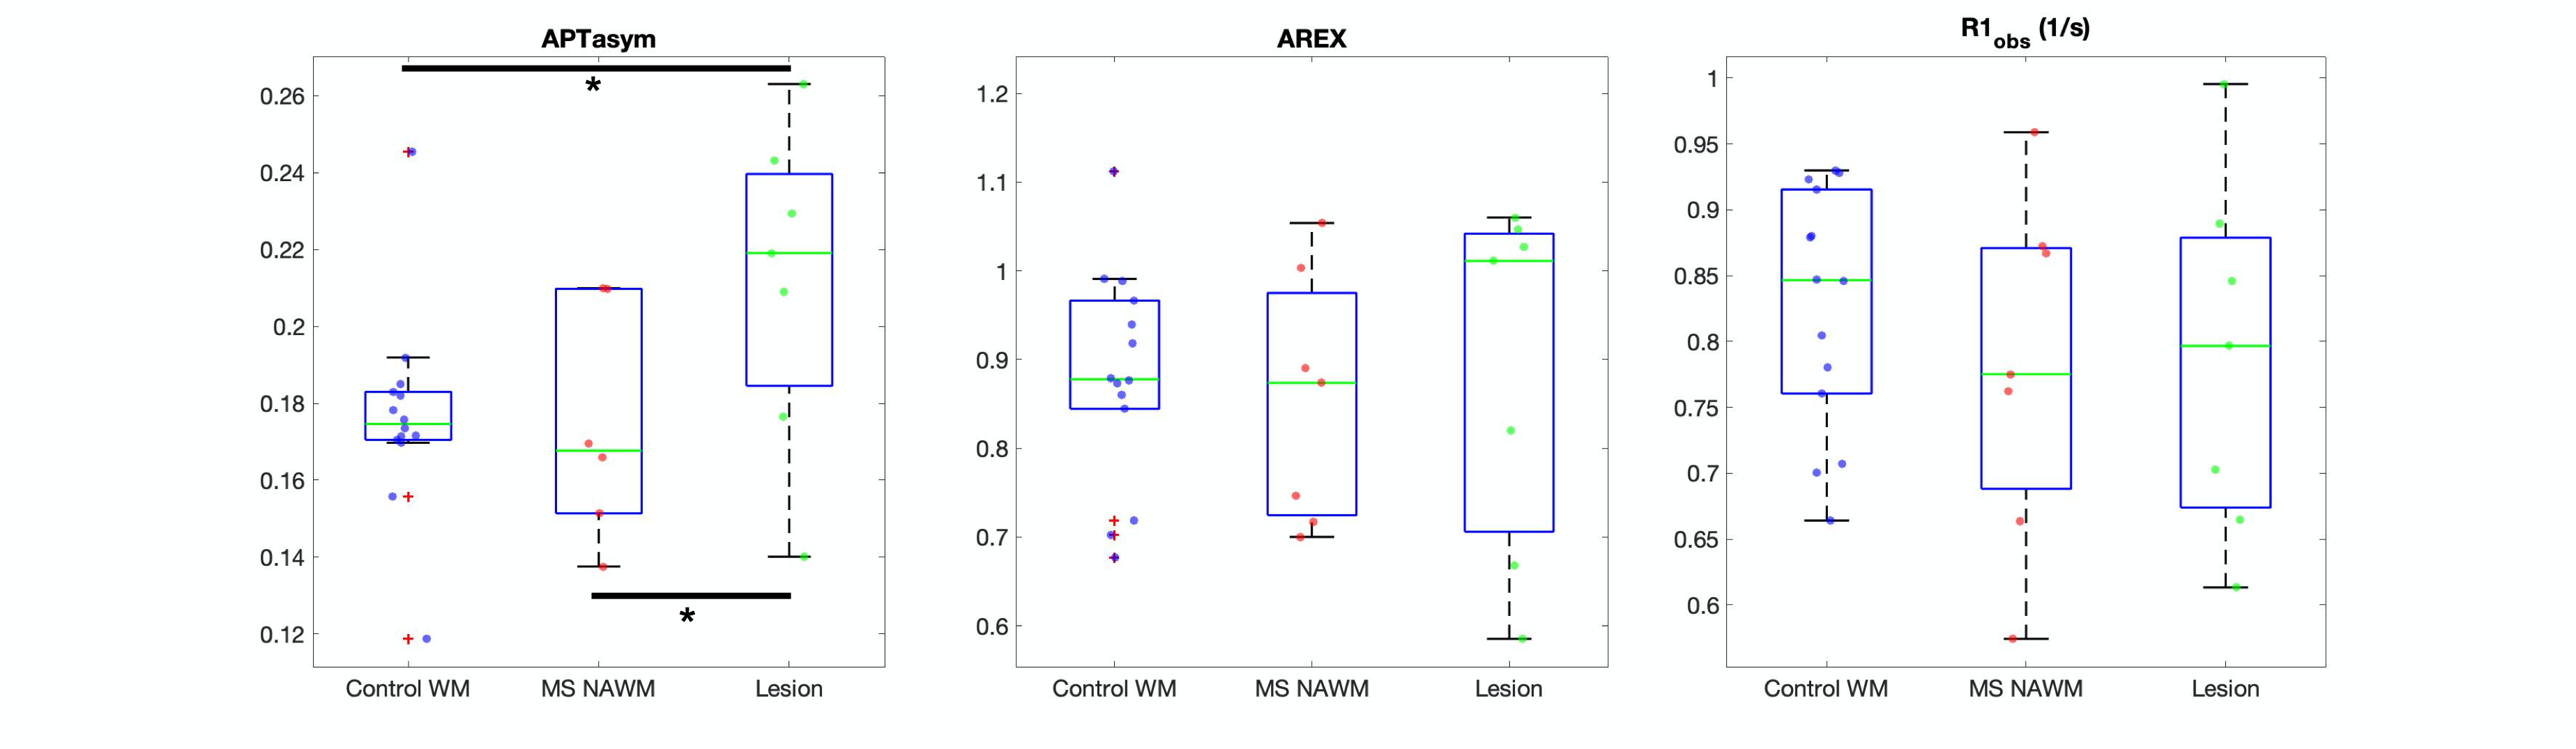
Figure 1 shows maps for a representative healthy control (top) compared to an MS patient (bottom), as well as their respective Z spectra (right). The healthy control shows a more homogeneous contrast in both metrics when compared to the MS subject. The black arrows indicate the location of 2 lesions within the white matter (WM) of the MS patient. In the APT map, we see regions of decreased values in the areas associated with the lesions. However, in the AREX map, the lesion in the dorsal column shows a stark decrease, while the lesion in the lateral column shows a slight increase. In the Z spectrum comparing the healthy control and MS patient, on the positive side of the spectrum, where the CEST contribution lies, we see very little difference between subjects. This is not the case on the negative side, where the MT component would have the most influence. Here we see a large difference in the two subjects, most likely due to the demyelination occurring in the MS patient. Figure 2 compares the mean indices within three tissue types: healthy control WM, the normal-appearing WM and MS patients, and lesions. Overall, significant differences in Wilcoxon rank-sum tests were found between APT asymmetry of healthy control WM and lesion (p <0.05), and normal appearing WM and lesion (p<0.05).Discussion
Our results suggest that the sensitivity of uncorrected CEST metrics, such as APT asymmetry, to lesion tissue is confounded by contributors such as the macromolecular component and changes to longitudinal relaxation, even in this cohort of low-disability patients. We suspect that the uniform decrease seen in our APT asymmetry values within lesions is primarily due to the demyelination influencing the macromolecular contribution. Once these contributions are removed and only the CEST component is present, lesions have a much more heterogeneous presentation. We hypothesize that the AREX metric gives a much more valid estimation of CEST contributions, despite this nonuniformity, and may reflect the activity of the lesion. In the future, we plan to investigate the correlation between AREX and Gadolinium enhancement to identify if AREX can be a valid measurement of lesion activity.Acknowledgements
We thank our study participants and VUIIS MRI technologists. Funding: Conrad Hilton Foundation (SAS), National MS Society (SAS), NIH/NINDS 1R01NS109114-01 (SAS), and NIBIB T32EB021937.References
1. Popescu, B.F.G., I. Pirko, and C.F. Lucchinetti, Pathology of multiple sclerosis: where do we stand? Continuum (Minneapolis, Minn.), 2013. 19(4 Multiple Sclerosis): p. 901-921.
2. Zhou, J., et al., Using the amide proton signals of intracellular proteins and peptides to detect pH effects in MRI. Nat Med, 2003. 9(8): p. 1085-90.
3. Zaiss, M., Windschuh, J., Paech, D., Meissner, J.-E., Burth, S., Schmitt, B., … Radbruch, A. (2015). Relaxation-compensated CEST-MRI of the human brain at 7T: Unbiased insight into NOE and amide signal changes in human glioblastoma. NeuroImage, 112, 180–188. https://doi.org/https://doi.org/10.1016/j.neuroimage.2015.02.040
4. By, S., et al., Amide proton transfer CEST of the cervical spinal cord in multiple sclerosis patients at 3T. Magn Reson Med, 2018. 79(2): p. 806-814.
5. De Leener B, Levy S, Dupont SM, et al. SCT: Spinal Cord Toolbox, an open-source software for processing spinal cord MRI data. Neuroimage 2017; 145: 24-43. DOI: 10.1016/j.neuroimage.2016.10.009.
Figures