1405
Phase Sensitive Inversion Recovery (PSIR) imaging as surrogate for T1 mapping: applications to the spinal cord of multiple sclerosis patients1UCSF Weill Institute for Neurosciences, Department of Neurology, University of California San Francisco, San Francisco, CA, United States
Synopsis
Acquiring images on a phantom and 54 multiple sclerosis patients, we explored the feasibility of T1 mapping using a fast 2D inversion recovery method based on a TrueFISP sequence. We also explored the relationship between T1 values and the intensity of 2D PSIR images. The fast T1 mapping method was shown to be precise, and PSIR intensities shown to have a strong correlation with T1. PSIR has been extensively used to segment in-vivo gray and white matter tissues in the spinal cord, and this study suggests that it can simultaneously provide microscopic information related to the longitudinal relaxation time T1.
INTRODUCTION
A clinically feasible 2D phase sensitive inversion recovery (PSIR) acquisition protocol has been extensively used to segment gray matter (GM) and white matter (WM) tissues in the spinal cord (SC) of healthy controls, motor neuron disease and multiple sclerosis (MS) patients.1-3 Concerning quantitative MRI techniques to explore SC tissues’ microscopic properties, magnetization transfer ratio and diffusion tensor imaging are the two mostly used techniques.4 The longitudinal relaxation time T1 is known to depend on myelin content, water content, axonal size and iron concentration, but its use in SC imaging is still limited.5,6 Among several T1 mapping approaches, inversion recovery (IR) methods are considered the “gold standard”.7The aim of the present study was twofold:
- Developing a T1 mapping method using a fast 2D IR protocol based on product sequences commonly available.
- Exploring the relationship between T1 values and the intensity of the 2D PSIR images.
METHODS
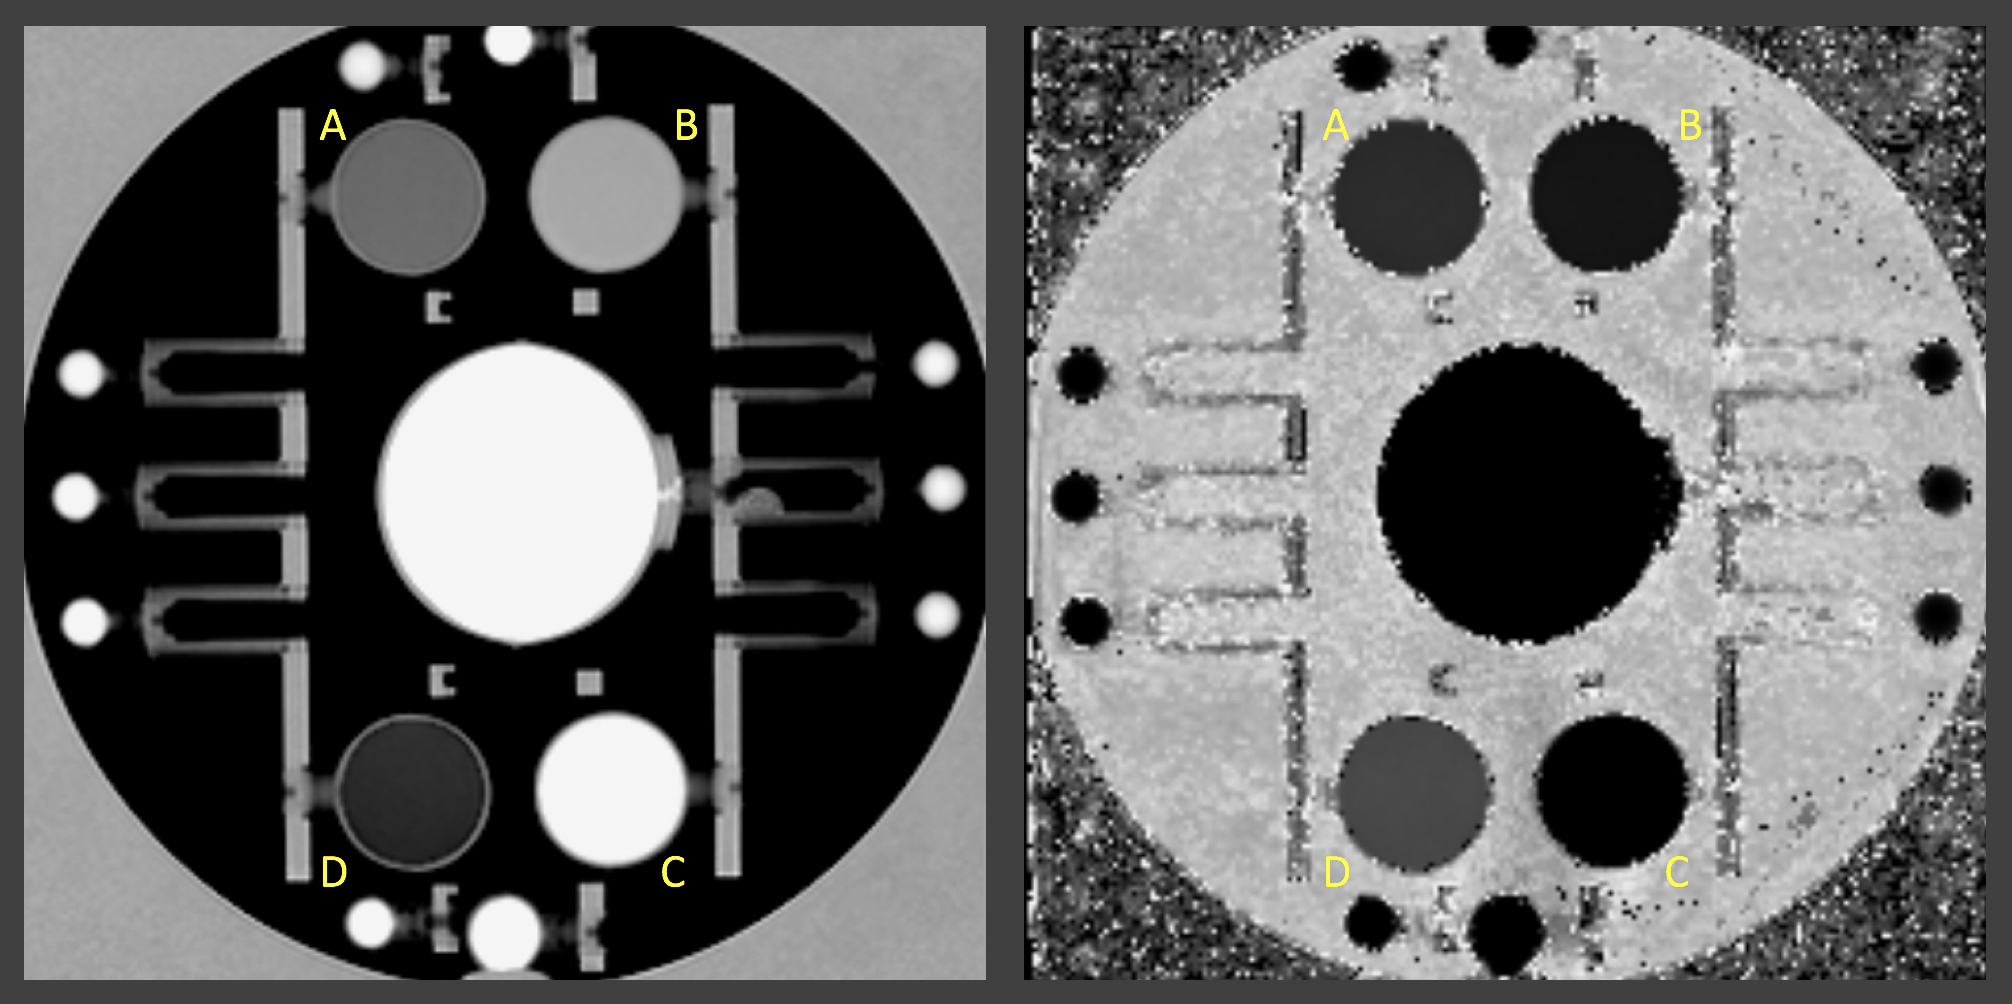
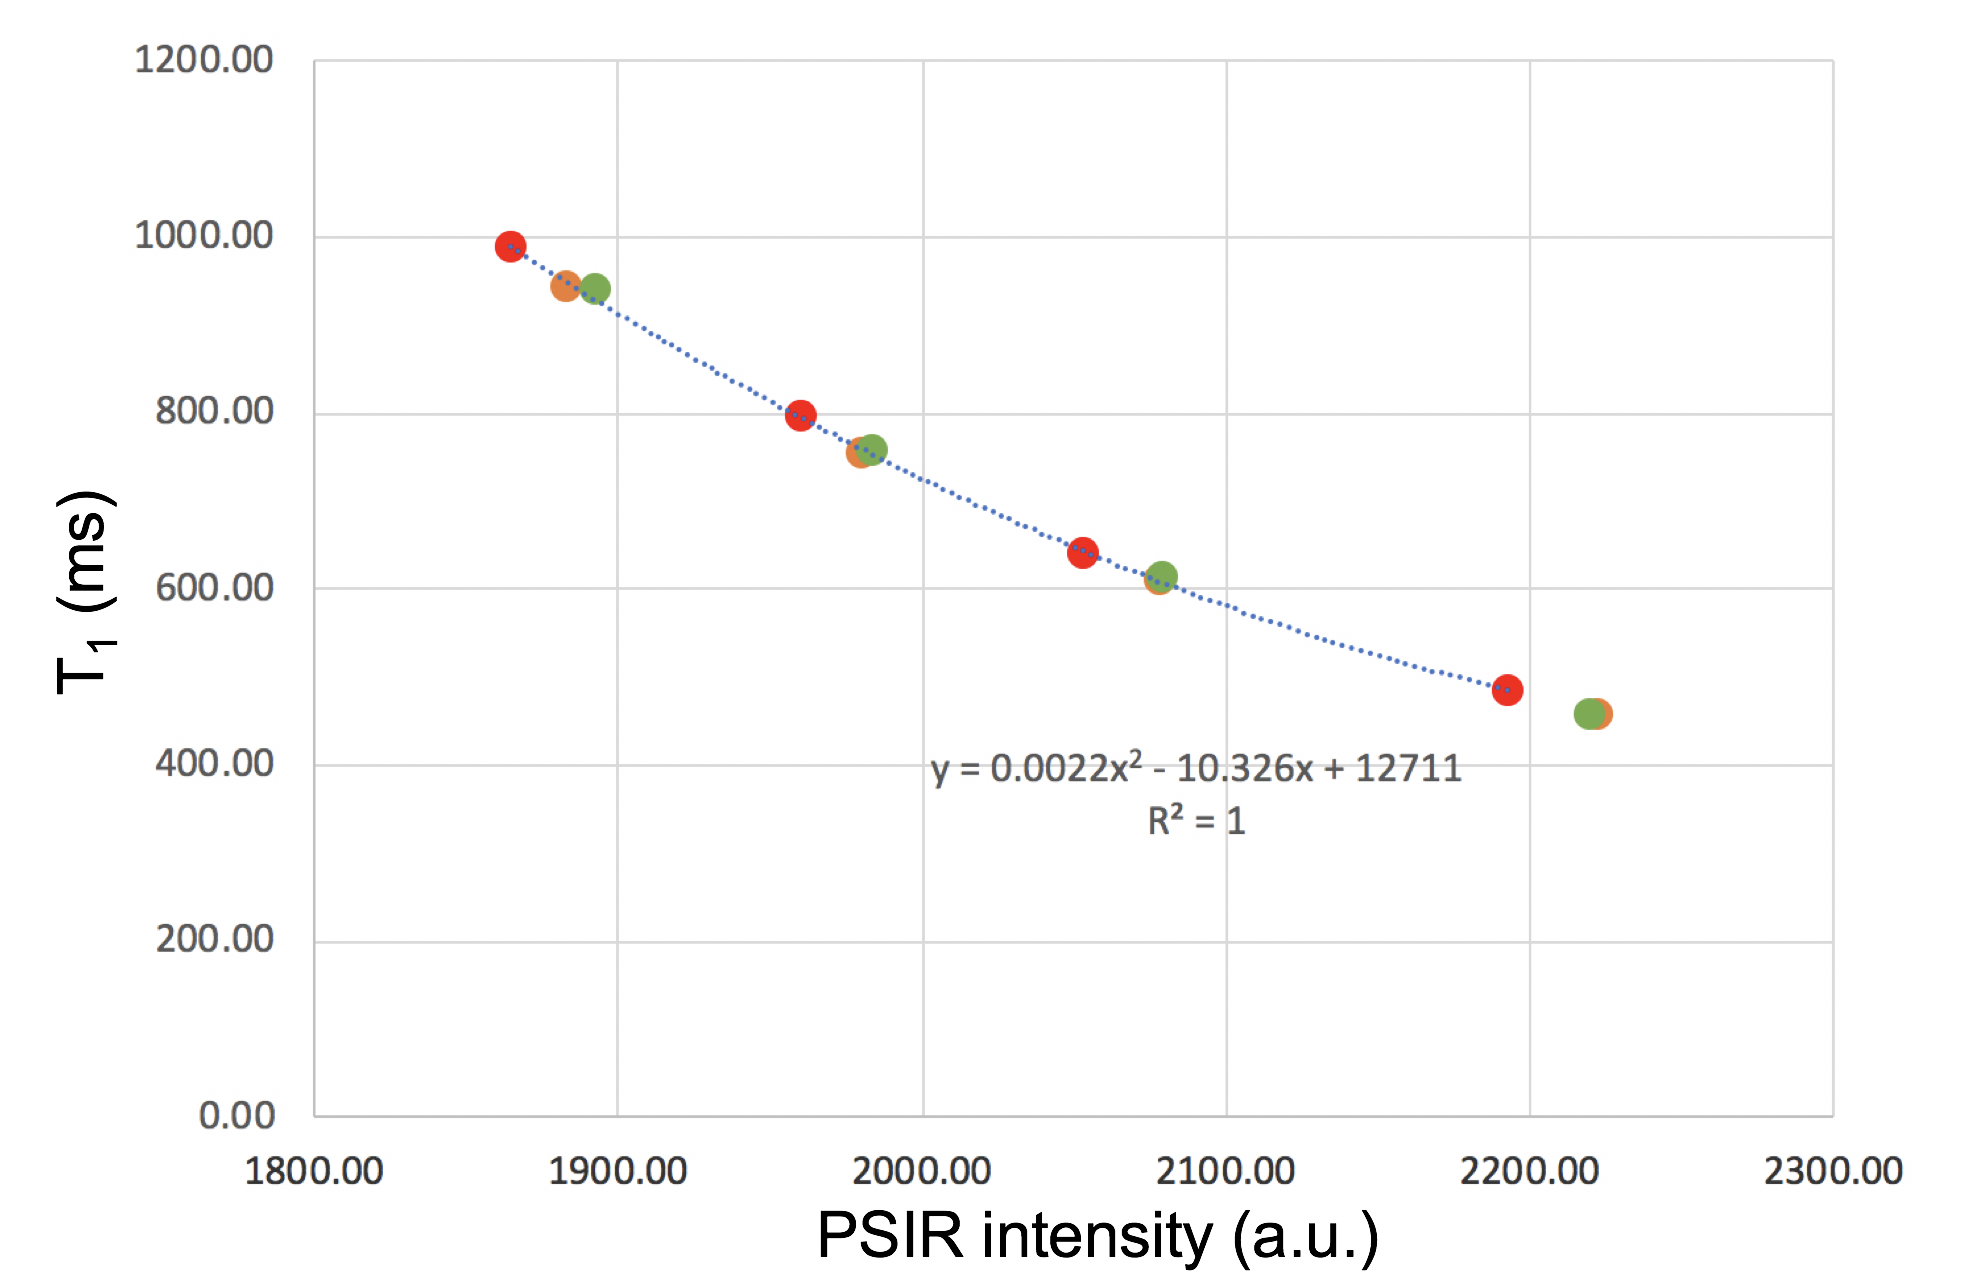
Phantom experimentAn ADNI (Alzheimer's Disease Neuroimaging Initiative) phantom was scanned on a Siemens 3T Prisma and twice on a Siemens 3T Skyra (two weeks apart, the second time twice with repositioning in between the scans) using a 2D PSIR single slice protocol of 2 minutes acquisition time8 and a single slice IR TrueFISP protocol in which 23 different inversion times (TI) images were acquired in 2:40 minutes. The latter protocol (as the PSIR protocol) is available on Siemens scanners in the CV (cardiovascular) basic package as a Scout to select the best TI (providing the highest contrast between the tissues of interest) to be used in the PSIR. The phantom was also scanned with the 2D PSIR protocol on a GE 3T Discovery MR750 scanner.8 The PSIR and TrueFISP slice was positioned to include the 4 phantom insets with different T1 (declared target T1 at 1.5T: 450, 600, 750 and 900ms). To compute T1 maps, the voxel intensity (Sx,y) from the 23 TrueFISP images (magnitude reconstructed) with different TI (130/1410ms range) were fitted voxel-by-voxel using the equation Sx,y = Ax,y - Bx,y exp (-TI/T1*x,y) after sign restoration. The obtained T1*x,y was corrected to finally get T1x,y = T1*x,y (Bx,y / Ax,y – 1).9 An example of phantom T1 map is reported in Figure 1. Four circular ROIs were drawn on the 4 insets on all the T1 maps and PSIR images. Median T1 values of the 4 ROIs were plotted versus PSIR intensities and data fitted with quadratic and linear curves. PSIR intensity of the GE acquisition was plotted versus each Siemens data and linearly fitted. Average % differences on the 4 insets between the different couples of measurements were computed.
In-vivo experiment
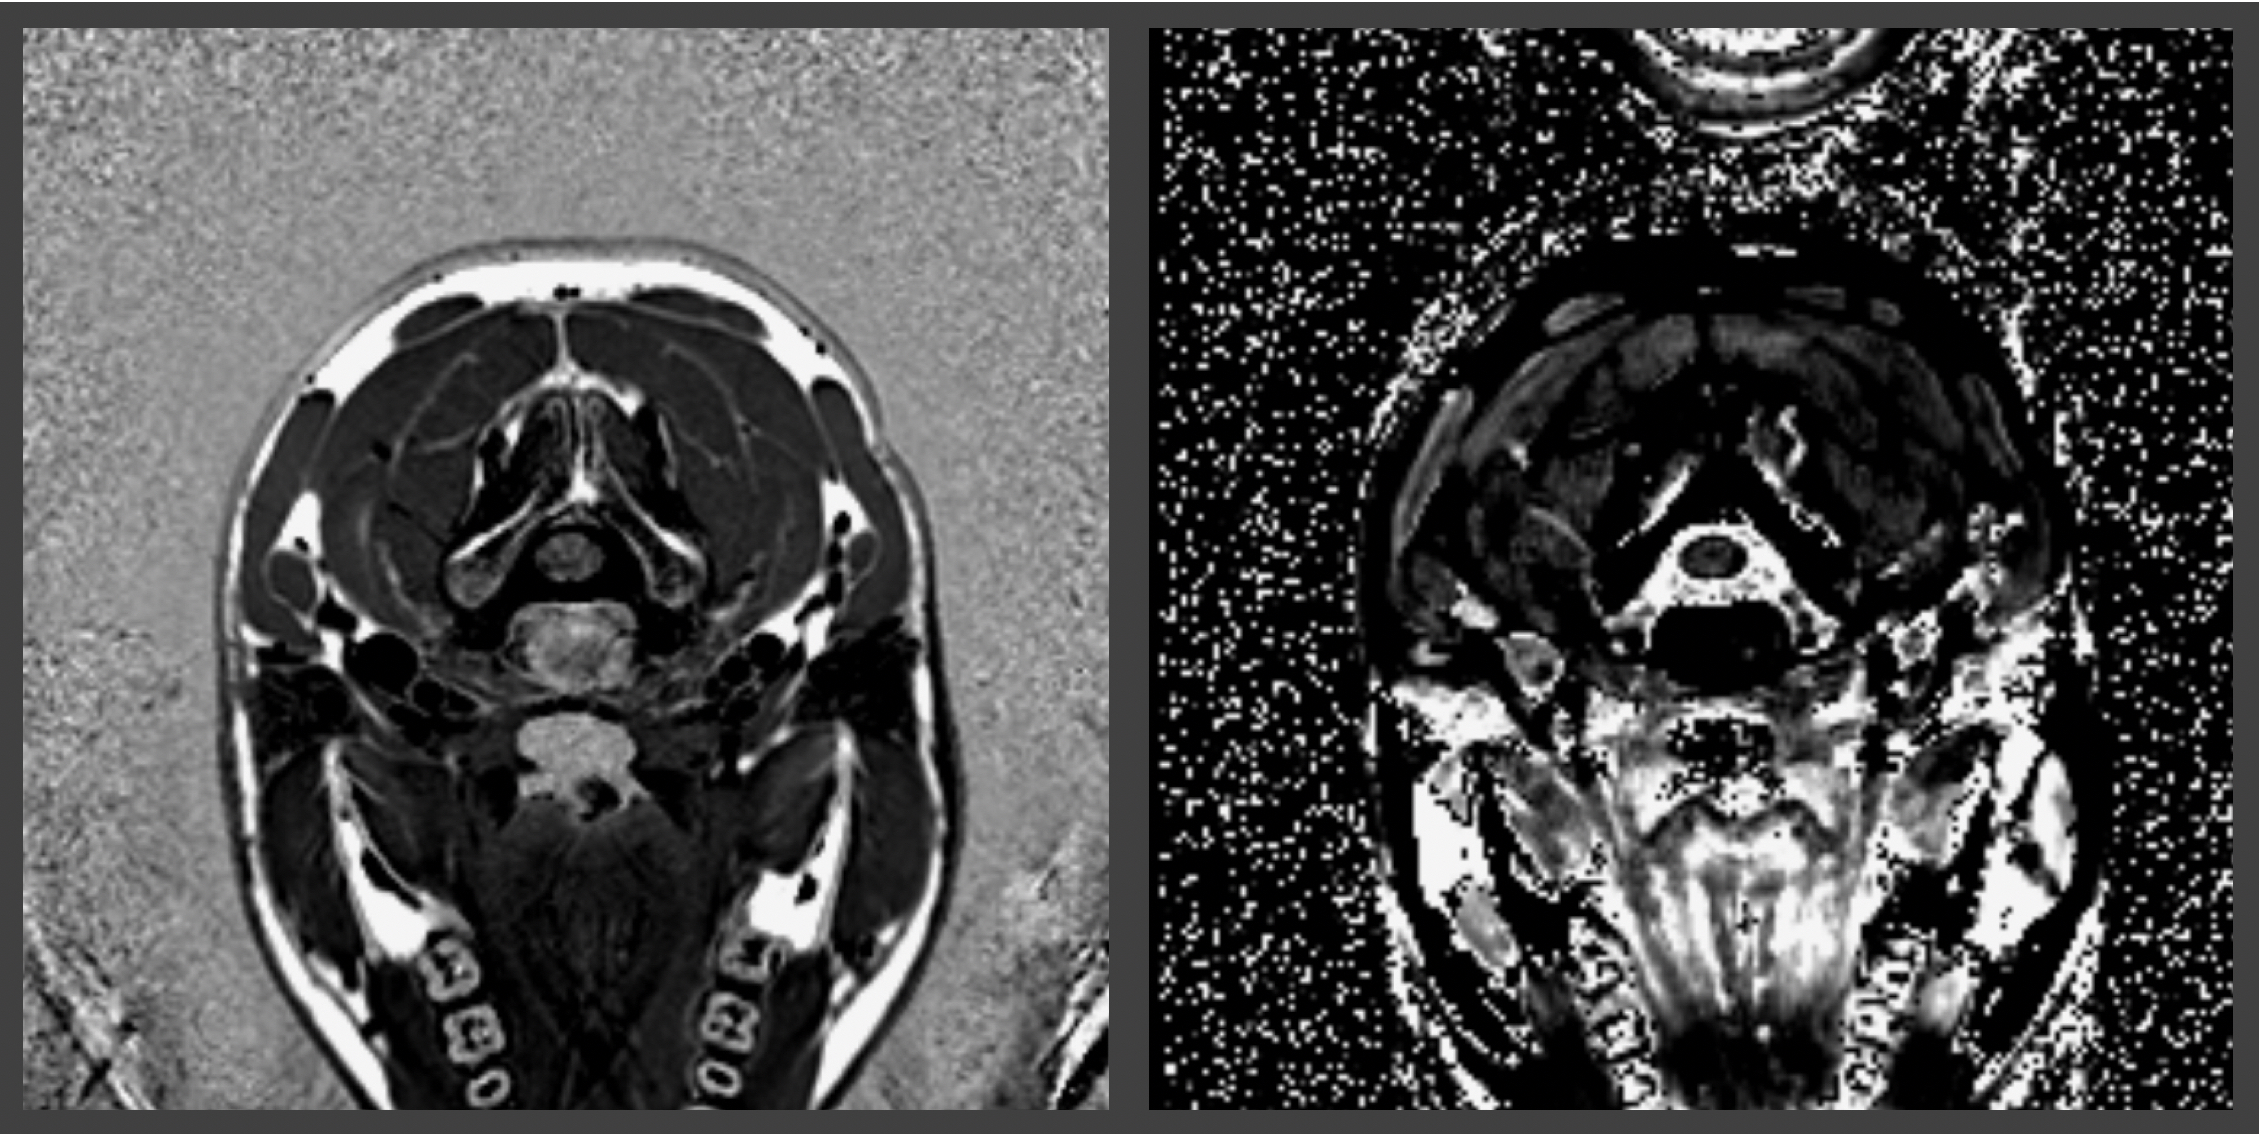
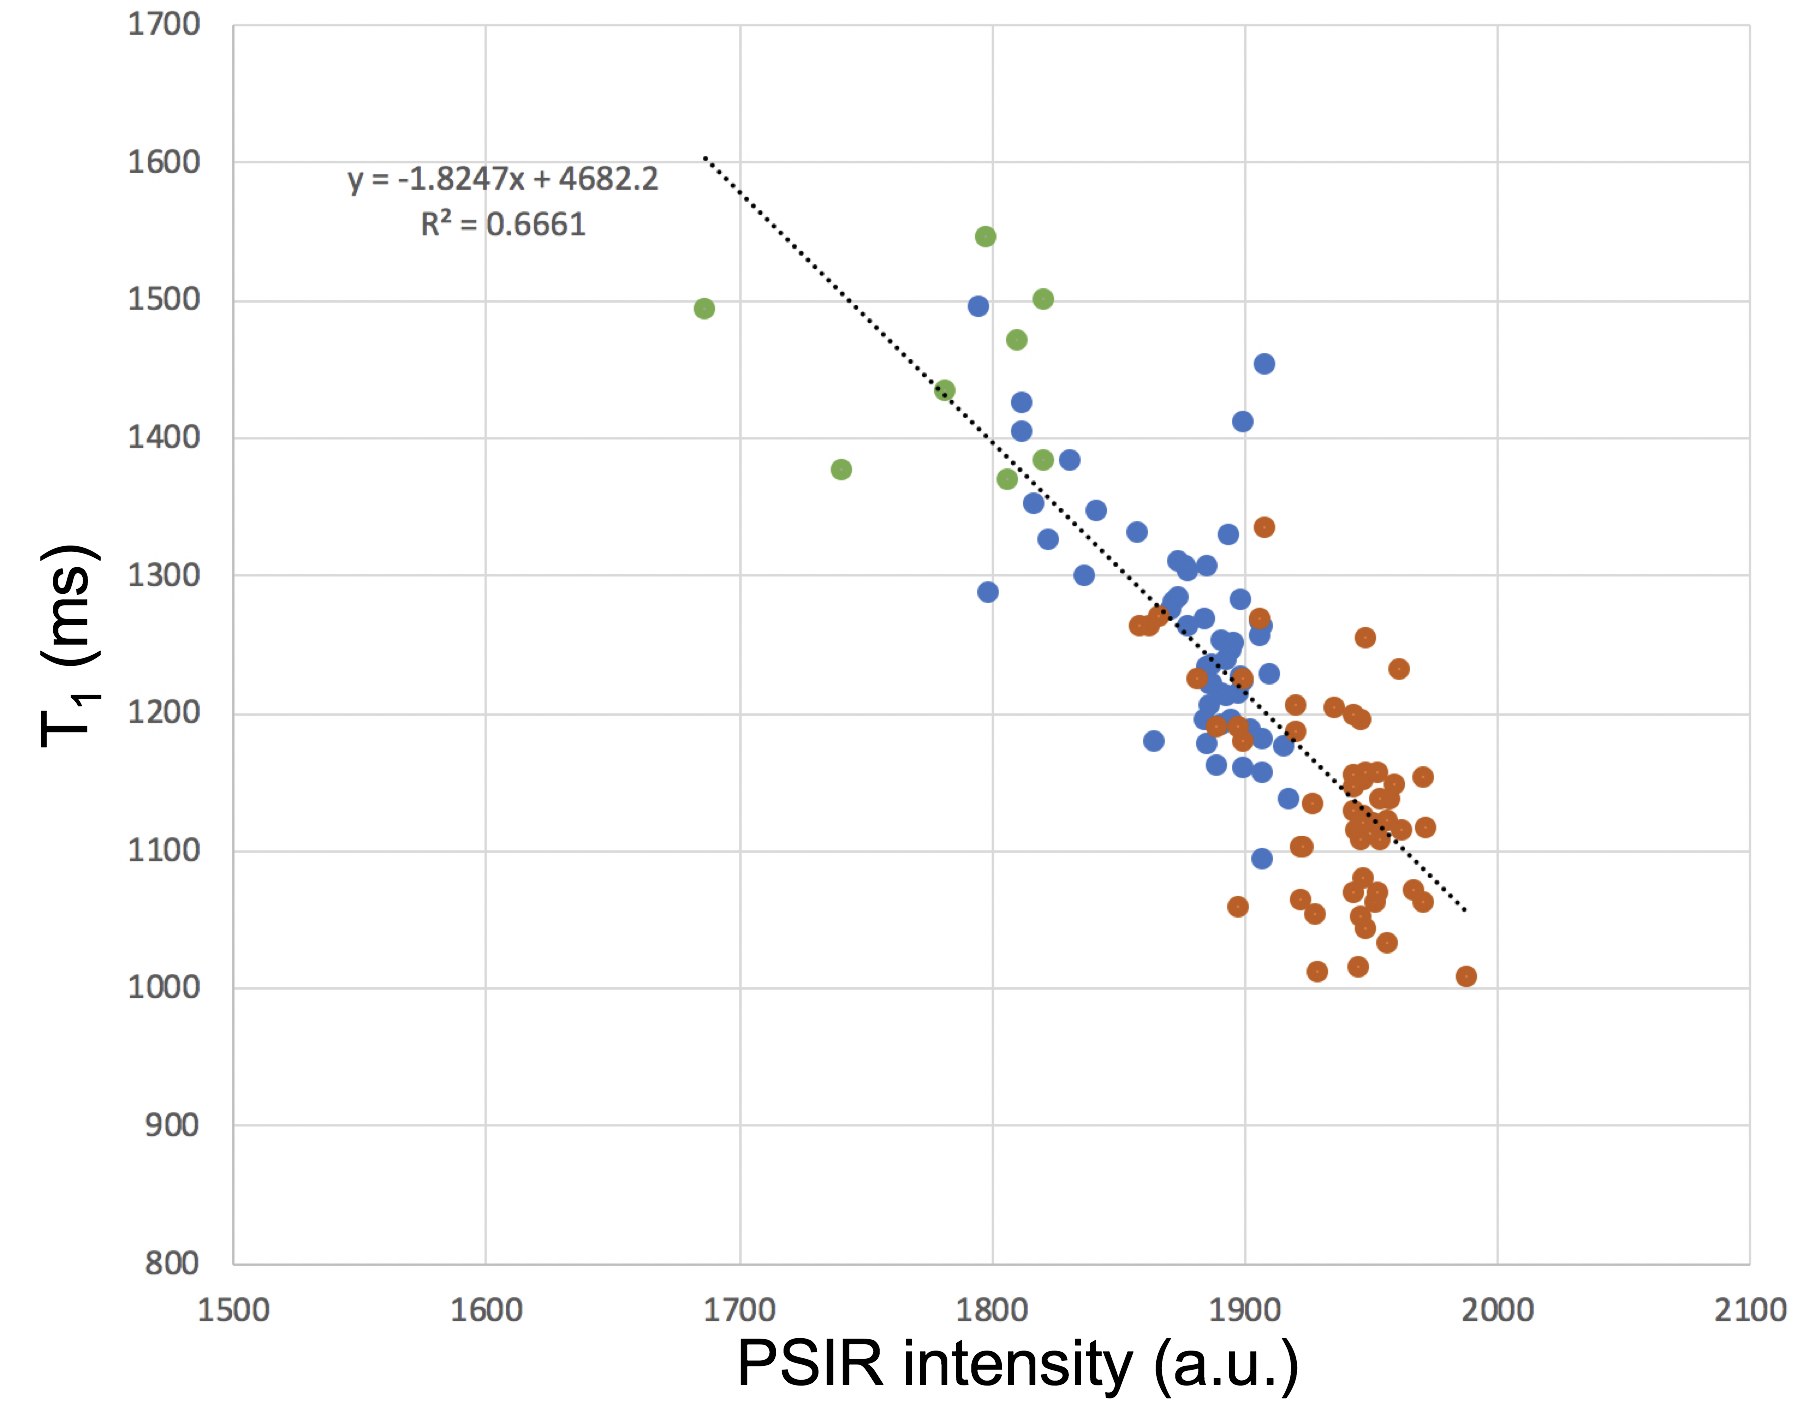
2D PSIR and T1 mapping protocols were acquired at the C2-C3 vertebral disc level of 54 MS patients using a Siemens 3T Skyra. T1 maps were obtained as already described. Small ROIs were drawn on WM, GM and on lesions (when present) on the PSIR images. T1 maps were co-registered to PSIRs using ANTS, and median PSIR intensities and T1 measured on all the ROIs. T1 was plotted versus PSIR intensity, and data linearly fitted.
RESULTS
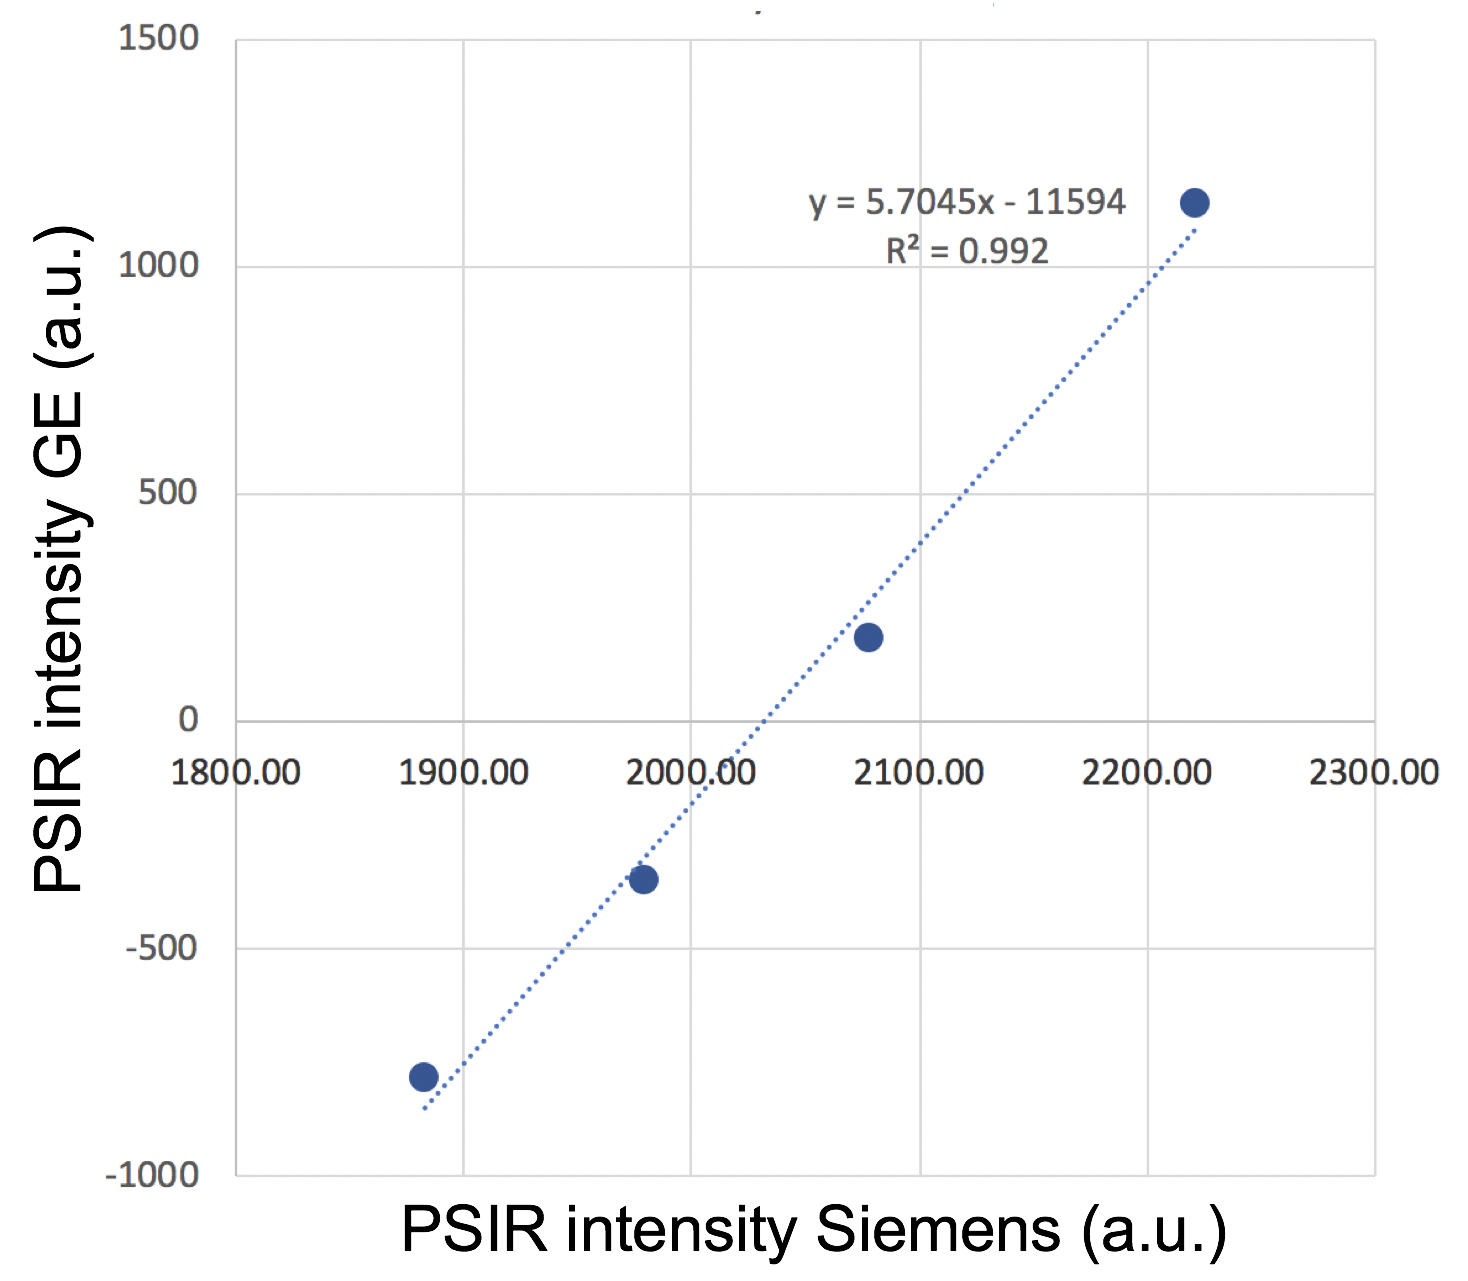
Phantom experimentPhantom T1 average values on the insets on all the Siemens acquisitions were 466.8(16.3)ms, 622.0(17.8)ms, 769.3(23.4)ms and 957.9(26.7)ms. Average T1 and PSIR intensities on two Skyra different sessions differed by, respectively, 5.38% and 1.12% and by 0.11% and 0.03% on the Skyra test-retest acquisitions. Second acquisition on the Skyra and Prisma differed by 0.12% for both metrics. The R2 for a quadratic fit of all Siemens data was 1 (Figure 2), while 0.980 for a linear fit (data not shown). Data acquired on GE and Siemens had an almost perfect linear relationship (Discovery MR750 and Skyra scans example in Figure 3). The R2 for the linear fit was 0.992.
In-vivo experiment
A total of 116 ROIs were drawn on data of the 54 MS patients (54 WM and GM, and 8 lesions). T1 and PSIR intensity were strongly correlated (the R2 for a linear fit was 0.666 (Figure 5)).
DISCUSSION
- Phantom’s T1 measurements were consistent with what expected at 3T; MS patients’ data were consistent with previous in-vivo measurements.5,6- All the Siemens T1 versus PSIR intensity lied on a quadratic curve suggesting that the two techniques give consistent information.
- PSIR intensities on scanners of different brands are recorded in different scales, but are linked by linear relationships.
- Acquisitions on patients are affected by motion, and T1 to PSIR co-registrations may have small misalignments, therefore it is not surprising that correlations between T1 and PSIR intensities were weaker on patients than in phantom scans.
CONCLUSION
- Reliable T1 mapping is feasible using fast single slice 2D IR TrueFISP methods easily available.- 2D PSIR image intensities correlate with T1 values, and the correlation is best described by a quadratic model, but a linear model can also be used.
- 2D PSIR image intensity between different scanners can be scaled linearly and the scaling factors determined from calibration with phantoms.
- The clinically feasible 2D PSIR protocol can be used in-vivo on SC to obtain at the same time anatomical images with high WM/GM contrast and information related to the longitudinal relaxation time T1.
Acknowledgements
No acknowledgement found.References
1. Papinutto N, Asteggiano C, Bischof A, Gundel TJ, Caverzasi E, Stern WA, Bastianello S, Hauser SL, Henry RG. Intersubject Variability and Normalization Strategies for Spinal Cord Total Cross-Sectional and Gray Matter Areas. J Neuroimaging. 2019 Sep 30. doi: 10.1111/jon.12666. [Epub ahead of print]
2. Olney NT, Bischof A, Rosen H, Caverzasi E, Stern WA, Lomen-Hoerth C, Miller BL, Henry RG, Papinutto N. Measurement of spinal cord atrophy using phase sensitive inversion recovery (PSIR) imaging in motor neuron disease. PLoS One. 2018 Nov 29;13(11):e0208255. doi: 10.1371/journal.pone.0208255.
3. Schlaeger R, Papinutto N, Panara V, et al. Spinal cord gray matter atrophy correlates with multiple sclerosis disability. Ann Neurol. 2014;76(4):568-580.
4. Wheeler-Kingshott CA, Stroman PW, Schwab JM, Bacon M, Bosma R, Brooks J, Cadotte DW, Carlstedt T, Ciccarelli O, Cohen-Adad J, Curt A, Evangelou N, Fehlings MG, Filippi M, Kelley BJ, Kollias S, Mackay A, Porro CA, Smith S, Strittmatter SM, Summers P, Thompson AJ, Tracey I. The current state-of-the-art of spinal cord imaging: applications. Neuroimage. 2014 Jan 1;84:1082-93.
5. Battiston M, Schneider T, Prados F, Grussu F, Yiannakas MC, Ourselin S, Gandini Wheeler-Kingshott CAM, Samson RS. Fast and reproducible in vivo T(1) mapping of the human cervical spinal cord. Magn Reson Med. 2018 Apr;79(4):2142-2148. doi: 10.1002/mrm.26852.
6. Smith SA, Edden RA, Farrell JA, Barker PB, Van Zijl PC. Measurement of T1 and T2 in the cervical spinal cord at 3 tesla. Magn Reson Med. 2008 Jul;60(1):213-9. doi: 10.1002/mrm.21596.
7. Stikov N, Boudreau M, Levesque IR, Tardif CL, Barral JK, Pike GB. On the accuracy of T1 mapping: searching for common ground. Magn Reson Med. 2015 Feb;73(2):514-22. doi: 10.1002/mrm.25135.
8. Papinutto N, Henry RG. Evaluation of Intra- and Interscanner Reliability of MRI Protocols for Spinal Cord Gray Matter and Total Cross-Sectional Area Measurements. J Magn Reson Imaging. 2019 Apr;49(4):1078-1090. doi: 10.1002/jmri.26269.
9. Deichmann R, Haase A, Quantification of T1 values by SNAPSHOT-FLASH NMR Imaging, J Magn Reson 1992; 96: 608-12.
Figures