1404
Evaluation of DTI Indices in the Cervical Spinal Cord as Markers of Sensorimotor Impairment in MS Patients with Mild Disability1Department of Radiology and Radiological Sciences, Vanderbilt University Medical Center, Nashville, TN, United States, 2Vanderbilt University Institute of Imaging Science, Vanderbilt University Medical Center, Nashville, TN, United States, 3Meharry School of Medicine, Meharry Medical College, Nashville, TN, United States, 4Department of Biomedical Engineering, Vanderbilt University, Nashville, TN, United States, 5Department of Neurology, Vanderbilt University Medical Center, Nashville, TN, United States
Synopsis
Spinal cord pathology is integral to disease symptoms and progression in multiple sclerosis (MS), but imaging methods developed and optimized for studying the spinal cord in vivo with clinically relevant scan times are lacking. Here, we applied a clinically feasible diffusion tensor imaging (DTI) sequence to examine relationships between imaging measures of microstructural damage in the spinal cord and lower extremity functional deficits in low-disability, relapsing-remitting MS patients. Our results show significant correlations between gray matter radial diffusivity and measures of sensation and motor function.
Introduction
Axonal damage in the spinal cord (SC) causes neurological deficits in multiple sclerosis (MS), but there is a lack of imaging techniques targeting microscopic SC pathology. Diffusion tensor imaging (DTI) probes tissue microstructure through four quantitative indices: fractional anisotropy, mean diffusivity, axial diffusivity, and radial diffusivity,1 which are sensitive to axon density, axonal injury, and demyelination2-5 and have been applied to the SC in MS.6,7 Detection of SC pathology in MS with DTI and examination of relationships with clinical measures is often focused on white matter (WM) tracts,8 but microstructural changes in gray matter (GM) are also important.7 Here, we examine the potential for a clinically-feasible (~6.5min) SC DTI sequence to provide quantitative imaging biomarkers of lower extremity sensorimotor deficits in relapsing-remitting MS patients with mild disability.Methods
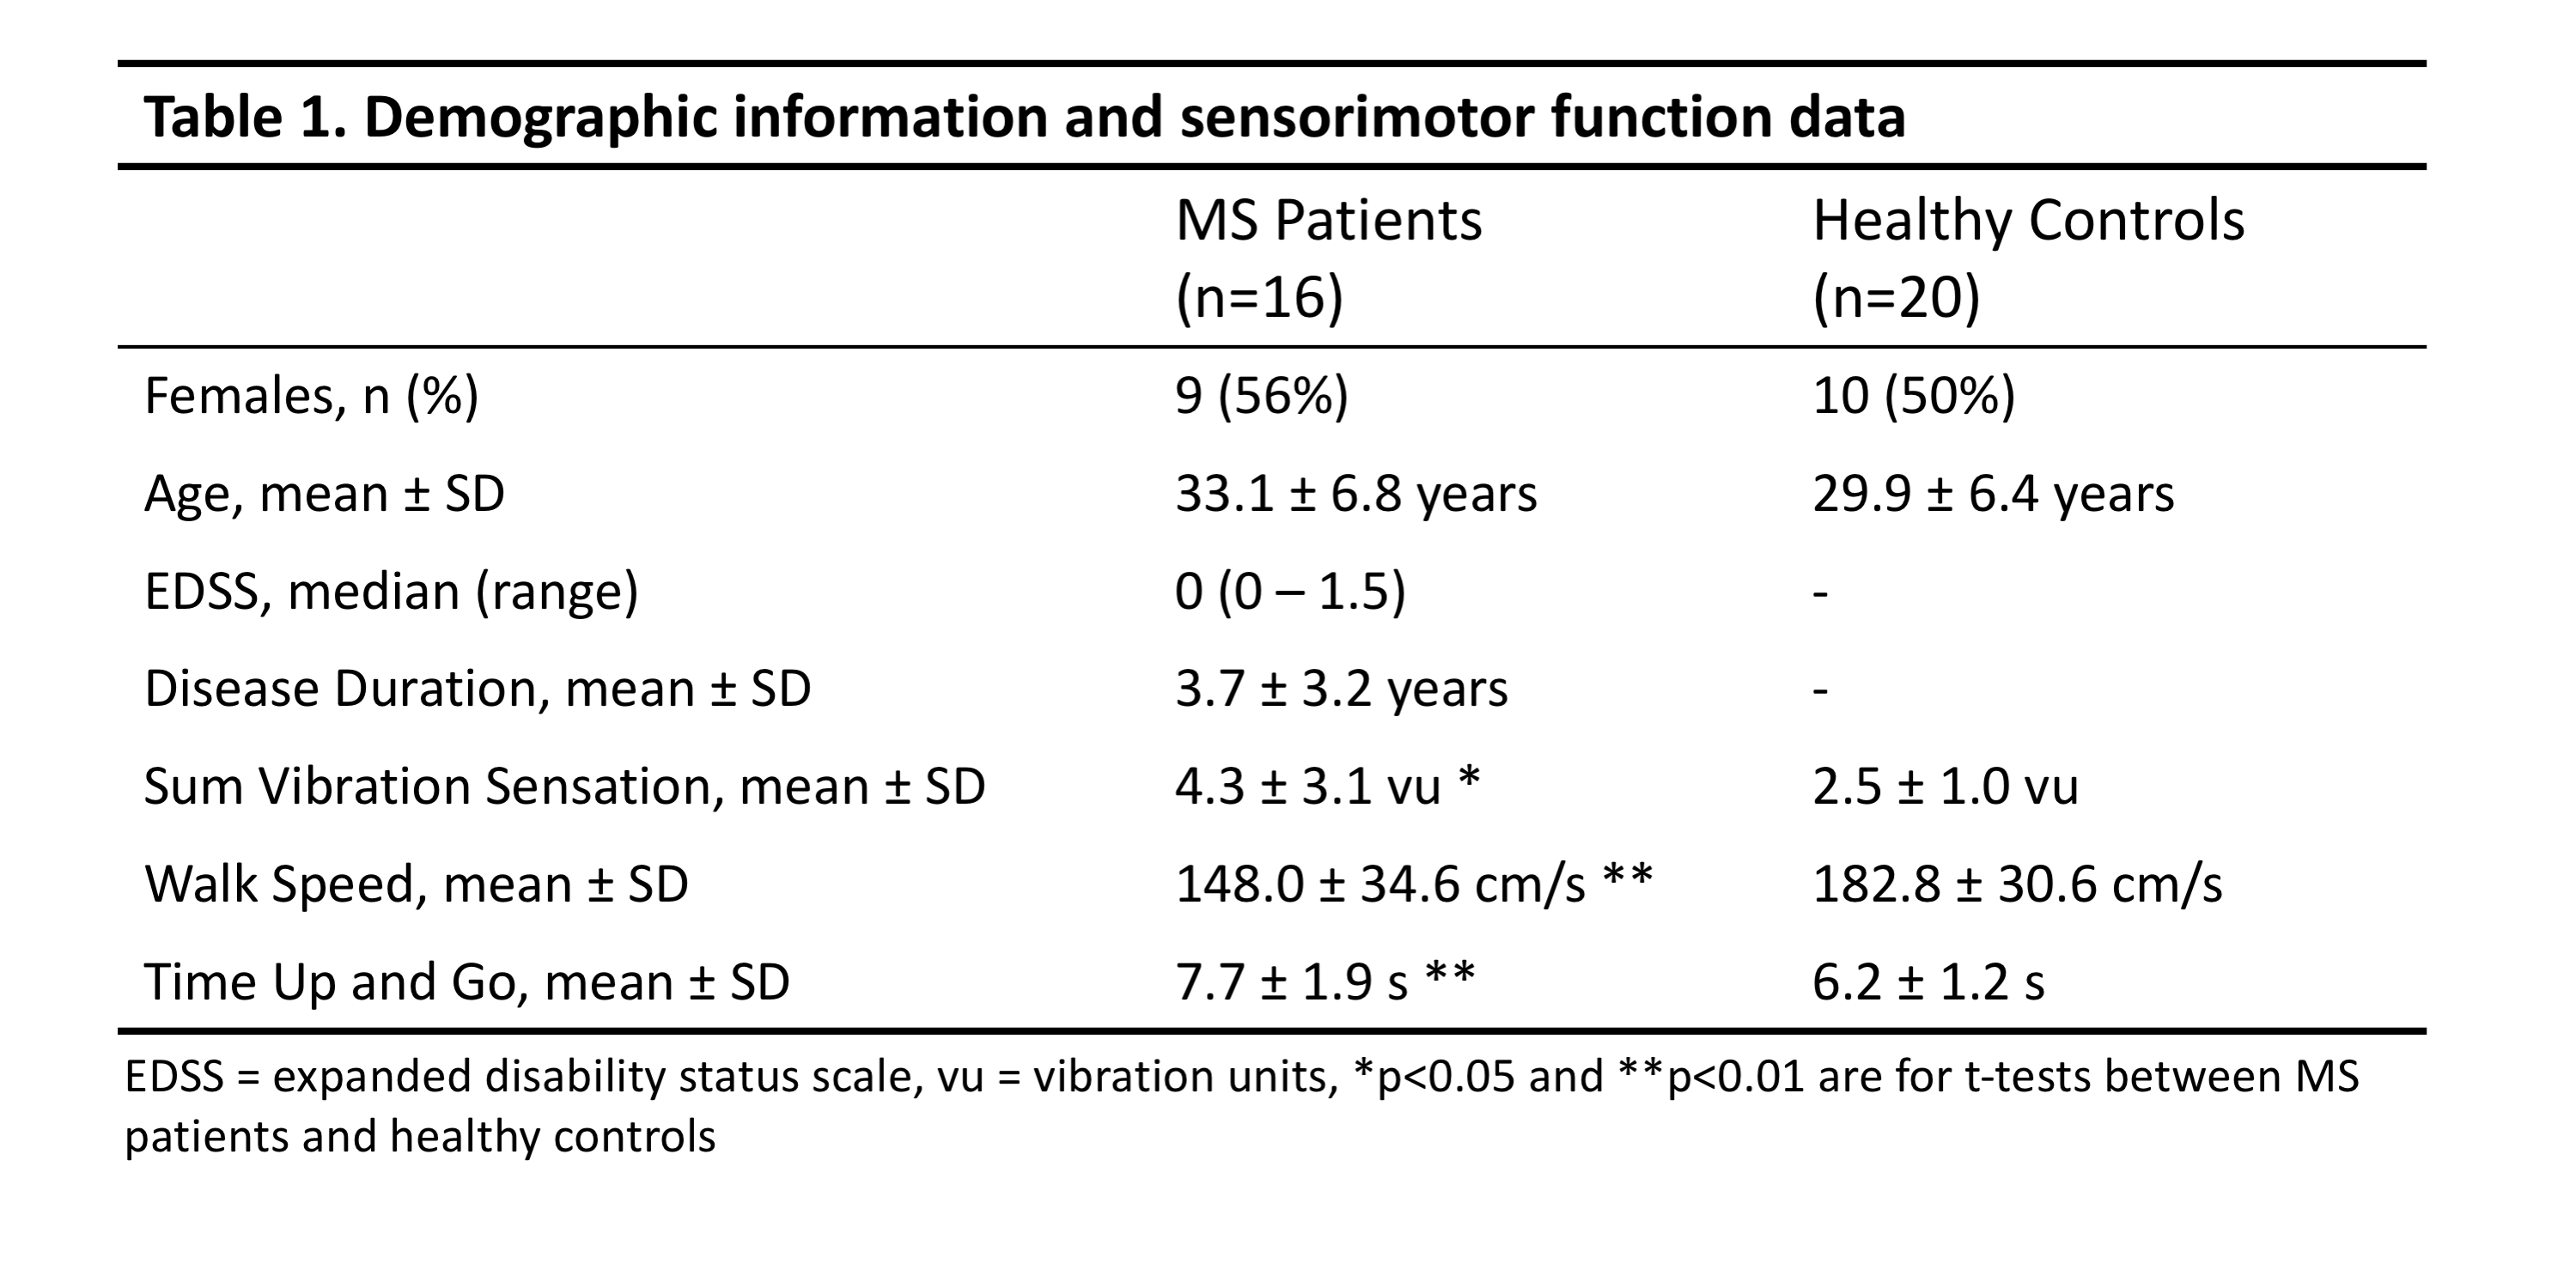
After signed, informed consent, 16 minimally impaired patients with relapsing-remitting MS (RRMS) and 20 healthy controls participated in this study (demographics, Table 1). Imaging was performed using a 3T MR scanner (Philips Elition) with 2-channel transmit and a dStream HNS SENSE neurovascular coil (Philips) for reception. The diffusion sequence1 was acquired for 14 slices in the axial plane as a cardiac-triggered, reduced field-of-view (FOV), single-shot EPI centered at the C3/C4 level with the following parameters: FOV=80x57.5x70mm3, resolution=1.1x1.1x5mm3, SENSE (RL)=1.8, TR=5 beats (~4000ms), TE=77ms, averages=3. A single-shell acquisition was used with 15 directions at b=750s/mm2. A series of b=0s/mm2 images with reversed phase encoding was acquired for post-processing eddy current correction. A high resolution (0.65x0.65x5mm3) anatomical, multi-echo, gradient echo (mFFE) image was acquired (TR/TE1/ΔTE=700/8.0/9.2ms) for the same 14 axial slices for registration and segmentation. Sensorimotor function was assessed using the timed 25-foot walk, timed up and go test (TUG), and great-toe vibration sensation (Vibratron II).The diffusion-weighted images were corrected for B0 susceptibility distortions, motion, and eddy currents using the TOPUP and EDDY algorithms from the FSL toolbox.9 Analysis of the DTI data using FSL produced the following indices: fractional anisotropy (FA), axial diffusivity (AD), radial diffusivity (RD), and mean diffusivity (MD).
GM and WM were automatically segmented on the mFFE using SCT Propseg and Deepseg (v. 4.0.0).10,11 Lesions were delineated manually on the anatomical images by a neuroradiologist using MIPAV (NIH). The DTI b0 image and all associated parameters were registered to the mFFE using SCT multimodal registration to align DTI maps with the tissue labels.
Mean and median FA, AD, RD, and MD were quantified for the whole cord, GM, WM, and WM lesion voxels contained within slices 3-12 (most superior/inferior slices discarded due to distortion) for all subjects (lesions in MS only). A Wilcoxon rank sum test was performed to compare DTI indices between controls and patients. In patients, associations between DTI indices and clinical/sensorimotor measures were examined with a Spearman’s partial correlation corrected for age and disease duration.
Results
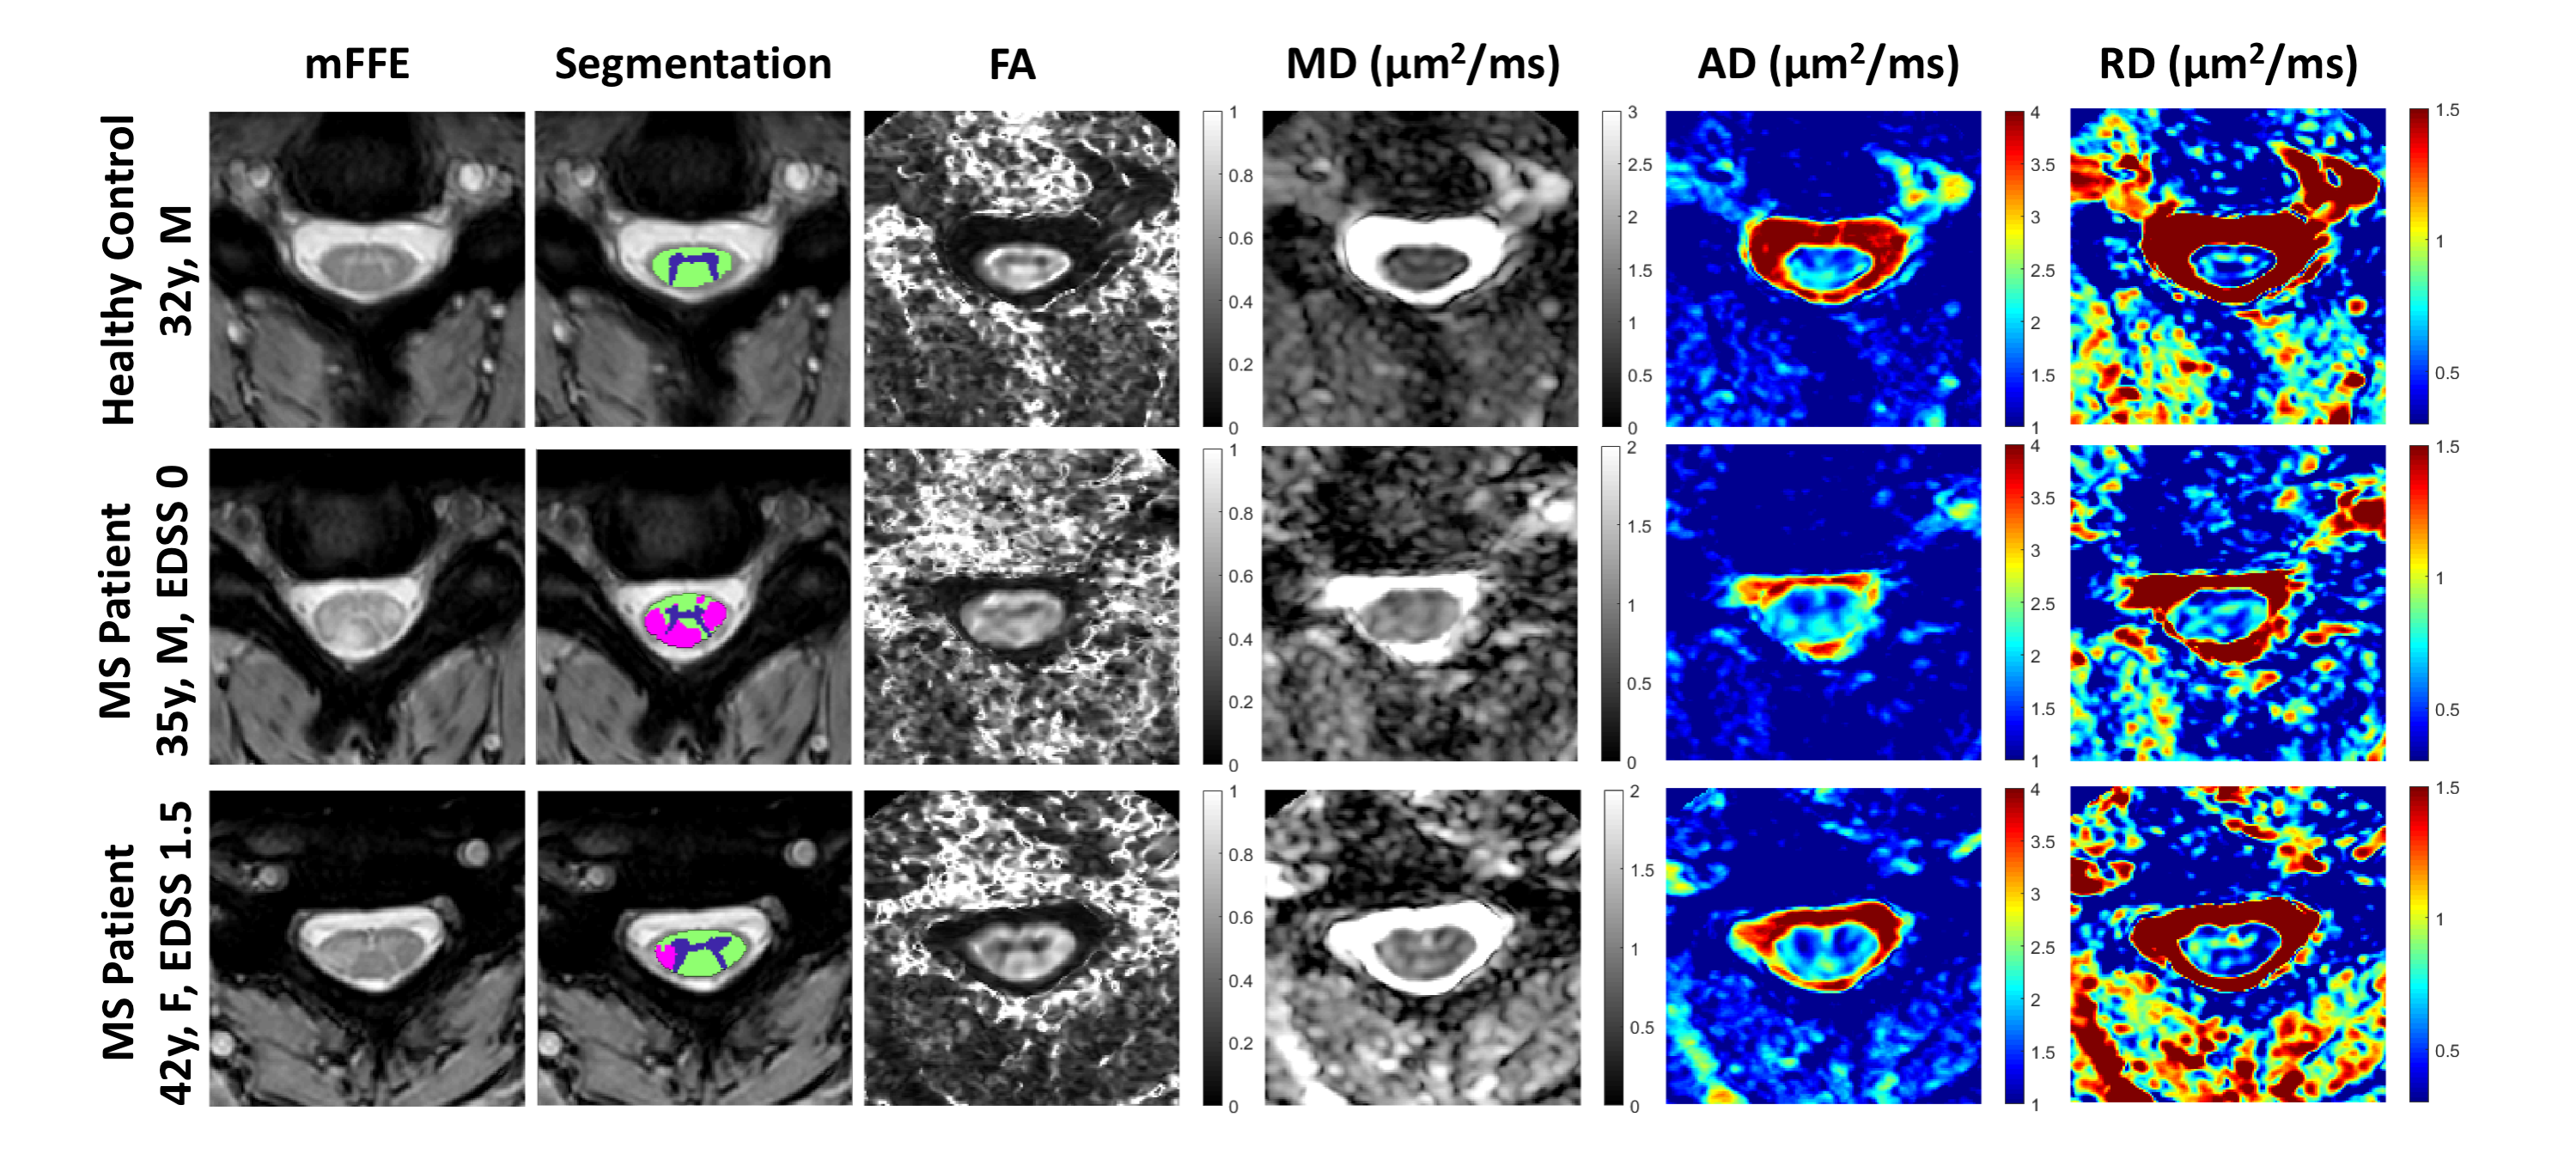
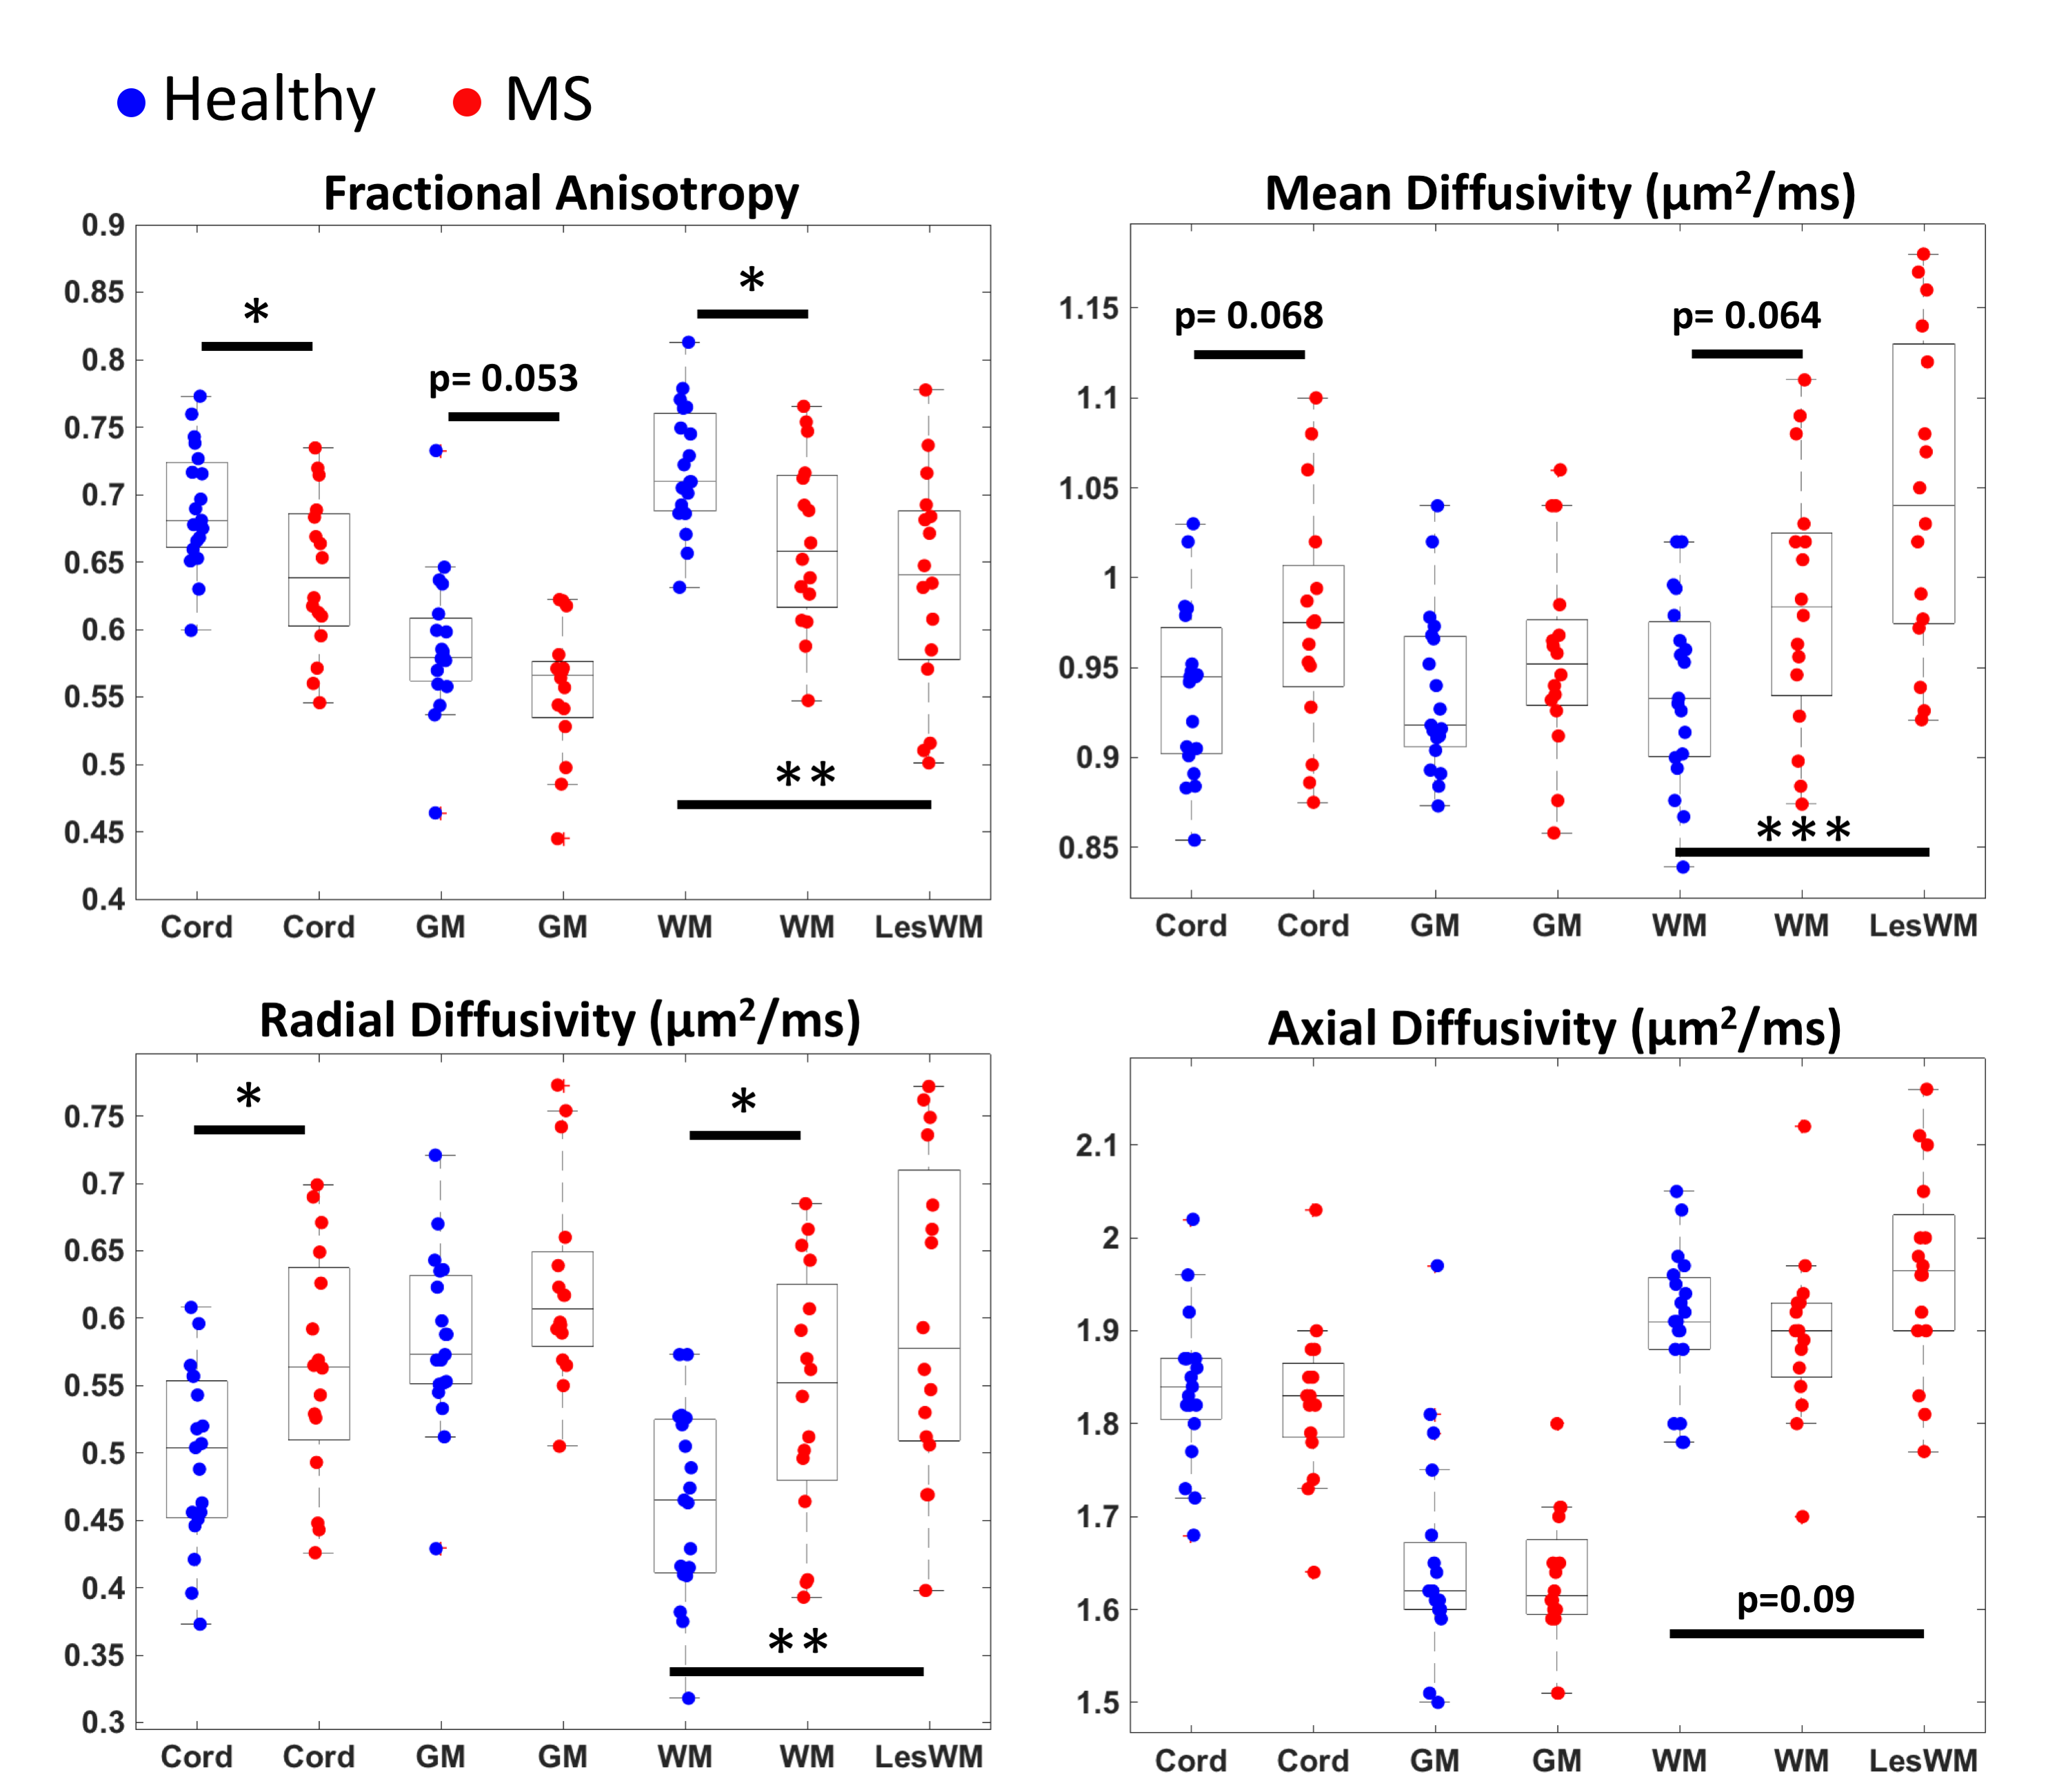
All measurements of sensorimotor function performed at the time of the scan differ significantly between patients and controls (Table 1).Representative qualitative differences in DTI indices between a control and two MS patients are shown in Figure 1 and are especially prominent within lesions. These indices are quantified for each tissue type in Figure 2. Significant differences between cohorts are apparent, including decreased FA and increased RD in patients (p<0.05). MD differs significantly between control WM and patient WM lesions (p<0.05).
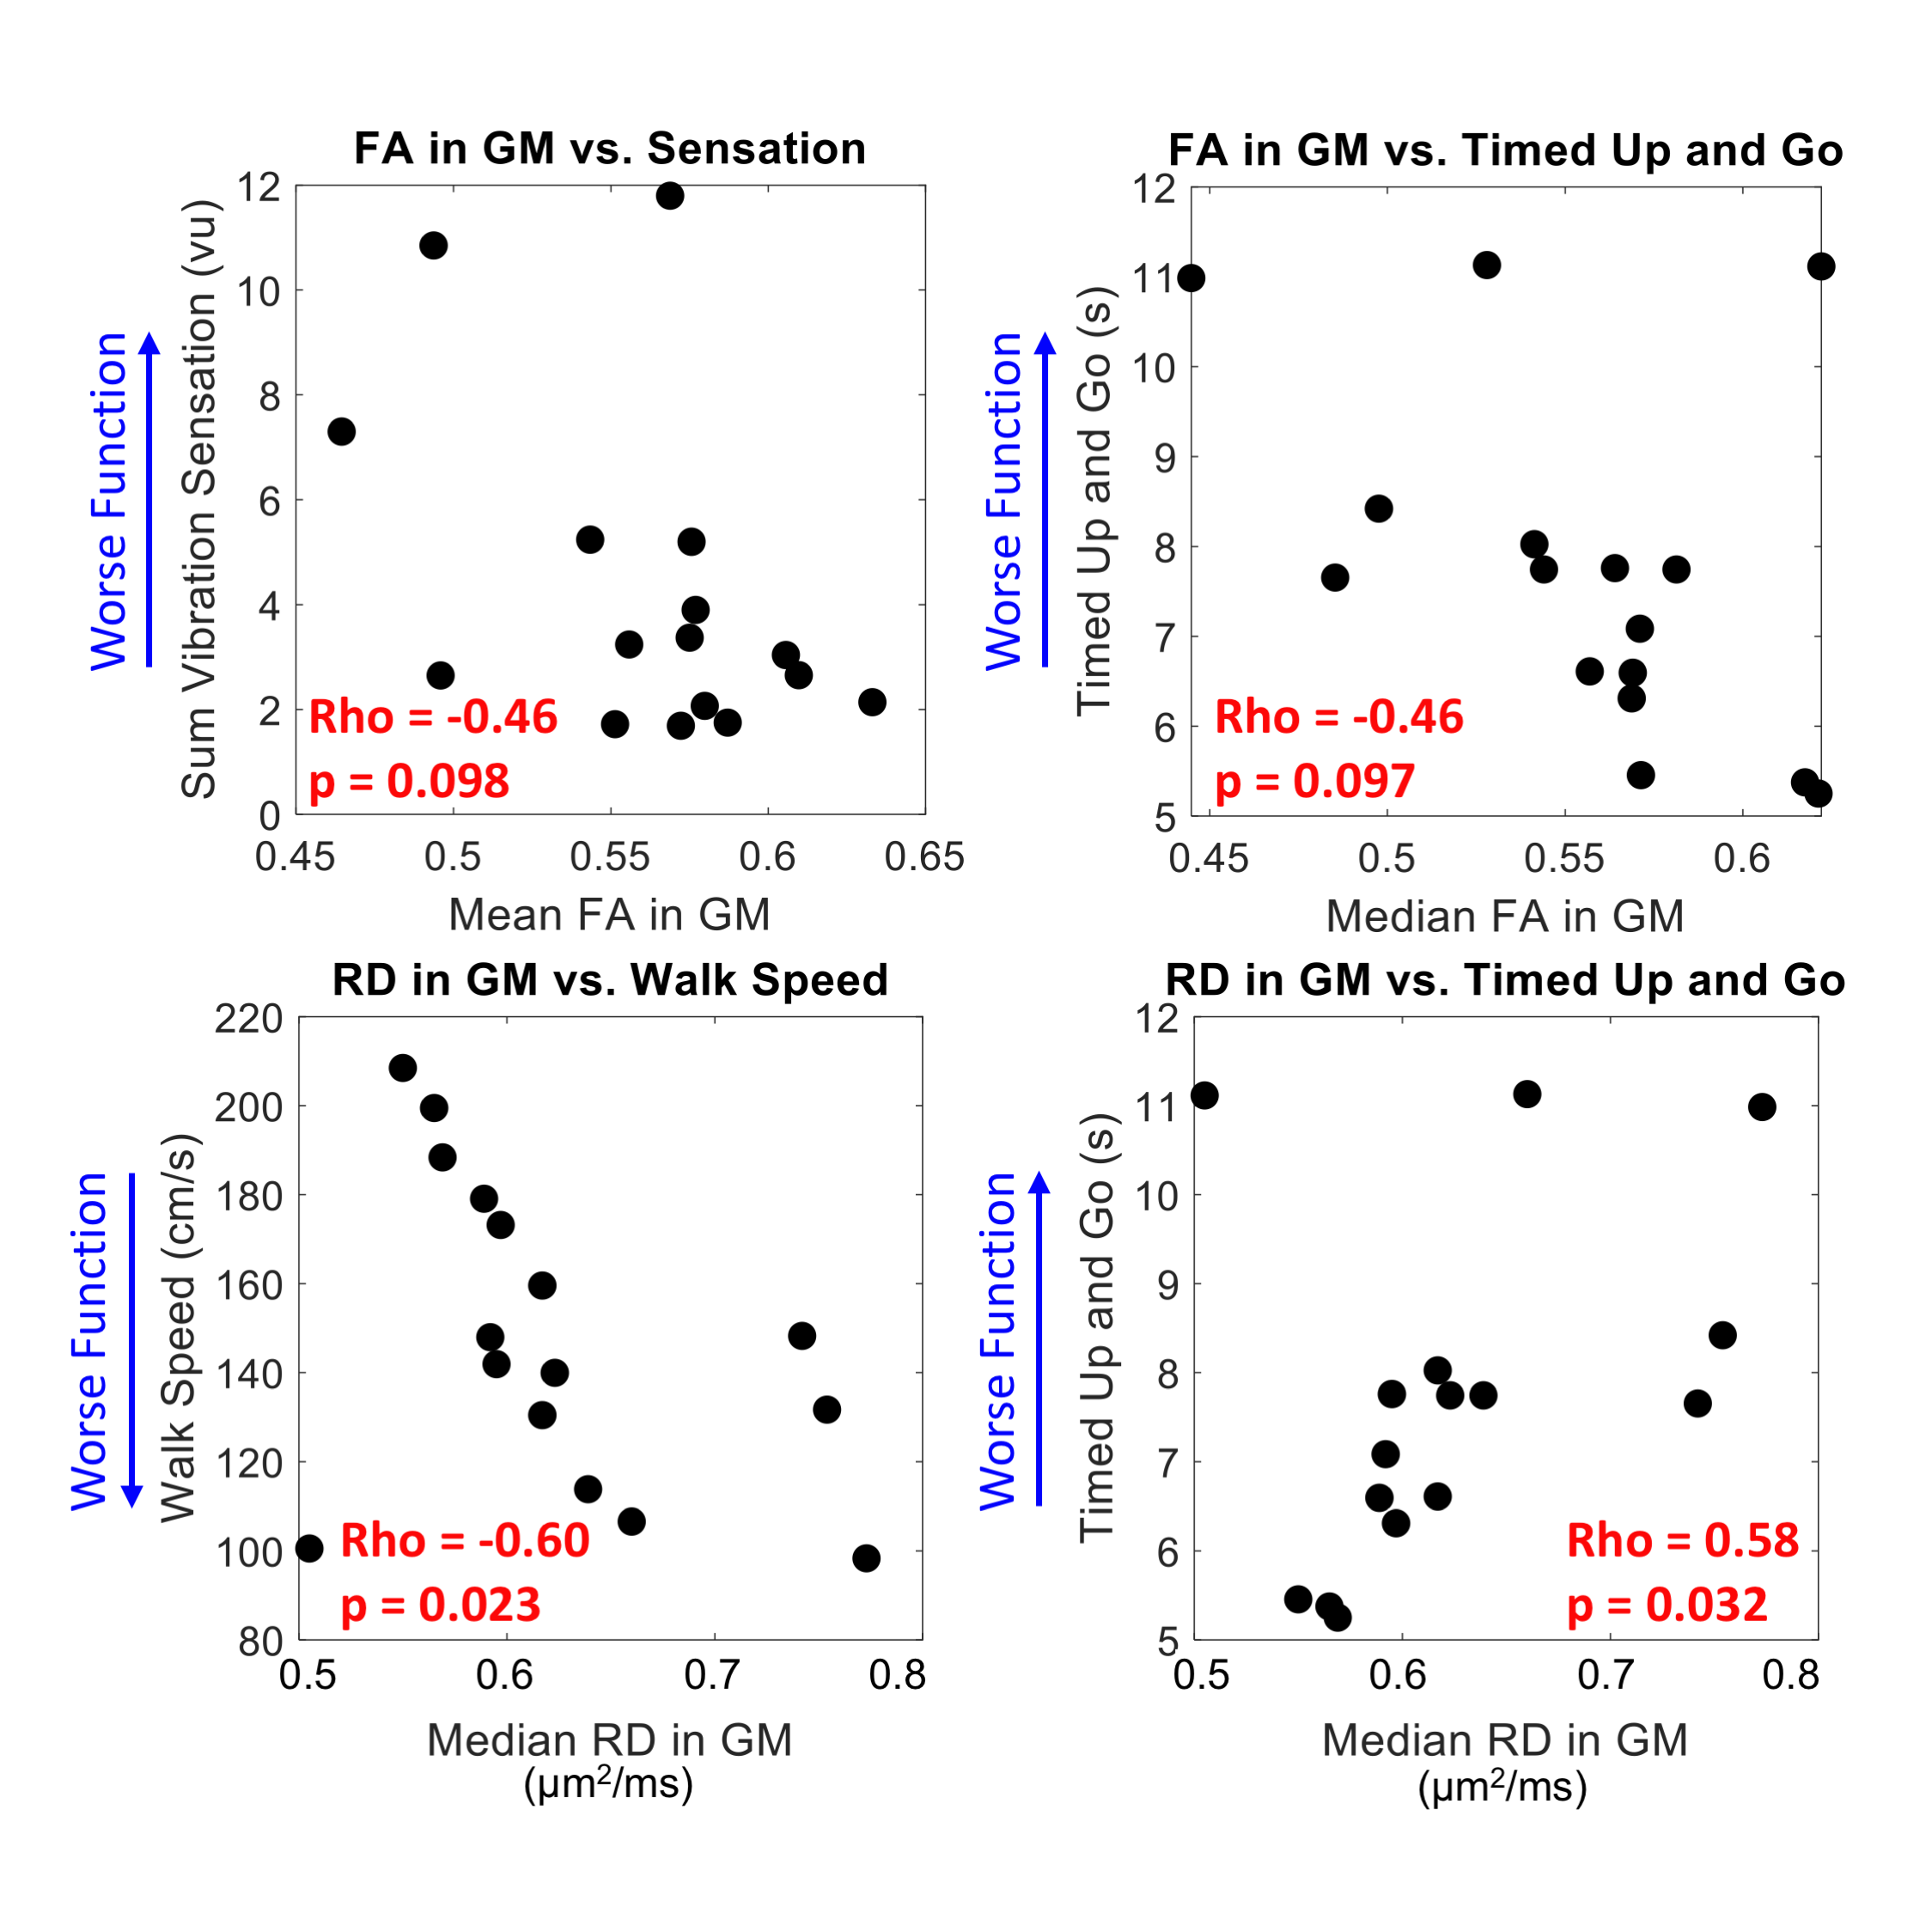
Two significant clinico-radiological correlations were identified: increased GM RD is associated with slower 25-foot walk and slower TUG (Figure 3, p<0.05). Lower FA in GM is associated with impaired vibration sensation and TUG (Figure 3, p<0.1), as well as slower walk speed (not shown). DTI indices for WM, WM lesions, and whole cord averages did not correlate significantly with these sensorimotor measures. Expanded Disability Status Scale (EDSS) scores did not correlate significantly with DTI or sensorimotor measures.
Discussion and Conclusions
In order for clinical trials of re-myelinating therapies for MS to succeed, outcome measures sensitive to tissue microstructure that correlate with clinical MS features are needed.12 DTI is well-suited to meet this need because it provides quantitative measures of microstructure, is sensitive to MS pathology, and correlates with sensorimotor function. In this cohort of RRMS patients with confirmed SC involvement and low EDSS scores (≤1.5), we observed significant differences in FA, MD, and RD, with the most pronounced differences occurring between MS WM lesions and control WM. FA and RD in GM showed the strongest associations with sensorimotor function. The preliminary results from this ongoing study are in agreement with a prior report that GM RD correlates with physical disability7 and indicate that changes in SC GM tissue microstructure contribute to sensorimotor impairment in MS patients with overall mild disease burden.It is possible that further subdivision of WM using registration to the PAM5013 template space and examination of tracts most relevant to each sensorimotor test may reveal stronger correlations for WM DTI indices. Future work with acquisition of more b-values and/or diffusion times will enable multi-compartment diffusion modeling with greater specificity in microstructure characterization. Additionally, larger samples, repeated measurements, and inclusion of complementary MRI methods such as quantitative magnetization transfer and chemical exchange saturation transfer will provide further insight into the clinical utility of these imaging indices as biomarkers of MS SC pathology.
Acknowledgements
We thank our study participants and the VUIIS MRI technologists. Funding sources: Conrad Hilton Foundation (SAS), National MS Society (SAS), NIH/NINDS 1R01NS109114-01 (SAS), NIH/NIBIB T32EB001628 (KGS), and VUMC Faculty Research Scholar Award (KPO).References
1. By S, Smith AK, Dethrage LM, et al. Quantifying the impact of underlying measurement error on cervical spinal cord diffusion tensor imaging at 3T. J Magn Reson Imaging 2016; 44: 1608-1618. DOI: 10.1002/jmri.25308.
2. Schilling KG, By S, Feiler HR, et al. Diffusion MRI microstructural models in the cervical spinal cord - Application, normative values, and correlations with histological analysis. Neuroimage 2019; 201: 116026. DOI: 10.1016/j.neuroimage.2019.116026.
3. Budde MD, Xie M, Cross AH, et al. Axial diffusivity is the primary correlate of axonal injury in the experimental autoimmune encephalomyelitis spinal cord: a quantitative pixelwise analysis. The Journal of neuroscience : the official journal of the Society for Neuroscience 2009; 29: 2805-2813. DOI: 10.1523/JNEUROSCI.4605-08.2009.
4. Klawiter EC, Schmidt RE, Trinkaus K, et al. Radial diffusivity predicts demyelination in ex vivo multiple sclerosis spinal cords. Neuroimage 2011; 55: 1454-1460. DOI: 10.1016/j.neuroimage.2011.01.007.
5. Song SK, Yoshino J, Le TQ, et al. Demyelination increases radial diffusivity in corpus callosum of mouse brain. Neuroimage 2005; 26: 132-140. DOI: 10.1016/j.neuroimage.2005.01.028.
6. Moccia M, Ruggieri S, Ianniello A, et al. Advances in spinal cord imaging in multiple sclerosis. Therapeutic advances in neurological disorders 2019; 12: 1756286419840593. DOI: 10.1177/1756286419840593.
7. Kearney H, Schneider T, Yiannakas MC, et al. Spinal cord grey matter abnormalities are associated with secondary progression and physical disability in multiple sclerosis. J Neurol Neurosurg Psychiatry 2015; 86: 608-614. DOI: 10.1136/jnnp-2014-308241.
8. Naismith RT, Xu J, Klawiter EC, et al. Spinal cord tract diffusion tensor imaging reveals disability substrate in demyelinating disease. Neurology 2013; 80: 2201-2209. DOI: 10.1212/WNL.0b013e318296e8f1.
9. Smith SM, Jenkinson M, Woolrich MW, et al. Advances in functional and structural MR image analysis and implementation as FSL. Neuroimage 2004; 23 Suppl 1: S208-219. DOI: 10.1016/j.neuroimage.2004.07.051.
10. De Leener B, Levy S, Dupont SM, et al. SCT: Spinal Cord Toolbox, an open-source software for processing spinal cord MRI data. Neuroimage 2017; 145: 24-43. DOI: 10.1016/j.neuroimage.2016.10.009.
11. De Leener B, Kadoury S and Cohen-Adad J. Robust, accurate and fast automatic segmentation of the spinal cord. Neuroimage 2014; 98: 528-536. DOI: 10.1016/j.neuroimage.2014.04.051.
12. Mallik S, Samson RS, Wheeler-Kingshott CA, et al. Imaging outcomes for trials of remyelination in multiple sclerosis. J Neurol Neurosurg Psychiatry 2014; 85: 1396-1404. DOI: 10.1136/jnnp-2014-307650.
13. De Leener B, Fonov VS, Collins DL, et al. PAM50: Unbiased multimodal template of the brainstem and spinal cord aligned with the ICBM152 space. Neuroimage 2018; 165: 170-179. DOI: 10.1016/j.neuroimage.2017.10.041.
Figures