1403
Cervical cord myelin abnormality is associated with clinical disability in multiple sclerosis1Radiology, University of British Columbia, Vancouver, BC, Canada, 2International Collaboration on Repair Discoveries (ICORD), University of British Columbia, Vancouver, BC, Canada, 3Medicine (Neurology), University of British Columbia, Vancouver, BC, Canada, 4Physics and Astronomy, University of British Columbia, Vancouver, BC, Canada, 5Pathology and Laboratory Medicine, University of British Columbia, Vancouver, BC, Canada, 6School of Biomedical Engineering, University of British Columbia, Vancouver, BC, Canada
Synopsis
Damage to the spinal cord is common in multiple sclerosis (MS) and is an important contributor to physical disability. While spinal cord cross sectional area (CSA) is correlated with disability, CSA is a non-specific measure of tissue damage. The addition of cervical cord myelin water imaging, which measures myelin-related abnormalities, to cord area resulted in better correlations with MS clinical disability than cord CSA alone. In particular, myelin abnormality + CSA was best correlated with 9-hole peg test which requires more fine motor skills and therefore could be strongly influenced by damage to white matter.
Introduction
Damage to the spinal cord is common in multiple sclerosis (MS) and is an important contributor to physical disability.1 MRI can assess spinal cord changes, but application of advanced techniques has lagged behind brain studies due to inherent challenges with cord imaging and lack of available analysis tools.2 Advances such as faster scanning with motion correction, improved scanner hardware and better analysis techniques have now made imaging of spinal cord more feasible. While spinal cord cross sectional area (CSA) at C2/3, in particular grey matter area, is correlated with disability,3 CSA is a non-specific measure of tissue damage. Recently myelin water imaging, which provides a quantitative measurement of myelin (myelin water fraction, MWF),4,5 has been optimized for spinal cord.6 Usually, the mean MWF over a region of interest (ROI) is reported, however, if damage occurs in only part of the ROI, the change in mean MWF may be negligible. Further, natural variation in baseline mean myelin levels between individuals may obscure relationships between myelin loss and clinical measures. Calculating the MWF variance over the ROI could help capture small changes. By combining the MWF mean and variance in a new variable, the myelin heterogeneity index (MHI) equal to the MWF standard deviation divided by the mean, we hope to increase sensitivity to disease-associated myelin changes7 and study myelin abnormalities in the cervical cord.Objectives
(1) To investigate the relationship between MHI and MS clinical measures and (2) to assess if MHI, when added to cord area, explains more of the variability in MS clinical measures than cord area alone.Methods
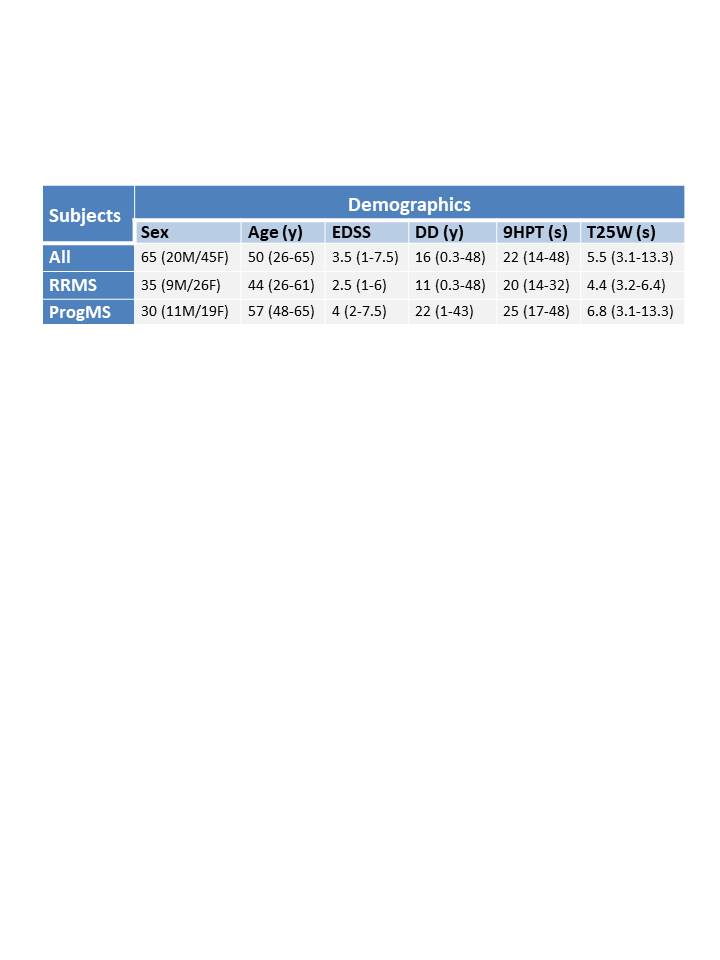
Subjects: 35 relapsing-remitting MS (RRMS) and 30 progressive MS (ProgMS) participants were scanned on a 3T Philips scanner (participant demographics in Figure 1). Clinical measures included disease duration (DD), Expanded Disability Status Scale (EDSS), timed 25-foot walk (T25W) and nine-hole peg test (9HPT).MR Experiments: Data were collected using a 6-element phased-array spine coil and included a 32-echo GRASE T2 relaxation (TE=10ms, TR=1501ms, 8 slices acquired at 0.75x0.75x5mm3 reconstructed to 16 slices at 0.63x0.63x2.5mm3, field of view (FOV)=180x150x40mm3, SENSE factor=2)6 and a high-resolution T2*-weighted multi-echo fast gradient echo (mFFE) sequence (5 echoes, TE1=6.5ms, ΔTE=8.2ms, TR=809ms, 16 slices, acquired at 0.8x0.8x2.5mm3 reconstructed to 0.3x0.3x2.5mm3, FOV=150x150x44mm3). Scans were centered at the level of the C2/C3 intervertebral disc with the image plane perpendicular to the longitudinal axis of the cord.
Data Analysis: Voxel-wise T2 distributions were calculated using a modified Extended Phase Graph algorithm combined with regularized non-negative least squares and flip angle optimization.8,9 (Code can be requested at https://mriresearch.med.ubc.ca/news-projects/myelin-water-fraction/.) MWF was defined as the fraction of signal with T2<40ms. Registration, segmentation and CSA calculation (whole cord (WC) and grey matter (GM)) were performed using Spinal Cord Toolbox.10 Whole cervical cord, white matter (WM) and GM masks were extracted from the mFFE image. The MWF mean and MHI were calculated within whole cord and WM for the 10 middle slices and then averaged for each person.
Statistics: Linear and multiple regression was used to assess relationships and variance explained between MRI measures and clinical variables. Adjusted coefficients of determination (r2) of p ≤ 0.01 were reported as significant.
Results
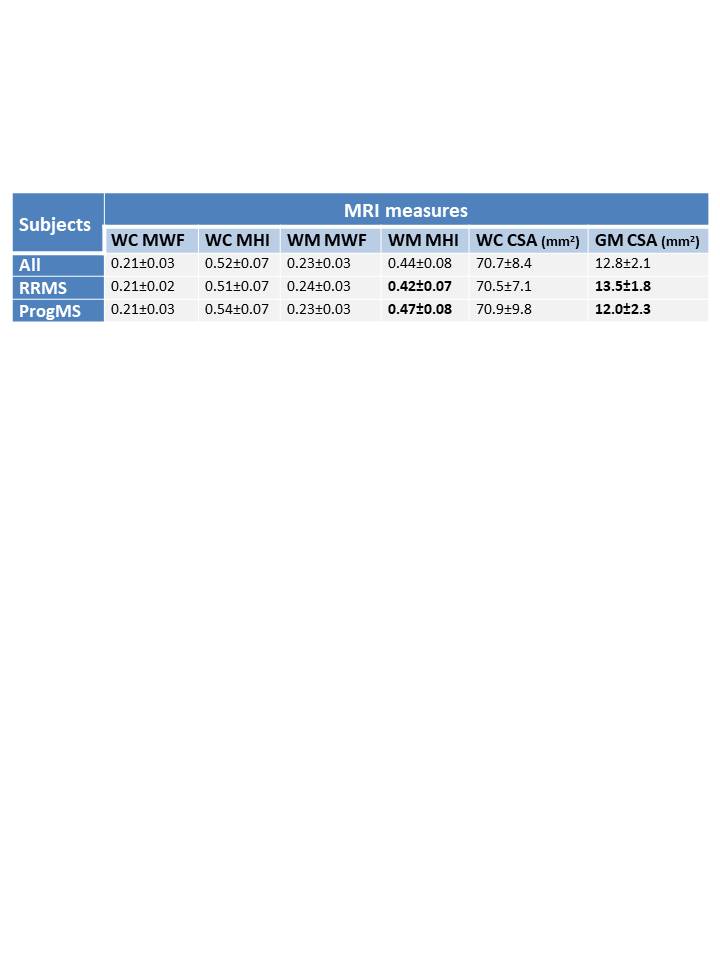
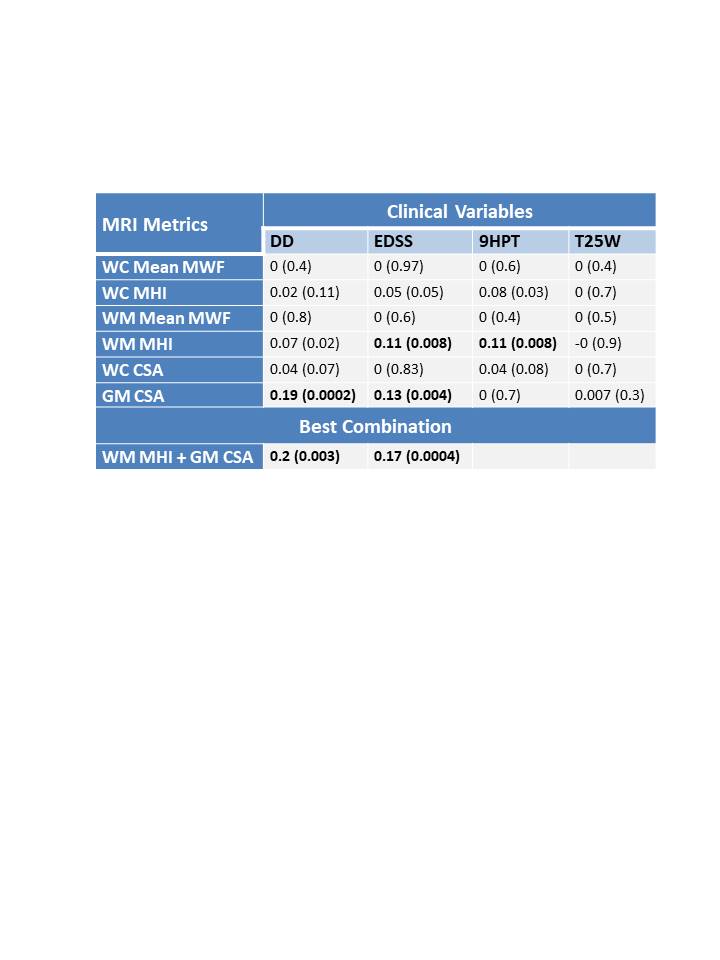
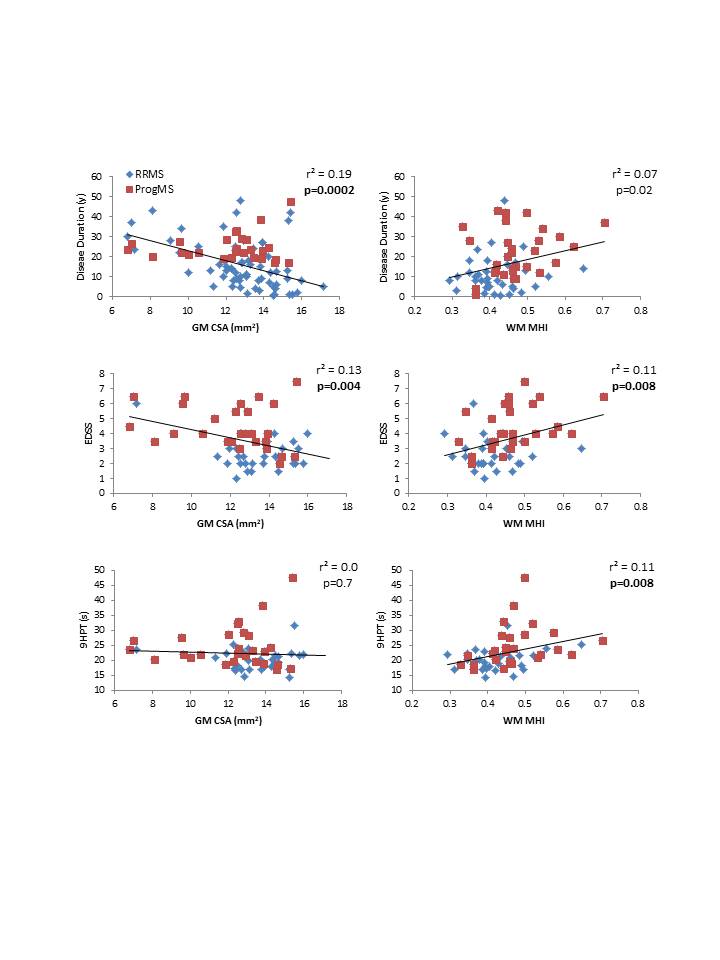
Mean MRI measures are listed in Figure 2. Significant differences were found between RRMS and ProgMS for WM MHI (p=0.007) and GM CSA (p=0.006). Coefficients of determination between spinal cord MRI measures and clinical variables are shown in Figure 3. WC CSA was not significantly correlated with any clinical variable whereas GM CSA was correlated with disease duration and EDSS (Figure 4). WM MHI was also better correlated with clinical variables than MHI in WC. Mean MWF was not correlated with any clinical measure. A combination of WM MHI and GM CSA produced the largest r2 for disease duration and EDSS. For 9HPT, the best correlation was with WM MHI and the addition of CSA did not improve r2 (Figure 4). T25W did not show correlations with any MRI metric.Discussion
Myelin abnormalities were more related to clinical measures within white matter than whole cord. Similarly, GM CSA was more strongly correlated with clinical measures than whole cord CSA, in agreement with previous work.3 For clinical measures, CSA was correlated with global measures such as disease duration and EDSS. MHI was correlated with 9HPT which requires more fine motor skills and therefore could be highly dependent on damage to white matter. The lack of correlation with T25W may be because walking is more localised to the thoracic cord rather than cervical cord. Separate correlation analyses of RRMS and ProgMS was not done in order to keep the number of data points and data range large. However, as seen in Figure 4, some of the correlations seem to be driven by one of the MS subtypes (e.g. 9HPT vs MHI more driven by ProgMS cohort).Conclusion
Cervical cord myelin abnormality in addition to cord area better predicts the variance in MS clinical disability than cord CSA alone. Using myelin water imaging, our study provides evidence that changes in myelin are linked to clinical measures and may provide a potential biomarker for disability and disease progression.Acknowledgements
We would like to thank the MS volunteers and the staff at the UBC MRI Research Centre. This study was funded by the Multiple Sclerosis Society of Canada.References
1. Krieger S, Lublin F. Location, location, location. Mult Scler. 2018;24:1396–1398.
2. Stroman PW, Wheeler-Kingshott C, Bacon M, et al. The current state-of-the-art of spinal cord imaging: Methods. Neuroimage 2014; 84: 1070-81.
3. Schlaeger R, Papinutto N, Panara V, Bevan C, Lobach IV, Bucci M, Caverzasi E, Gelfand JM, Green AJ, Jordan KM, Stern WA, von Büdingen HC, Waubant E, Zhu AH, Goodin DS, Cree BAC, Hauser SL, Henry RG. Spinal cord gray matter atrophy correlates with multiple sclerosis disability. Ann Neurol. 2014; 76: 568–580.
4. MacKay A, Whittall K, Adler J, et al. In vivo visualization of myelin water in brain by magnetic resonance. Magn Reson Med 1994; 31(6): 673-677.
5. Laule C, Kozlowski P, Leung E, et al. Myelin water imaging of multiple sclerosis at 7 T: correlations with histopathology. Neuroimage 2008; 40(4): 1575-1580.
6. Ljungberg E, Vavasour IM, Tam R, et al. Rapid myelin water imaging in human cervical spinal cord. Magn Reson Med 2016; 78: 1482-1487.
7. Abel S, Vavasour IM, Johnson P, Ristow S, Lee LE, Ackermans N, Chan J, Schabas A, Tam R, Kuan A, Morrow S, Wilken J, Sayao A-L, Devonshire V, Bhan V, Li DKB, Carruthers R, Traboulsee A, Kolind SH. Myelin damage in normal appearing white matter (NAWM) contributes to cognitive impairment in MS. ECTRIMS 2019; p 535.
8. Prasloski T, Mädler B, Xiang Q-S, et al. Applications of stimulated echo correction to multicomponent T2 analysis. Magn Reson Med 2012; 67: 1803–1814.
9. Whittall KP and MacKay AL. Quantitative interpretation of NMR relaxation data. J Magn Reson 1989; 84: 134–152.
10. De Leener B, Lévy S, Dupont SM, et al. SCT: Spinal Cord Toolbox, an open-source software for processing spinal cord MRI data. Neuroimage 2017; 145: 24-43.
Figures