1401
A pilot in vivo investigation of peripheral nerve damage in multiple sclerosis using magnetisation transfer ratio1Queen Square MS Centre, Department of Neuroinflammation, UCL Queen Square Institute of Neurology, Faculty of Brain Sciences, University College London, London, United Kingdom, 2Centre for Medical Image Computing, Department of Computer Science, University College London, London, United Kingdom, 3Philips Healthcare, Guildford, Surrey, United Kingdom, 4Philips Japan, Minatoku, Tokyo, Japan, 5Centre for Medical Image Computing, Medical Physics and Biomedical Engineering, University College London, London, United Kingdom, 6Universitat Oberta de Catalunya, Barcelona, Spain, 7Brain MRI 3T Research Centre, IRCCS Mondino Foundation, Pavia, Italy, 8Department of Brain and Behavioural Sciences, University of Pavia, Pavia, Italy
Synopsis
Evidence from histopathological studies has demonstrated the involvement of the peripheral nervous system in multiple sclerosis (MS), specifically alteration in myelin content and, to a lesser extent, axonal degeneration. However, evidence from objective investigations in vivo is lacking. In this pilot study, the lumbar plexus and the sciatic nerve are investigated in people with MS using a previously optimised magnetisation transfer ratio (MTR) protocol developed in healthy controls. Results demonstrate reduced MTR values in both anatomical regions studied, consistent with histopathological data, and as such highlighting a need for further investigations in a larger sample population.
INTRODUCTION
Multiple sclerosis (MS) has traditionally been regarded as a disorder confined to the central nervous system (CNS). However, neuropathological and biopsy reports have demonstrated that the peripheral nervous system (PNS) may also be involved, with demyelination and, to a lesser extent, axonal degeneration representing the main pathophysiological mechanisms1-4. Understanding the involvement of PNS in MS not only can help elucidate some of the discrepancies observed between clinical symptoms and damage to the CNS, but can potentially pave the way for tailored treatments, hence improving quality of life. Given the neuropathological evidence that demyelination is the main pathophysiological mechanism involved in the PNS in MS, it was hypothesised that magnetisation transfer ratio (MTR), which has been shown to be directly influenced by the amount of myelin in neural tissue, would also be a sensitive metric detecting PNS involvement in MS. In this proof of concept study, we investigated the lumbar plexus and the sciatic nerve of people with MS, as these regions have previously been shown to have extensive pathological changes3,4.METHOD
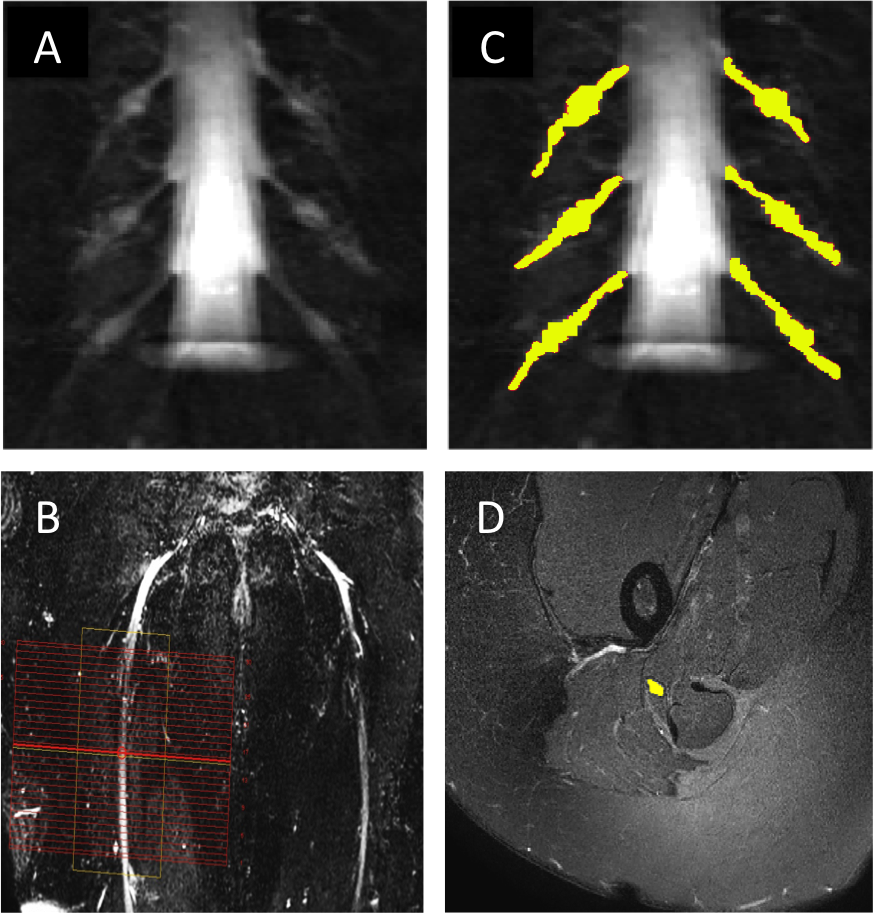
1) Participants: Six healthy controls (HCs) (mean age 33.5 years, 4 female, range 30-38) and five people with relapsing remitting MS (RRMS) (mean age 39.8 years, 4 female, range 30-53) were recruited. Informed consent was obtained from all participants and the study was approved by local ethics; 2) MR imaging: Using a Philips Ingenia CX 3T with 28-channel anterior and posterior coils, the lumbosacral spine was imaged in the coronal plane using the 3D SHINKEI sequence for optimum visualisation of the lumbar plexus5,6, as follows: TR = 2200 ms; TE = 180 ms, FOV = 280 × 280 mm2, voxel size = 1 x 1 x 1 mm3, number of averages = 1, TSE factor = 56, improved motion-sensitized driven-equilibrium (iMSDE) duration = 50 ms, 81 slices, scanning time of 08:52 min. The imaging volume covered the L2-L5 segments in all subjects (Figure 1A). MTR imaging was performed using identical scan geometry to the 3D SHINKEI acquisition as follows: 3D FFE dual-echo (TR / TE1 / TE2 = 40 / 2.5 / 4.5 ms; flip angle α = 10°), with and without Sinc - Gaussian shaped MT saturation pulses with nominal α = 360°; offset frequency = 1 KHz, and duration 16 ms; number of slices = 81; FOV = 180 x 180 mm2; voxel size = 1 x 1 x 1 mm3; scanning time of 5:56 min. The 3D SHINKEI sequence was subsequently repeated at a more inferior location with a larger FOV to locate the sciatic nerves and to facilitate planning of high-resolution fat-suppressed T2-weighted and MTR acquisitions in the axial plane (Figure 1B). Acquisition parameters for the fat-supressed T2-weighted scan were as follows: TR = 5000 ms; TE = 60 ms, FOV = 180 × 180 mm2, voxel size = 0.5 x 0.5 x 4 mm3, number of averages = 1, TSE factor = 11, 30 slices, scanning time of 08:08 min. MTR imaging was performed using identical scan geometry to the T2-weighted acquisition as follows: 3D FFE dual-echo (TR / TE1 / TE2 = 40 / 2.5 / 4.5 ms; flip angle α = 10°), with and without Sinc - Gaussian shaped MT saturation pulses with nominal α = 360°; offset frequency = 1 KHz, and duration 16 ms; number of slices = 30; FOV = 180 x 180 mm2; voxel size = 0.5 x 0.5 x 4 mm3; scanning time of 5:56 min; 3) Image analysis: Image segmentation was performed manually in FSLview (http://www.fmrib.ox.ac.uk/fsl/). For the lumbar plexus, each lumbar segment (L2-L5) was manually segmented on the 3D SHINKEI images (Figure 1C). All MTR volumes were registered to their respective 3D SHINKEI volumes using affine registration with NiftyReg7. The sciatic nerve was segmented manually on the fat-suppressed T2-weighted image (Figure 1D); 4) Statistical analysis: Statistical analysis was performed using SPSS 24.0 (SPSS, Chicago, Ill., USA). Differences in MTR values between HCs and people with RRMS were investigated for each anatomical region using independent samples t-test.RESULTS
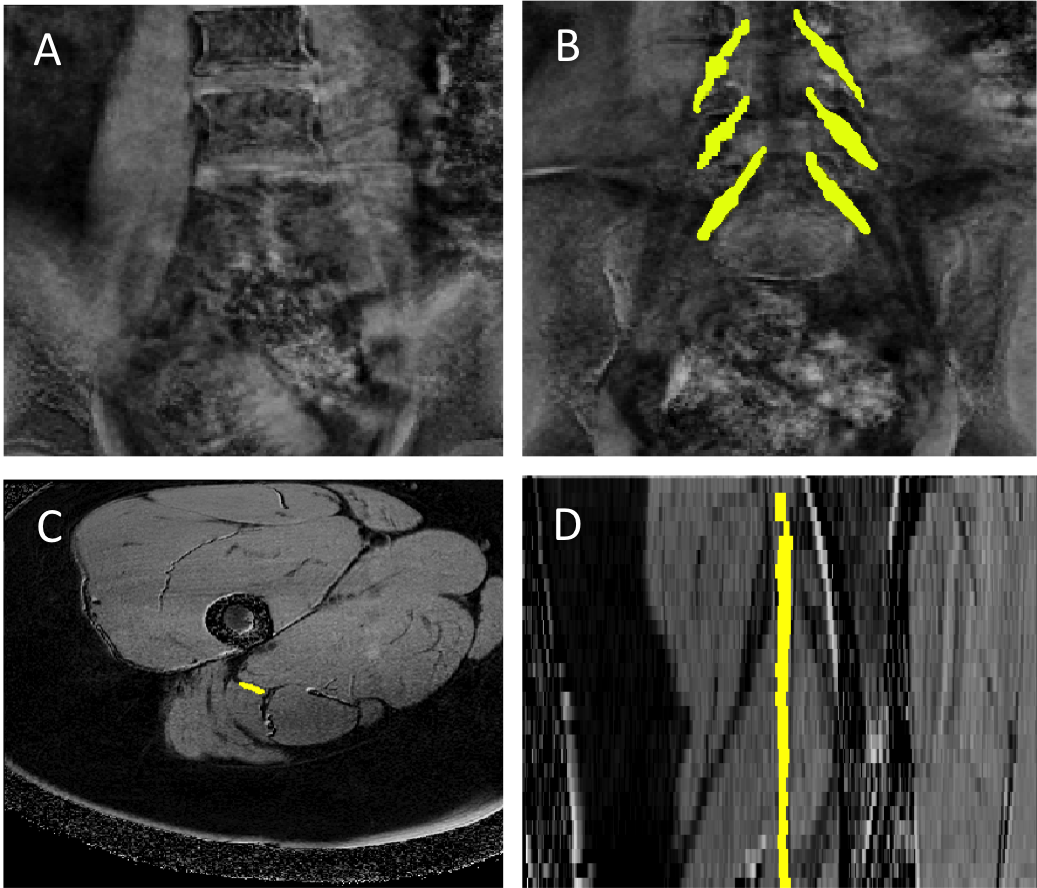
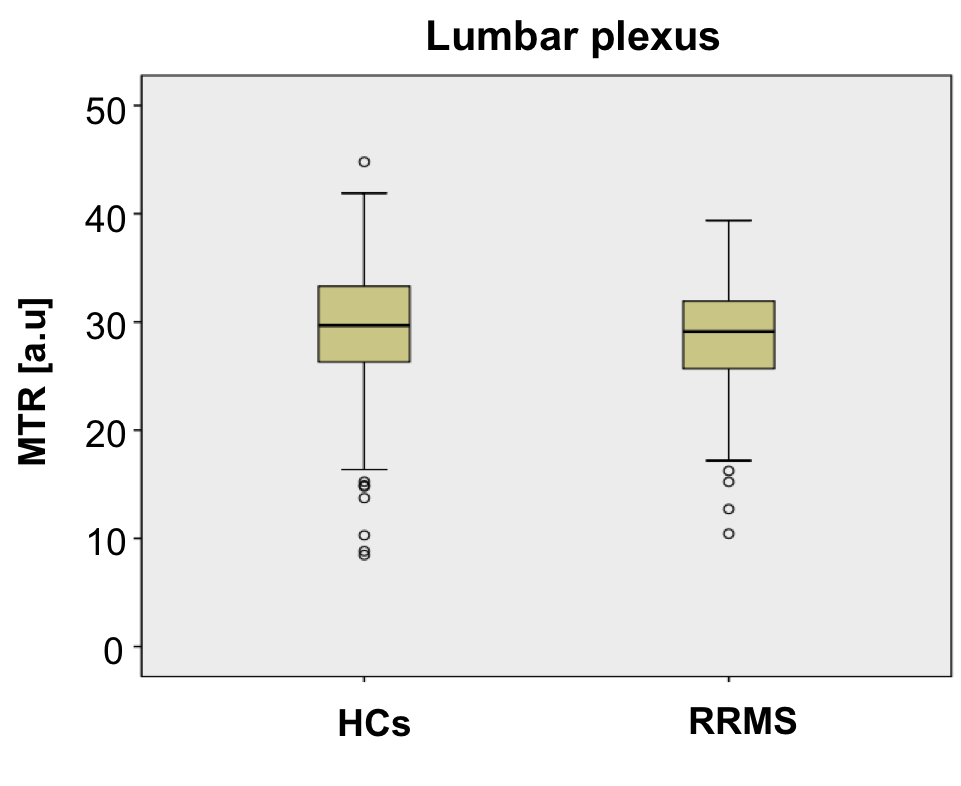
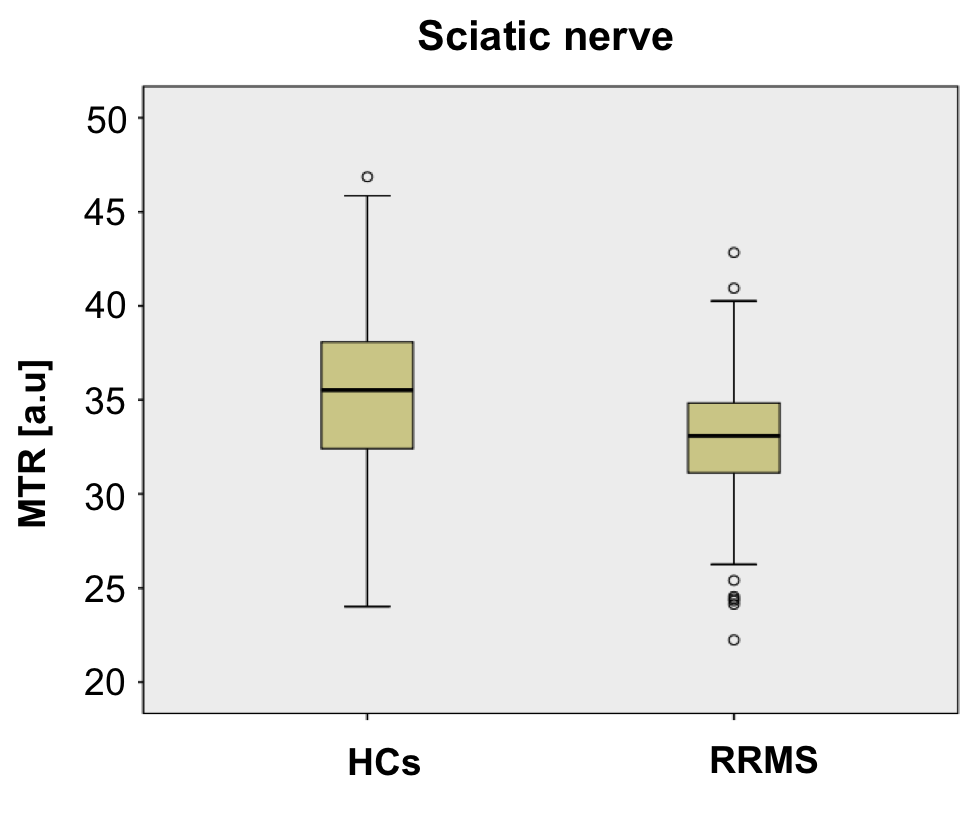
Figure 2A and 2B show an example of the MTR map at the level of the lumbar plexus and Figure 2C and 2D show an example of the MTR map at the level of the right upper thigh in the axial and sagittal plane, respectively. In HCs, mean (±SD) MTR in all lumbar segments combined (L2-L5) was 29.1 (±6.4) and in people with RRMS was 28.8 (±4.7) (Figure 3); this difference was not statistically significant (p=0.27). In the sciatic nerve, mean (±SD) MTR in HCs was 35.0 (±4.9) and in people with RRMS was 32.9 (±3.5) (Figure 4); this difference was statistically significant (p<0.001).DISCUSSION AND CONCLUSION
In this pilot in vivo study we have demonstrated changes in MTR values in the sciatic nerve in people with RRMS as compared to HCs, pointing towards pathological changes in myelin content in this region. Future investigations using a larger sample population will be required to confirm the results presented in this pilot study.Acknowledgements
The UK MS Society and the UCL-UCLH Biomedical Research Centre for ongoing support. CGWK receives funding from ISRT, Wings for Life and the Craig H. Neilsen Foundation (the INSPIRED study), from the MS Society (892/08 and 77/2017), Wings for Life (#169111), Horizon2020 (CDS-QUAMRI, #634541). FP is a non-clinical Postdoctoral Guarantors of Brain fellow. This project has received funding under the European Union’s Horizon 2020 research and innovation programme under grant agreement No. 634541 and from the Engineering and Physical Sciences Research Council (EPSRC EP/R006032/1), funding FG.References
1) Hasson J, Terry R.D Zimmerman H.M. Peripheral neuropathy in multiple sclerosis. Neurology. 1958; 8(7):503-10.
2) Miglietta O, Lowenthal M. A study of peripheral nerve involvement in fifty-four patients with multiple sclerosis. Arch Phys Med Rehabil. 1961;42:573-8.
3) Pollock M, Calder C, Allpress S. Peripheral nerve abnormality in multiple sclerosis. Ann Neurol. 1977;2(1):41-8.
4) Schoene W.C, Carpenter S, Behan P.O, et al. ‘Onion bulb’ formations in the central nervous system in association with multiple sclerosis and hypertrophic polyneuropathy. 1977;100(4):755-73.
5) Yoneyama M, Takahara T, Kwee T.C, et al. Rapid high resolution MR neurography with a diffusion-weighted pre-pulse, Magn. Reson. Med. Sci. 2013;12(2):111–119.
6) Kasper J.M, Wadhwa V, Scott K.M, et al. SHINKEI-a novel 3D isotropic MR neurography technique: technical advantages over 3DIRTSE-based imaging, Eur. Radiol. 2015;25(6):1672–1677.
7) Modat M, Cash DM, Daga P, et al. Global image registration using a symmetric block-matching approach. J Med Imaging (Bellingham). 2014;1(2):024003.
Figures