1399
Changes of cortical gray matter myelin and microstructure in multiple sclerosis (MS) assessed with quantitative ihMT and MT1Radiology, Division of MRI Research, Beth Israel Deaconess Medical Center, Harvard Medical School, Boston, MA, United States, 2Brigham and Women's Hospital, Harvard Medical School, Boston, MA, United States, 3CRMBM, Aix Marseille Univ, CNRS, Marseille, France, 4Neurology, Brigham and Women's Hospital, Harvard Medical School, Boston, MA, United States
Synopsis
Inhomogeneous magnetization transfer (ihMT) and magnetization transfer (MT) have differential sensitivity to myelin and can be used to characterize cortical gray matter. We compared cortical surface-based analyses of ihMT and MT between multiple sclerosis (MS) patients and age-matched healthy volunteers. IhMT at mid-thickness decreased less than MT in most cortical regions of MS patients. Integrated signal across cortical depth showed less spatial variability and clear decrease of ihMT but less than MT. As ihMT is understood to be more specific to myelin than MT, these findings suggest loss of cortical nonmyelinated cells and structures exceed cortical myelin loss in MS.
Introduction
Multiple Sclerosis (MS) is a neurodegenerative disease in which white matter (WM) demyelination has been extensively studied over the past decades. Research suggests cortical neuronal loss and demyelination, especially cortical subpial damage, is frequent in MS1, has been shown to be associated with deficits2 and may underlie the progressive features of the disease. Because of their small size, cortical lesions are almost undetectable with conventional imaging. Magnetization transfer (MT) techniques, including MT3 or inhomogeneous magnetization transfer (ihMT)4,5 are sensitive to myelin and have been used to study WM demyelination in MS6. While cortical MT has already been studied in MS patients7,8, cortical ihMT behavior is unknown. IhMT has been shown to be sensitive to cortical myelin content and can therefore be used to characterize cortical gray matter using a surface-based analysis9. Thus, the main goal of this work was to compare cortical ihMT and MT changes in MS patients using surface-based analyses for better characterization of cortical damage in MS.Methods
Four MS patients (EDSS range: 1.5 – 6) and four age-matched healthy volunteers were scanned on a 3T scanner (GE Discovery MR750) with a 32-ch head coil (Nova Medical). Acquisitions included a 1mm isotropic 3D T1w FSPGR sequence and a 1.6mm isotropic 3D ihMTRAGE sequence10. The ihMT preparation consisted of 5ms off-resonance RF pulses (cosine-modulated for dual-frequency irradiation), Δf=7kHz, B1,peak=14μT, applied every 100ms for 1s, followed by rapid gradient echo (RAGE) readouts with: radial-fan beam view-ordering; FOV=24x24x16cm3; FA=10°; 90 readouts; TE/TR=1.8/4.6ms. The preparation and readouts were followed by a recovery period for a total repetition time, TRihMTRAGE=2s. Two reference images were also acquired for quantification of ihMT and MT, by substitution of the ihMT preparation with 1s of RF spoiled FA=0° or 25° on-resonance pulses applied every 25ms. A quick low resolution B1 map was acquired with a Bloch-Siegert sequence, as previously described11.We adapted the MT saturation approach12 to extract unbiased ihMT and MT metrics (using the dual-frequency saturation for the MT metric). This model assumes a short pulse and a relatively long TR such that the effect of each pulse can be considered to be a fractional attenuation of the free pool. In our approach, the measured B1 maps, the two reference images were first fit to determine T1 in each voxel. Then, we constructed a simple forward model for the spoiled gradient echo excitations and the MT RF pulses (or the reference pulses), as a function of T1 and B1 and inverted them to determine MTsat and ihMTsat.
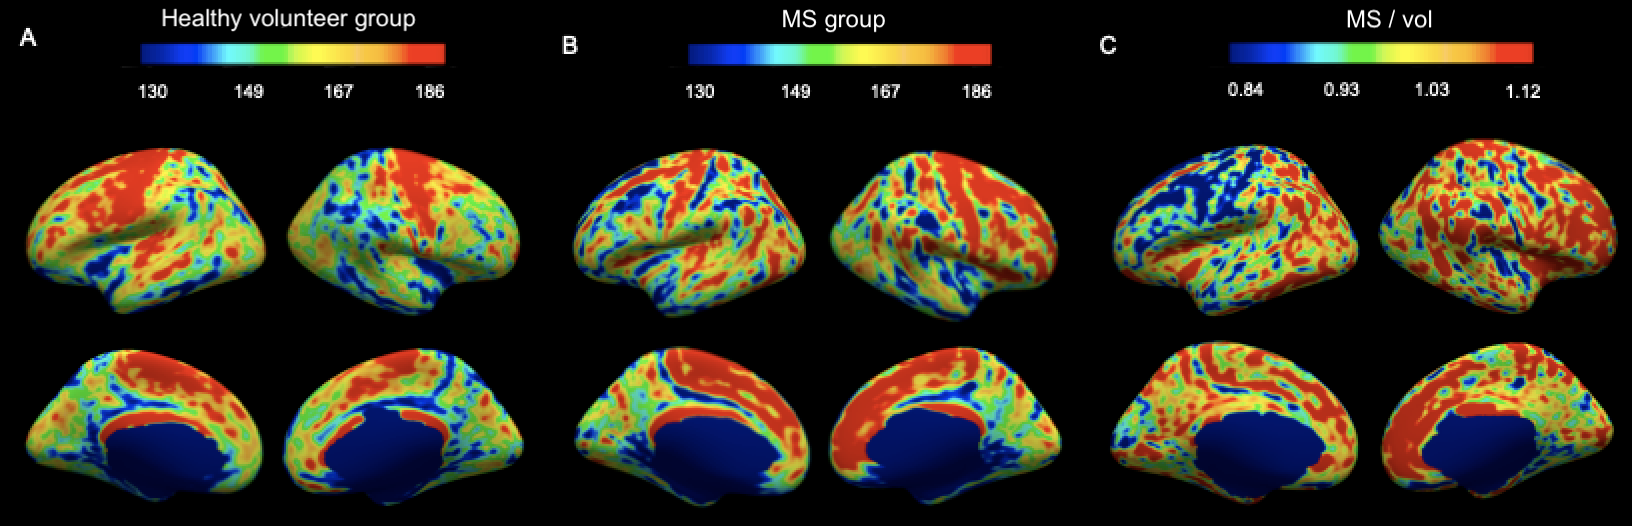
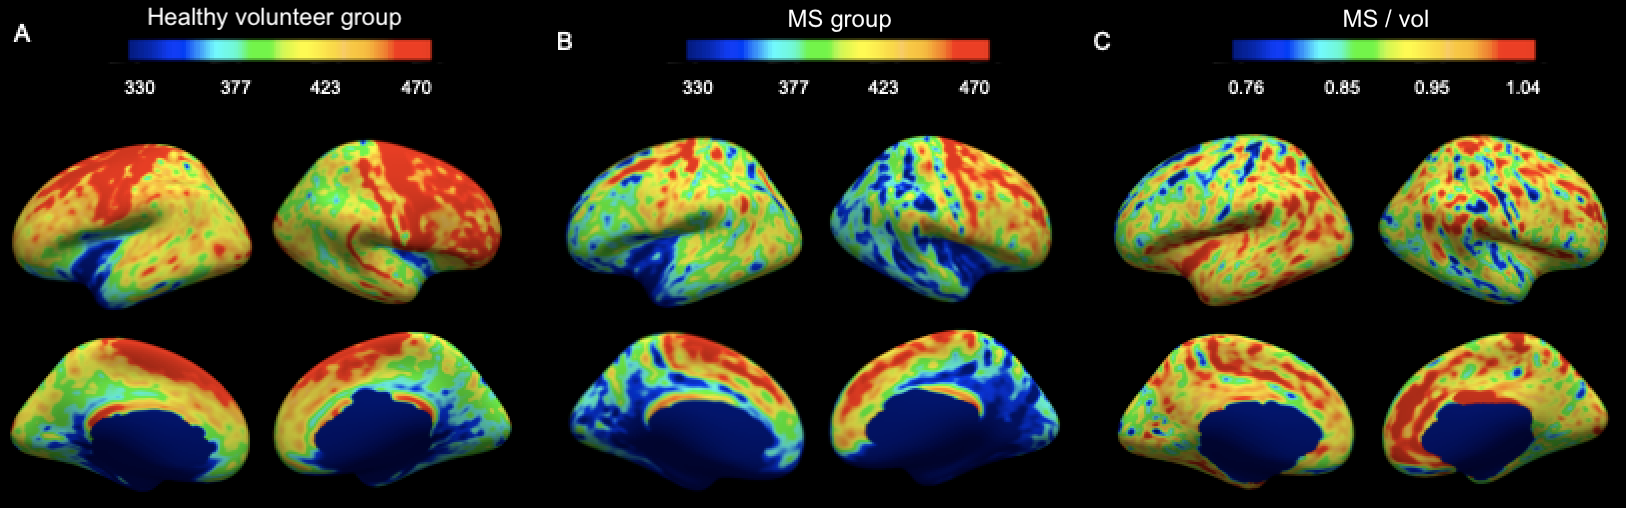
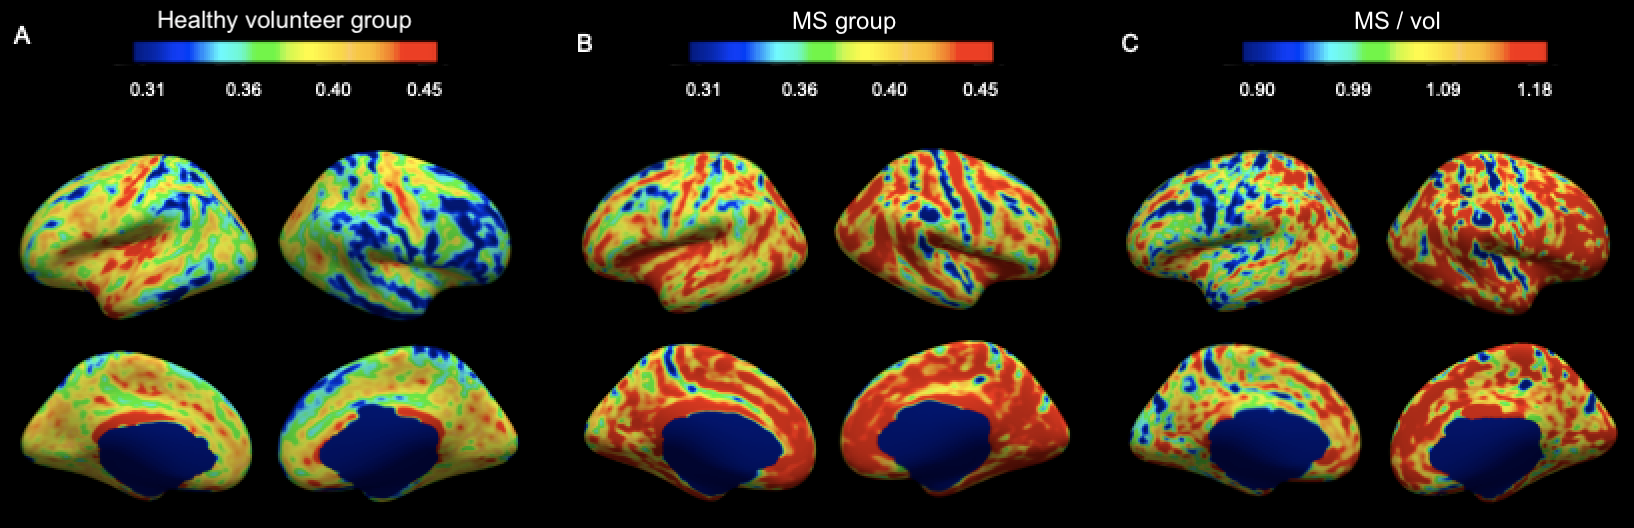
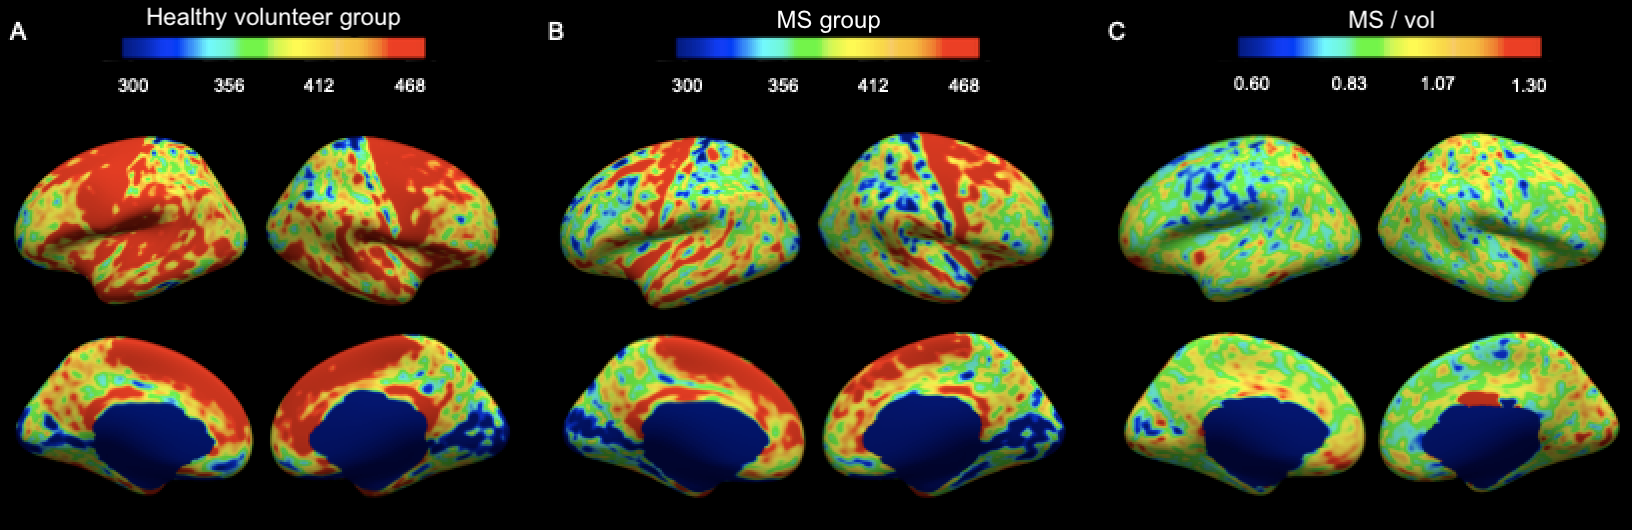
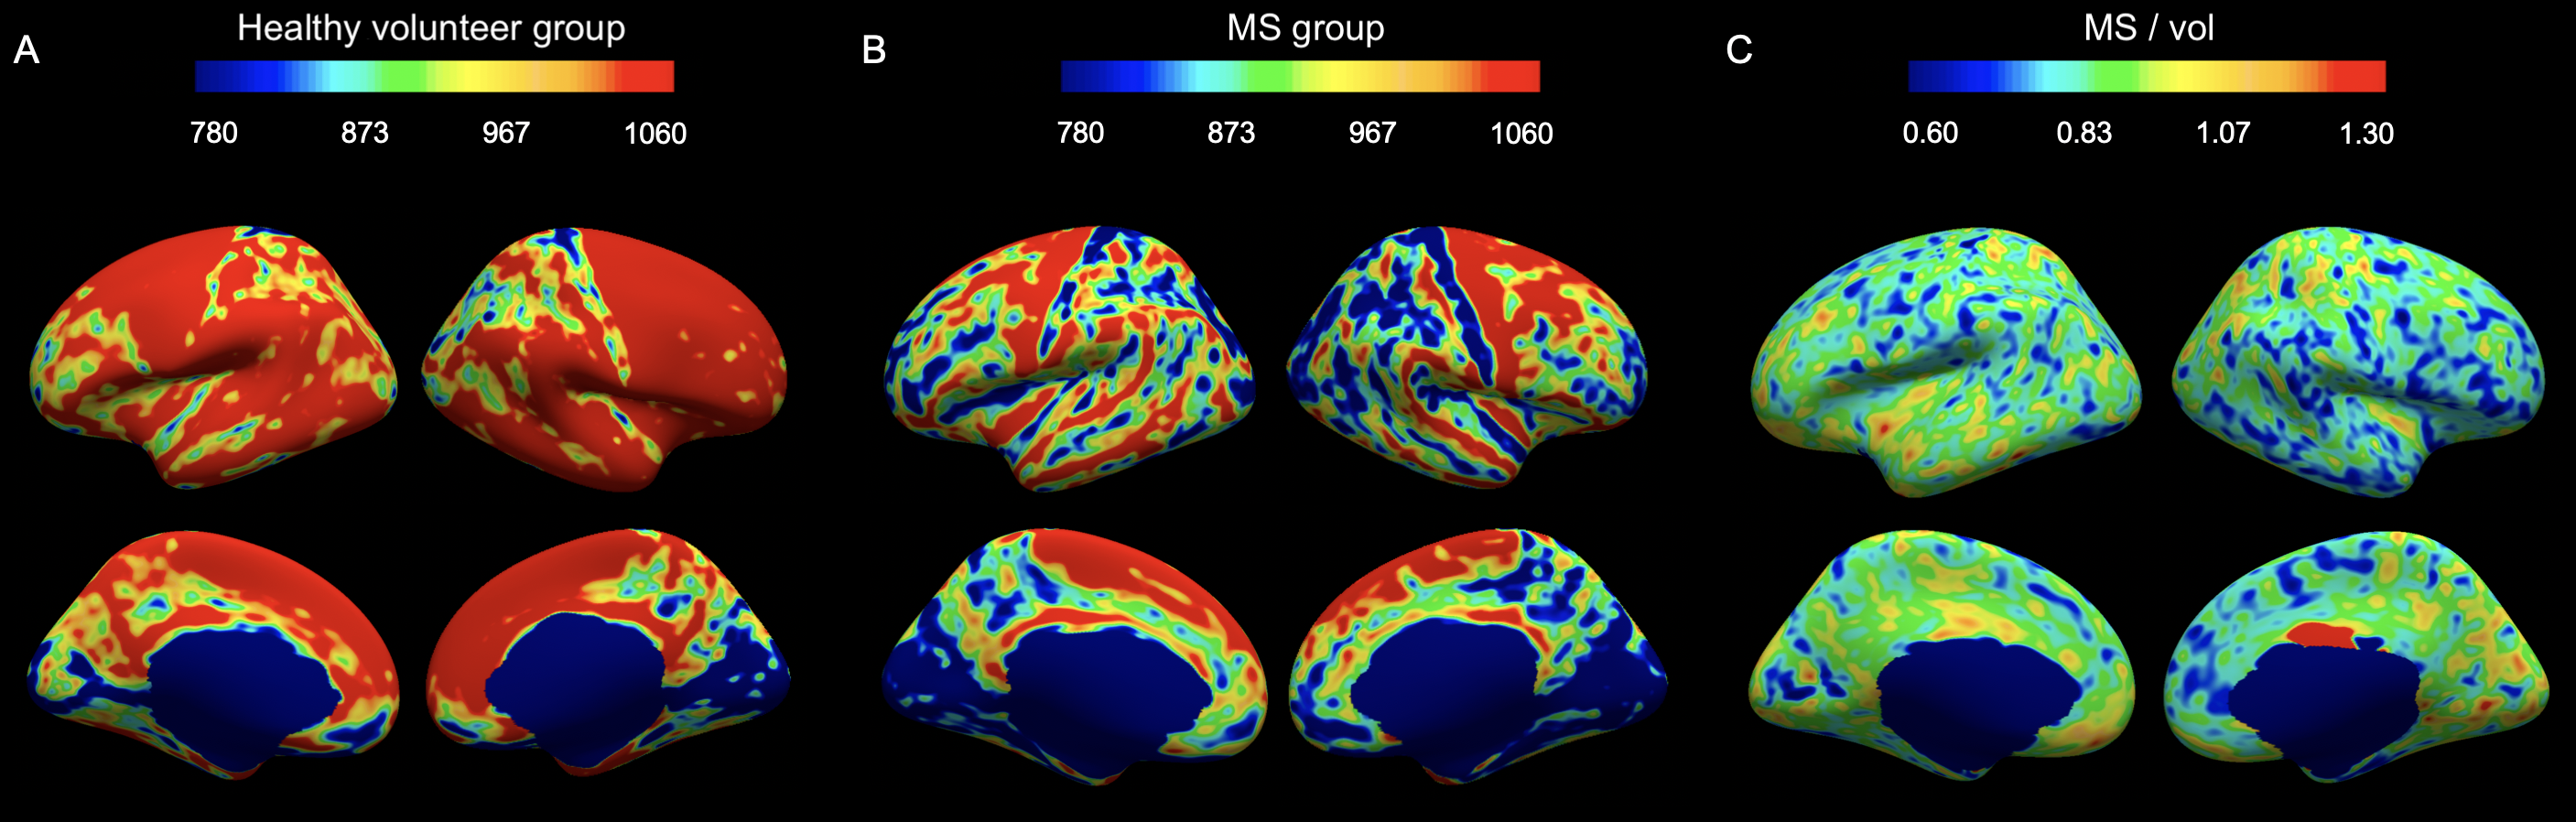
We performed cortical surface-based analyses of ihMTsat, MTsat and the ratio ihMTsat/MTsat for the four MS patients following the steps previously described9. We replicated the analyses for the four age-matched healthy volunteers. Then, we created comparison surface-based maps by dividing the maps obtained from the MS group (either ihMTsat, MTsat or ihMTsat/MTsat) by the maps computed for the healthy volunteer group. We also computed surface-based maps of cortical myelin density by integrating the ihMTsat map or the MTsat map across cortical depth. In this scenario, the ihMTsat and MTsat maps are averaged along the entire cortex (10% to 90% distance from the white surface to avoid some partial volume effect) and multiplied by the cortical thickness map. This approach takes into consideration the cortical thinning happening in MS patients. Finally, we created comparison maps of myelin density by dividing the maps obtained from the MS group by the maps computed for the healthy volunteer group.
Results
IhMTsat at mid cortical thickness in the controls shows a spatial distribution consistent with prior myeloarchitectonic results9. Changes in ihMTsat with MS are spatially heterogeneous but with many regions showing increased ihMTsat signal (Figure 1). MTsat at mid cortical thickness more clearly shows a decrease in MS, though also with spatially varying magnitude (Figure 2). The generally greater decrease with MS in MTsat than ihMTsat is highlighted in the ratio maps (Figure 3).Integrating the signals across the cortical thickness greatly reduces spatial variability and more clearly shows widespread loss of total ihMTsat (Figure 4) and MTsat (Figure 5) signal in the cortex. MTsat changes still exceed ihMTsat changes, however.
Discussion
Using cortical surface-based analyses of ihMT and MT, we highlighted widespread cortical microstructural damage in MS. We also highlighted different behaviors between ihMT and MT. As ihMT is more specific to myelin than MT5, the generally greater loss of MT suggests that damage to other tissue components, including neurons and dendrites, exceeds myelin loss in the MS cortex. These findings support the use of both MT and ihMT to characterize progressive damage with MS.Acknowledgements
No acknowledgement found.References
1. Calabrese, M., Filippi, M. & Gallo, P. Cortical lesions in multiple sclerosis. Nature Reviews Neurology6, 438–444 (2010).
2. Treaba, C. A. et al.Longitudinal Characterization of Cortical Lesion Development and Evolution in Multiple Sclerosis with 7.0-T MRI. Radiology291, 740–749 (2019).
3. Filippi, M. & Rocca, M. A. Magnetization Transfer Magnetic Resonance Imaging in the Assessment of Neurological Diseases. Journal of Neuroimaging14, 303–313 (2004).
4. Varma, G., Duhamel, G., Bazelaire, C. de & Alsop, D. C. Magnetization transfer from inhomogeneously broadened lines: A potential marker for myelin. Magnetic Resonance in Medicine73, 614–622 (2015).
5. Duhamel, G. et al.Validating the sensitivity of inhomogeneous magnetization transfer (ihMT) MRI to myelin with fluorescence microscopy. NeuroImage199, 289–303 (2019).
6. Obberghen, E. V. et al.Evaluation of the Sensitivity of Inhomogeneous Magnetization Transfer (ihMT) MRI for Multiple Sclerosis. American Journal of Neuroradiology39, 634–641 (2018).
7. McKeithan, L. J. et al.7T quantitative magnetization transfer (qMT) of cortical gray matter in multiple sclerosis correlates with cognitive impairment. NeuroImage203, 116190 (2019).
8. Rudko, D. A.et al.Delineation of cortical pathology in multiple sclerosis using multi-surface magnetization transfer ratio imaging. NeuroImage: Clinical12, 858–868 (2016).
9. Munsch, F. et al.Myeloarchitectonic mapping of cortical gray matter with 3D inhomogeneous magnetization transfer (ihMT). in Proceedings of the 27th annual meeting of the ISMRM1048 (2019).
10. Varma, G., Munsch, F., Girard, O. M., Duhamel, G. & Alsop, D. C. An inhomogeneous magnetization transfer (ihMT) quantification method robut to B1 and T1 variations in magnetization prepared acquisitions. in Proceedings of the 27th annual meeting of the ISMRM4911 (2019).
11. Sacolick, L. I., Wiesinger, F., Hancu, I. & Vogel, M. W. B1 mapping by Bloch-Siegert shift. Magnetic Resonance in Medicine63, 1315–1322 (2010).
12. Helms, G., Dathe, H., Kallenberg, K. & Dechent, P. High-resolution maps of magnetization transfer with inherent correction for RF inhomogeneity and T1 relaxation obtained from 3D FLASH MRI. Magnetic Resonance in Medicine60, 1396–1407 (2008).
Figures