1397
Gray matter relaxation rates show different correlation patterns for cognitive impairment and physical disability in Multiple Sclerosis.1Department of Advanced Biomedical Sciences, University "Federico II", Naples, Italy, 2Department of Neurosciences, Reproductive Science and Odontostomatology, University "Federico II", Naples, Italy, 3Biostructure and Bioimaging Institute, National Research Council, Naples, Italy
Synopsis
To assess voxelwise in gray matter the correlation between relaxation rates and both physical and cognitive impairment in MS, R1 and R2 relaxation rate maps from 241 Relapsing-Remitting MS patients were assessed voxelwise for correlation with EDSS and the percentage of impaired cognitive test.
Inverse correlation between EDSS and R2 were detected throughout the brain, while inverse correlations with R1 were mostly limited to perirolandic and supramarginal cortices.
Cognitive impairment correlated negatively with R1, and to a lesser extent with R2, in the limbic system and dorsolateral prefrontal cortices.
Background
Regional gray matter (GM) atrophy1–10 and microstructural alterations (assessed using DTI11, MTR12,13, and R2*14–16), have shown preferential correlations with cognitive scores in specific cortical regions, relevant to the tested cognitive domains, although the independence of these patterns is unknown.On the other hand, physical disability scores correlate with MTR parameters17–24, GM relaxation rates25,26, and DTI-derived measures, when averaged over the whole GM, while previous voxel-based analyses, limited to R2*14 and diffusivity27 measures, failed in localizing these correlations in the cortex.
Aim of this retrospective study was to assess the role of regional microstructural GM changes, as measured by a voxel-based analysis of R1 and R2 relaxation rate maps, in determining physical disability and cognitive impairment in relapsing-remitting multiple sclerosis (RR‑MS), taking also into account the effect of atrophy by covarying at voxel level for the GM concentration.
Methods
MRI studies from 241 patients with clinically definite RR‑MS (141 females; mean age 34.6±7.9 y; disease duration 4,9±5.4 y; EDSS 2.4±0.9, range 1-5), collected as part of patient participation in clinical trials, observational studies or clinical practice, were retrospectively selected based on the availability of an MRI study suitable for multiparametric relaxometric segmentation, along with an EDSS collected within 1 month from the MRI.In 186 patients, the results of a the Rao’s Brief Repeatable Battery (BRB)28 and the Stroop test29, also acquired within one month from the MRI scan, were used to calculate a Cognitive Index (CI, the percentage of impaired tests)26.
MRI studies had been acquired at 1.5T using four different acquisition protocols (Figure 1) each including a single-echo T1-weighted and a double-echo PD/T2-weighted sequence, with equal echo time for T1 and PD volumes, as required by the relaxation rate calculation procedure.
For each study, pre-processing steps included the following:
- Automated rigid body
co-registration30 of the T1w and PD/T2w volumes;
- Calculation of the R1, R2 and
PD maps according to the general formula of the signal intensity in the
transverse steady state31–34;
- Multiparametric segmentation
of the relaxation rate maps into GM, normal and abnormal WM, and CSF, using a
fully automated relaxometric method35,36, which has shown an excellent correlation with the manual
definition of the MS lesions35 and does not need lesion masking or filling37;
- Normalization38 of the GM maps to the MNI space using the SPM GM
template;
- Application of the resulting
normalization matrix to the R1 and R2 maps;
- Smoothing (8mm FWHM) of the
normalized GM, R1 and R2 maps.
Correlations of R1 and R2 with EDSS and CI were then separately assessed voxelwise using the “Biological Parameter Mapping” software package39, including as nuisance covariates MRI protocol, age, sex, disease duration, T2-lesion volume, EDSS (only for correlations with CI), and the GM maps (to remove the effects of the local degree of GM atrophy).
Results
Clusters of significant correlation with EDSS and CI are shown in Figure 2 for R1 and in Figure 3 for R2, superimposed on the average of the normalized GM maps of the 241 patients.When testing correlations between CI and GM relaxation rates, limited clusters of significant inverse correlation with R2 were found bilaterally in the left middle frontal and precentral gyri, and in the parahippocampal GM on the right.
Larger clusters of inverse correlation of CI with R1 were found bilaterally in the middle frontal gyri and mesial temporal GM, as well as in the left midcingulate and in the right medial parieto-occipital cortices.
When EDSS was included in the model, no cluster of correlation between CI and R2 remained significant, while significant clusters of inverse correlation could still be demonstrated for R1 in the precuneus, in dorso-lateral prefrontal regions, and in the midcingulate cortex.
When testing correlations between EDSS and GM relaxation rates, extensive clusters of inverse correlation with R2 values were present bilaterally throughout the brain, the most significant being in the right pre- and post-central gyri.
For R1, clusters of inverse correlation with EDSS were less diffuse, restricted to bilateral perirolandic and supramarginal cortices, with additional clusters in the Cruz I of the right cerebellar hemisphere, and in the posterior part of the left middle temporal gyrus.
Discussion and conclusion
Current results, given the differential effect of pathological changes on R2 (mainly influenced by demyelination, edema and inflammatory lesions presence) and R1 (mainly influenced by neuronal loss)41,42, suggest an extensive correlation in the cortex between microstructural changes and physical disability, with a preferential role of the sensorimotor cortices, where neuronal loss may play a specific role, while neuronal loss in the limbic system and dorsolateral prefrontal cortices appear more strictly related to the cognitive symptoms.Further studies are needed, possibly coupling other measures of microstructural integrity (e.g. MTR and DTI-derived) to relaxation rates, to confirm these findings and to clarify the pathophysiological meaning of these correlations.
Acknowledgements
Funding by the CNR Strategic Project “The Aging: Technological and Molecular Innovations Aiming to Improve the Health of Older Citizens” (http://www.progettoinvecchiamento.it) and by the Italian Ministry for Education, University and Research (Project MOLIM ONCOBRAIN LAB) is gratefully acknowledged.References
1. Riccitelli G, Rocca MA, Pagani E, et al. Cognitive impairment in multiple sclerosis is associated to different patterns of gray matter atrophy according to clinical phenotype. Hum Brain Mapp 2011;32(10):1535–1543.
2. Preziosa P, Rocca MA, Pagani E, et al. Structural MRI correlates of cognitive impairment in patients with multiple sclerosis: A Multicenter Study. Hum Brain Mapp 2016;37(4):1627–1644.
3. Kolbe SC, Kilpatrick TJ, Mitchell PJ, et al. Inhibitory saccadic dysfunction is associated with cerebellar injury in multiple sclerosis. Hum Brain Mapp 2014;35(5):2310–2319.
4. Bergsland N, Zivadinov R, Dwyer MG, et al. Localized atrophy of the thalamus and slowed cognitive processing speed in MS patients. Mult Scler 2016;22(10):1327–1336.
5. Nocentini U, Bozzali M, Spanò B, et al. Exploration of the relationships between regional grey matter atrophy and cognition in multiple sclerosis. Brain Imaging Behav 2014;8(3):378–86.
6. van de Pavert SHP, Muhlert N, Sethi V, et al. DIR-visible grey matter lesions and atrophy in multiple sclerosis: partners in crime? J Neurol Neurosurg Psychiatry 2016;87(5):461–7.
7. Ernst A, Noblet V, Gounot D, et al. Neural correlates of episodic future thinking impairment in multiple sclerosis patients. J Clin Exp Neuropsychol 2015;37(10):1107–23.
8. Geisseler O, Pflugshaupt T, Bezzola L, et al. Cortical thinning in the anterior cingulate cortex predicts multiple sclerosis patients’ fluency performance in a lateralised manner. NeuroImage Clin 2016;10:89–95.
9. Zhang X, Zhang F, Huang D, et al. Contribution of Gray and White Matter Abnormalities to Cognitive Impairment in Multiple Sclerosis. Int J Mol Sci 2016;18(1):46.
10. Bisecco A, Stamenova S, Caiazzo G, et al. Attention and processing speed performance in multiple sclerosis is mostly related to thalamic volume. Brain Imaging Behav 2018;12(1):20–28.
11. Llufriu S, Martinez-Heras E, Fortea J, et al. Cognitive functions in multiple sclerosis: Impact of gray matter integrity. Mult Scler J 2014;20(4):424–432.
12. Ranjeva J-P, Audoin B, Au Duong M Van, et al. Local tissue damage assessed with statistical mapping analysis of brain magnetization transfer ratio: relationship with functional status of patients in the earliest stage of multiple sclerosis. AJNR Am J Neuroradiol 2005;26(1):119–27.
13. Khaleeli Z, Cercignani M, Audoin B, et al. Localized grey matter damage in early primary progressive multiple sclerosis contributes to disability. Neuroimage 2007;37(1):253–261.
14. Wen J, Yablonskiy DA, Luo J, et al. Detection and quantification of regional cortical gray matter damage in multiple sclerosis utilizing gradient echo MRI. NeuroImage Clin 2015;9:164–175.
15. Louapre C, Govindarajan ST, Giannì C, et al. The association between intra- and juxta-cortical pathology and cognitive impairment in multiple sclerosis by quantitative T2* mapping at 7 T MRI. NeuroImage Clin 2016;12:879–886.
16. Louapre C, Govindarajan ST, Giannì C, et al. Is the Relationship between Cortical and White Matter Pathologic Changes in Multiple Sclerosis Spatially Specific? A Multimodal 7-T and 3-T MR Imaging Study with Surface and Tract-based Analysis. Radiology 2016;278(2):524–35.
17. Ge Y, Grossman RI, Udupa JK, et al. Magnetization transfer ratio histogram analysis of gray matter in relapsing-remitting multiple sclerosis. AJNR Am J Neuroradiol 2001;22(3):470–5.
18. Davies GR, Ramió-Torrentà L, Hadjiprocopis A, et al. Evidence for grey matter MTR abnormality in minimally disabled patients with early relapsing-remitting multiple sclerosis. J Neurol Neurosurg Psychiatry 2004;75(7):998–1002.
19. Rovaris M, Judica E, Sastre-Garriga J, et al. Large-scale, multicentre, quantitative MRI study of brain and cord damage in primary progressive multiple sclerosis. Mult Scler J 2008;14(4):455–464.
20. Ramio-Torrenta L, Sastre-Garriga J, Ingle GT, et al. Abnormalities in normal appearing tissues in early primary progressive multiple sclerosis and their relation to disability: a tissue specific magnetisation transfer study. J Neurol Neurosurg Psychiatry 2006;77(1):40–45.
21. Vrenken H, Pouwels PJW, Ropele S, et al. Magnetization transfer ratio measurement in multiple sclerosis normal-appearing brain tissue: limited differences with controls but relationships with clinical and MR measures of disease. Mult Scler J 2007;13(6):708–716.
22. Yarnykh VL, Bowen JD, Samsonov A, et al. Fast Whole-Brain Three-dimensional Macromolecular Proton Fraction Mapping in Multiple Sclerosis. Radiology 2015;274(1):210–220.
23. GR D, DJ T, M C, et al. Estimation of the macromolecular proton fraction and bound pool T2 in multiple sclerosis. Mult Scler J 2004;10(6):607–613.
24. Samson RS, Cardoso MJ, Muhlert N, et al. Investigation of outer cortical magnetisation transfer ratio abnormalities in multiple sclerosis clinical subgroups. Mult Scler J 2014;20(10):1322–1330.
25. Gracien R, Jurcoane A, Wagner M, Reitz SC. The Relationship between Gray Matter Quantitative MRI and Disability in Secondary Progressive Multiple Sclerosis. 2016;1:1–14.
26. Megna R, Alfano B, Lanzillo R, et al. Brain tissue volumes and relaxation rates in multiple sclerosis: implications for cognitive impairment. J Neurol 2019;266(2):361–368.
27. Senda J, Watanabe H, Tsuboi T, et al. MRI mean diffusivity detects widespread brain degeneration in multiple sclerosis. J Neurol Sci 2012;319(1–2):105–110.
28. Rao SM. A manual for the Brief, Repeatable Battery of Neuropsychological Tests in Multiple Sclerosis National Multiple Sclerosis Society. 1991;
29. Barbarotto R, Laiacona M, Frosio R, et al. A normative study on visual reaction times and two Stroop colour-word tests. Ital J Neurol Sci 1998;19(3):161–170.
30. Ashburner J, Friston K. Multimodal Image Coregistration and Partitioning—A Unified Framework. Neuroimage 1997;6(3):209–217.
31. Bakker CJ, de Graaf CN, van Dijk P. Derivation of quantitative information in NMR imaging: a phantom study. Phys Med Biol 1984;29(12):1511–25.
32. Alfano B, Brunetti A, Ciarmiello A, Salvatore M. Simultaneous display of multiple mr parameters with “quantitative magnetic color imaging.” J Comput Assist Tomogr 1992;16(4):634–640.
33. Alfano B, Brunetti A, Arpaia M, et al. Multiparametric display of spin-echo data from MR studies of brain. J Magn Reson Imaging 1995;5(2):217–25.
34. Alfano B, Brunetti A, Covelli EM, et al. Unsupervised, automated segmentation of the normal brain using a multispectral relaxometric magnetic resonance approach. Magn Reson Med 1997;37(1):84–93.
35. Alfano B, Brunetti A, Larobina M, et al. Automated segmentation and measurement of global white matter lesion volume in patients with multiple sclerosis. J Magn Reson Imaging 2000;12(6):799–807.
36. Prinster A, Quarantelli M, Lanzillo R, et al. A voxel-based morphometry study of disease severity correlates in relapsing- remitting multiple sclerosis. Mult Scler 2010;16(1):45–54.
37. Prinster A, Quarantelli M, Orefice G, et al. Grey matter loss in relapsing-remitting multiple sclerosis: A voxel-based morphometry study. Neuroimage 2006;29(3):859–867.
38. Ashburner J, Friston KJ. Nonlinear spatial normalization using basis functions. Hum Brain Mapp 1999;7(4):254–66.
39. Casanova R, Srikanth R, Baer A, et al. Biological parametric mapping: A statistical toolbox for multimodality brain image analysis. Neuroimage 2007;34(1):137–143.
40. Tzourio-Mazoyer N, Landeau B, Papathanassiou D, et al. Automated anatomical labeling of activations in SPM using a macroscopic anatomical parcellation of the MNI MRI single-subject brain. Neuroimage 2002;15(1):273–89.
41. Seewann A, Vrenken H, Kooi E-J, et al. Imaging the tip of the iceberg: visualization of cortical lesions in multiple sclerosis. Mult Scler 2011;17(10):1202–10.
42. Schmierer K, Parkes HG, So P-W, et al. High field (9.4 Tesla) magnetic resonance imaging of cortical grey matter lesions in multiple sclerosis. Brain 2010;133(Pt 3):858–67.
Figures
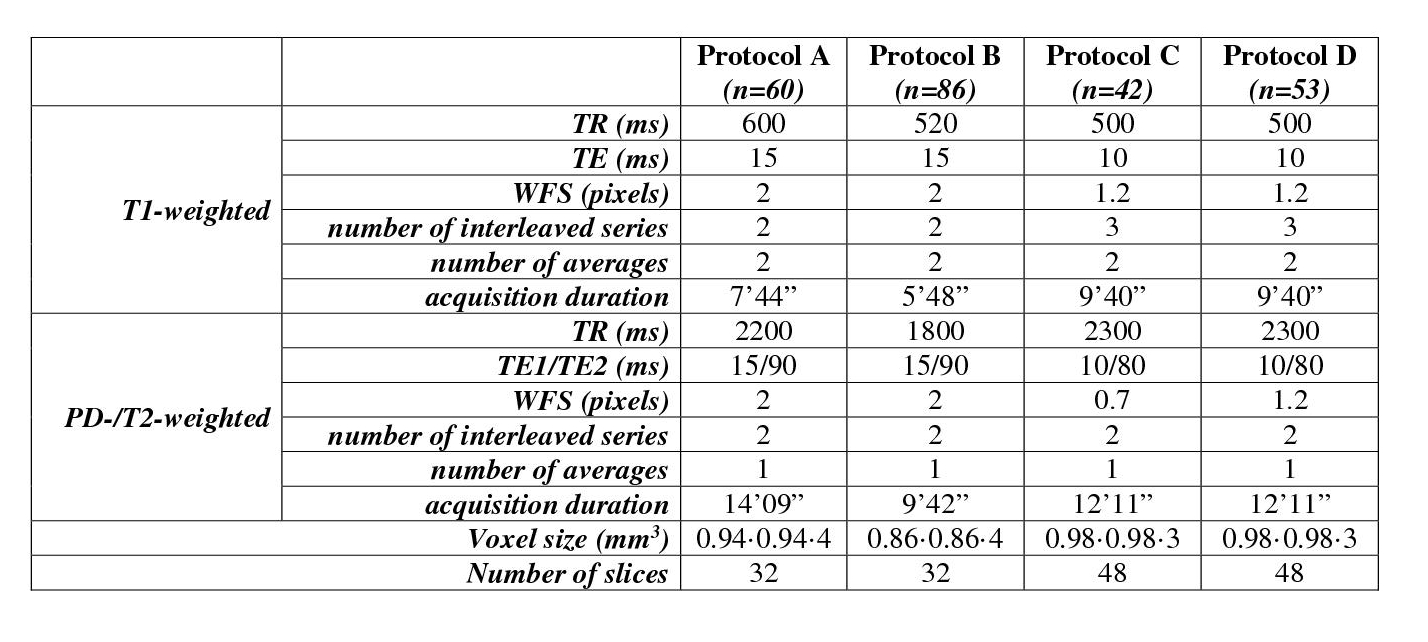
Figure 1 - MRI Protocols
Conventional Spin-Echo sequences used for MRI relaxometric brain tissue segmentation. WFS: Water-fat shift

Figure 2
Clusters of significant inverse correlation of R1 with EDSS and CI, superimposed on the average of the normalized GM maps of the 241 patients. Z coordinates are in mm in the MNI space.
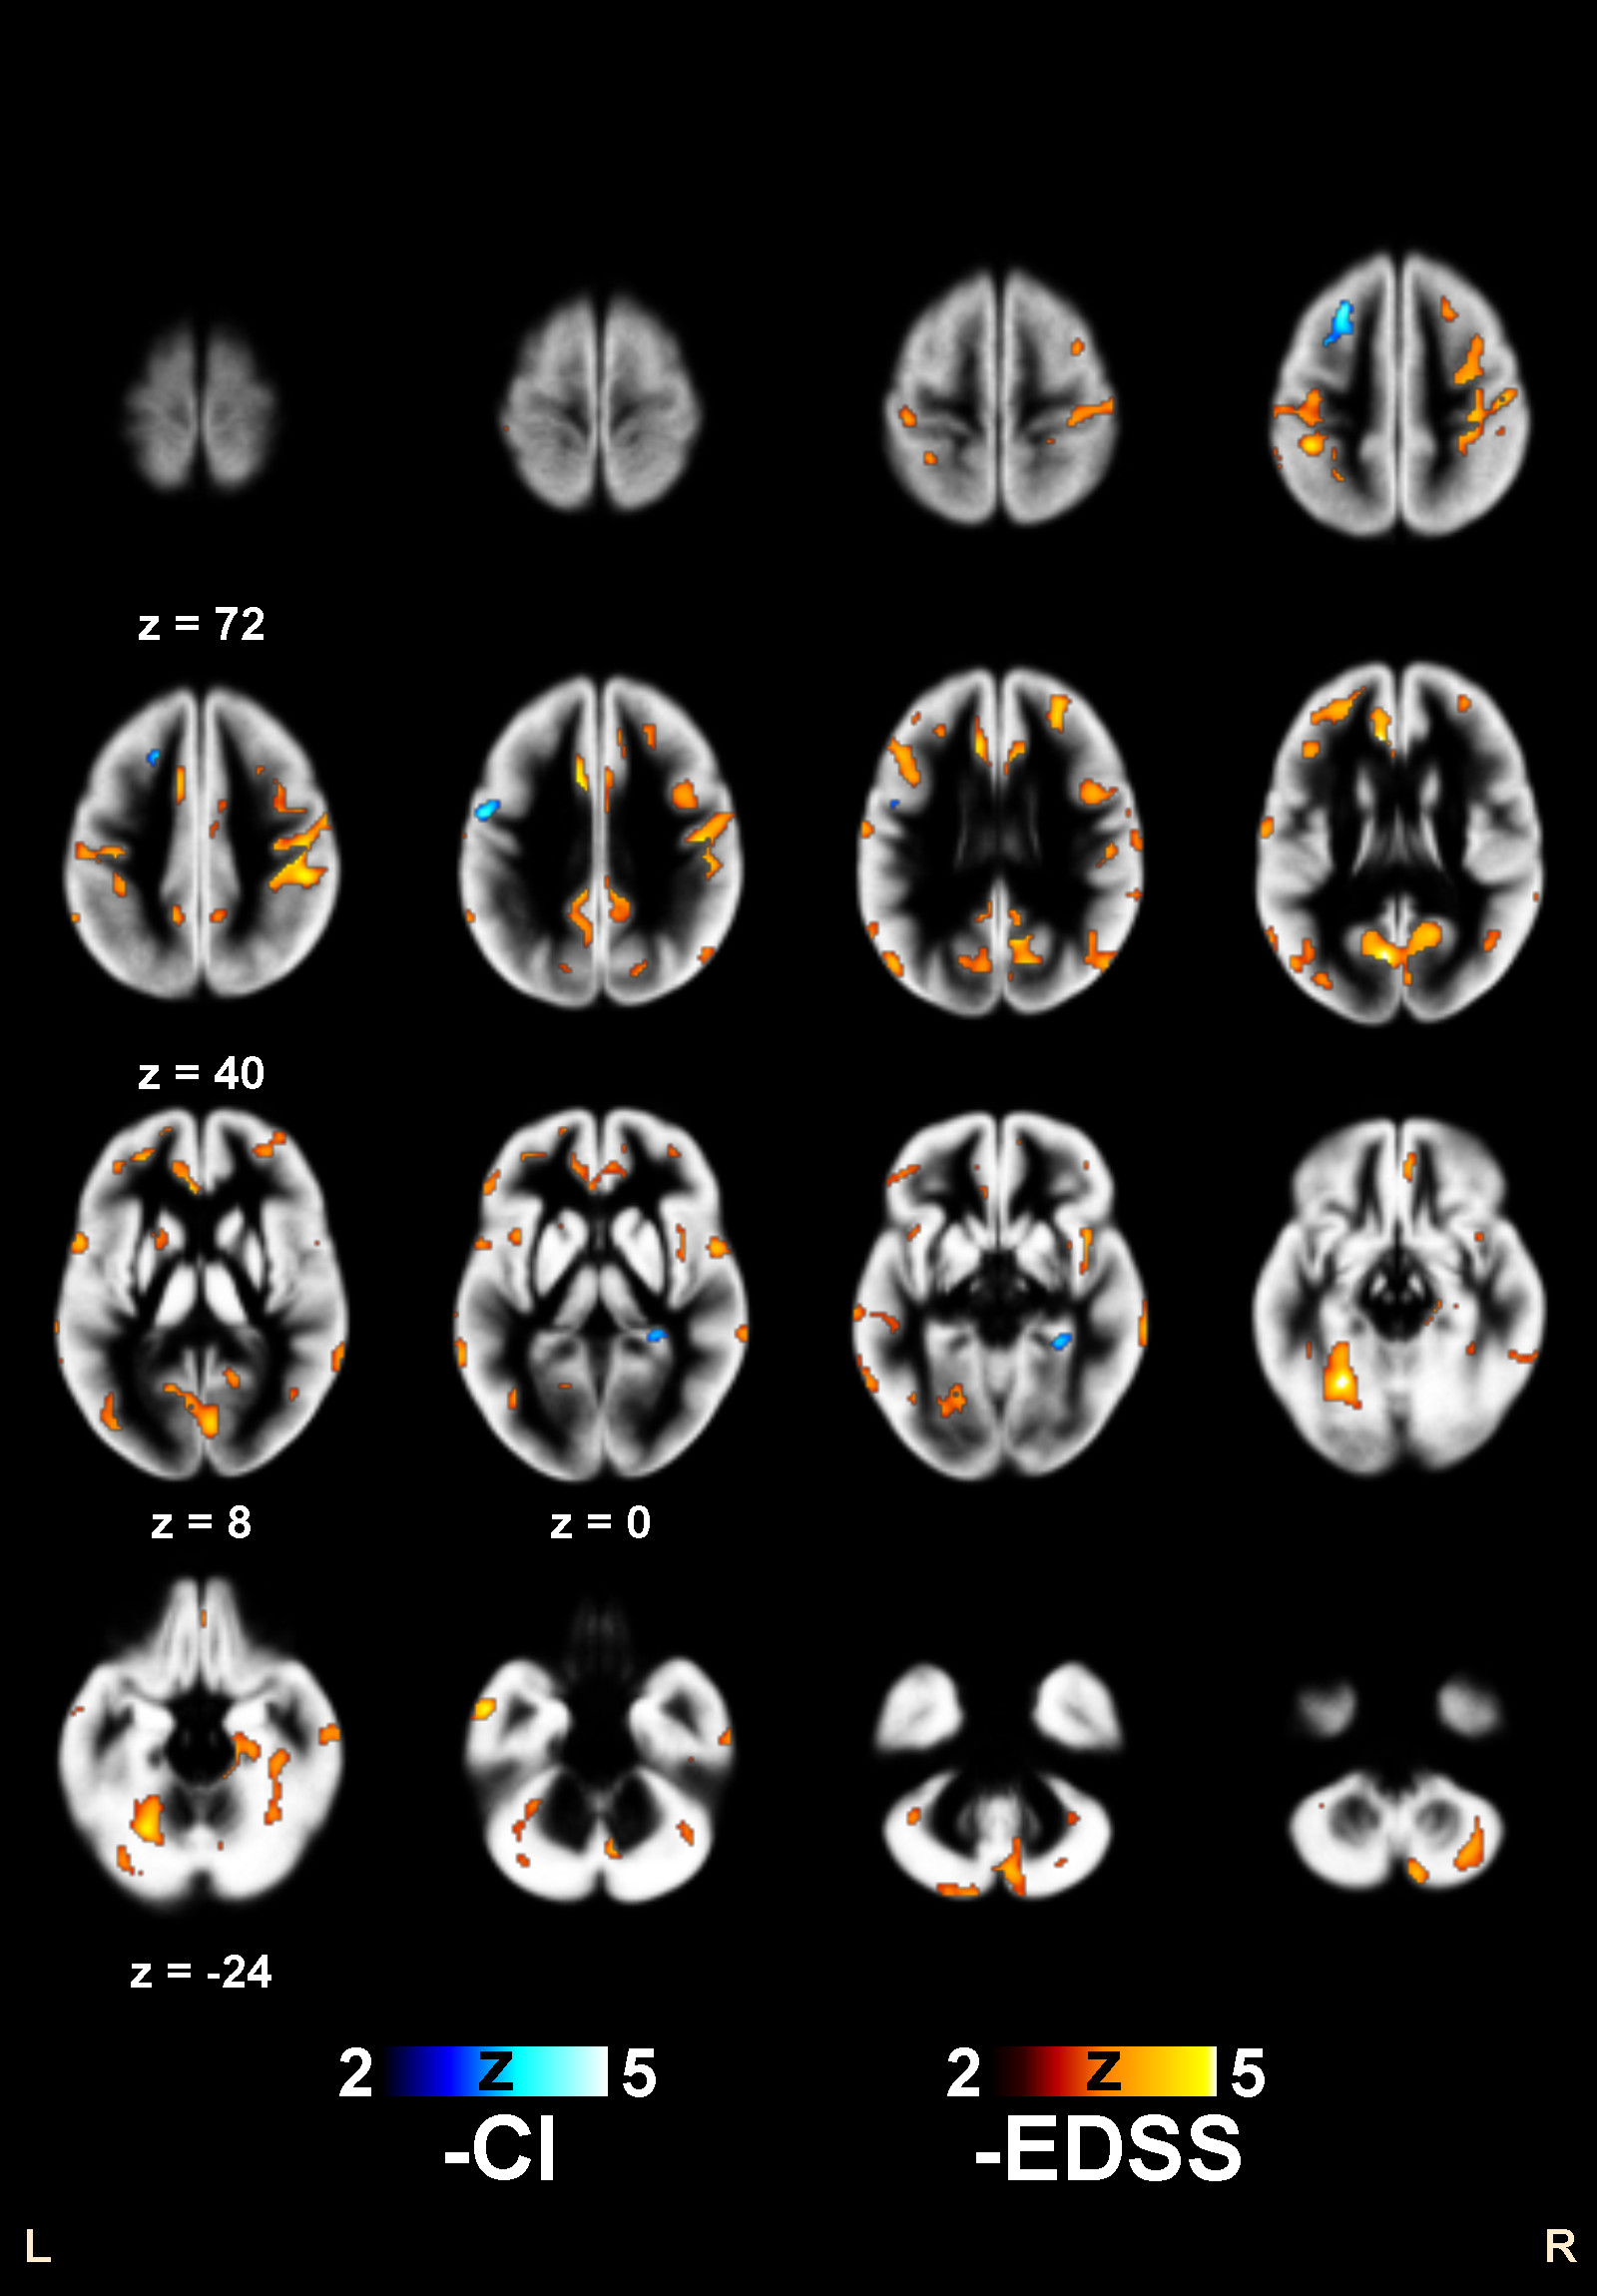
Figure 3
Clusters of significant inverse correlation of R2 with EDSS and CI, superimposed on the average of the normalized GM maps of the 241 patients. Z coordinates are in mm in the MNI space.