1395
Quantitative MR diffusion parameter in normal appearing white matter (NAWM) – a comparison of multiple sclerosis patients and healthy controls
Daniel Güllmar1, Renat Sibgatulin1, Stefan Ropele2, and Jürgen R Reichenbach1,3
1Medical Physics Group / IDIR, Jena University Hospital, Jena, Germany, 2Department of Neurology, Medical University of Graz, Graz, Austria, 3Michael-Stifel-Center for Data driven sciences, Friedrich-Schiller-University Jena, Jena, Germany
1Medical Physics Group / IDIR, Jena University Hospital, Jena, Germany, 2Department of Neurology, Medical University of Graz, Graz, Austria, 3Michael-Stifel-Center for Data driven sciences, Friedrich-Schiller-University Jena, Jena, Germany
Synopsis
Quantitative MR diffusion imaging in multiple sclerosis is a promising tool for deciphering the mechanisms and processes during the disease progression. We employed new MR diffusion acquisition techniques (like SMS) as well as advanced post-processing (like NODDI, SMT) in order to investigate the differences in normal appearing white matter of MS patients in contrast to healthy volunteers.
Introduction
Diffusion MR based quantitative metrics in MS were in the past mainly used to characterize the lesions. Although some diffusion contrasts clearly enhance the contrast in order to identify and classify MS lesions, lesion information itself does not necessarily correspond to the clinical parameters. Thus, the aim of the study was to measure and analyze advanced and more complex diffusion measures using sophisticated acquisition methods (SMS) as well as post-processing methods in the normal-appearing white matter in MS patients and healthy controls. Besides the pure quantitative description of the derived data, we wanted to answer the question if and to what extent certain complex diffusion measures obtained for the NAWM are suitable to differentiate multiples sclerosis patients from healthy volunteers.Material and Methods
The evaluated data where acquired in an ongoing multi-site multiple-sclerosis study between the Jena University Hospital, Germany, and the University Hospital in Graz, Austria. Both sites utilized a 3T MRI (Siemens Prisma, 20 channel head coil (16 active channels)) and identical MR imaging protocols. Patients were acquired in Graz and volunteer data were mainly collected in Jena. The MR diffusion acquisition consisted of a advanced multi-shell (three shells, 8x b@5s/mm2, 16xb@850s/mm2, 32x b@1680s/mm2, 48x b@2500s/mm2, 1.5 mm isotropic resolution) multi-slice (SMS-slice-factor= 4) protocol. All volumes were measured twice with reversed-phase encoding polarity to facilitate susceptibility artifact compensation. The total number of acquired volumes was 208. The diffusion data preprocessing included denoising[4], topup[5], and eddy current correction[6]. The ROI for the white matter was determined based on a simulated GRE flash contrast (settings: alpha= 30°, TE= 5 ms, TR= 20 ms) generated by multi-echo GRE data (5 echos, 2 flip angles, 1mm³ isotropic resolution). The individual white matter mask was obtained by combining the white matter segmentation of FSL-fast [7] and Freesurfer [8]. This procedure excludes the brain stem and the cerebellum. The semi-automatically FLAIR-based generated ROIs of the lesions in the MS subjects as well as the white matter ROI mask was transferred by a linear operation to the diffusion data for each subject, respectively. Lesion mask was additionally subtracted from the determined white matter mask to define the normal-appearing white matter ROI. Finally, the NAWM ROI was treated with a 2-d (in axial orientation) binary closing and 3-d erosion operation. Further partitioning of the NAWM into tract specific ROIs was realized by combing the NAWM ROI with white matter tract segmentation based on the diffusion data. This tract segmentation was realized by utilizing the software package TractSeg [9]. The main NAWM ROI and the selected sub-regions are visualized for a selected subject in Fig. 1. Diffusion tensor metrics (FA, RD, MD) were computed using the DTIFIT routine from FSL using weighted least squares. The spherical mean technique (SMT, [1]) was used to map microscopic diffusion anisotropy parameters. Neurite orientation dispersion and density imaging (NODDI, [2]) was computed using the AMICO implementation [3]. Examples of the evaluated diffusion metrics are shown in Fig. 2. The mean ROI values of these diffusion quantities were compared against each other for total NAWM, subdivisions of the NAWN and the lesions. Up to now 33 patients and 50 volunteers were included in the analysis.Results
For all diffusion metrics except for extracellular mean diffusivity (fitmcmicro_extratrans) the mean values of the NAWM ROIs were found to be significantly (two-sample-ttest, alpha 0.001) different between MS and HC subjects. Table 1. lists the effect sizes (by means of Glass Delta [10]) for all comparisons, which were found to be significant (two-sample t-test < 0.001) different. The corresponding box plots for the comparison for the NAWM are shown in Fig. 3. The largest significant difference effect was found for the metric FIT_ISOVF (noddi isotropic volume fraction), followed by the multi-compartment-extra-cellular transversal diffusivity. For the white matter subdivisions, only the cortico-spinal-tract (CST) and the superior-thalamic-radiation (STR) had a higher average effect size compared to the NAWM region. The table contains also the effect sizes for the normal-appearing including lesion areas in order to be able to compare it to the effect size of NAWM only.Discussion
All investigated diffusion metrics (except the extra-cellular-mean diffusivity) were found to be significantly different in the normal-appearing white matter between MS patients and HCs. Further subdivision of the NAWM did not increase the discrimination power, except for ROIs including connections to the pre-central gyrus. Further analysis will address more diffusion measures as well as testing metrics combinations in order to increase the effect size for NAWM. It will also be interesting to investigate if the variance of the mean values of the NAWM in the MS patient group could be explained by clinical parameters of MS phenotypes.Acknowledgements
This study was financially supported by the German research foundation (RE-1123/21-1) and the Austrian Science Foundation (FWF I3001-B27).References
- E. Kaden, F. Kruggel, DC Alexander, Quantitative mapping of the per-axon diffusion coefficients in brain white matter, MRM, 75 (4), 2016
- Zhang H1, Schneider T, Wheeler-Kingshott CA, Alexander DC., NODDI: practical in vivo neurite orientation dispersion and density imaging of the human brain. Neuroimage. 2012 Jul 16;61(4):1000-16
- Alessandro Daducci, Erick Canales-Rodriguez, Hui Zhang, Tim Dyrby, Daniel Alexander, Jean-Philippe Thiran, Accelerated Microstructure Imaging via Convex Optimization (AMICO) from diffusion MRI data. NeuroImage 105, pp. 32-44 (2015)
- Veraart, J.; Novikov, D.S.; Christiaens, D.; Ades-aron, B.; Sijbers, J. & Fieremans, E. Denoising of diffusion MRI using random matrix theory.NeuroImage, 2016, 142, 394-406
- J.L.R. Andersson, S. Skare, J. Ashburner. How to correct susceptibility distortions in spin-echo echo-planar images: application to diffusion tensor imaging. NeuroImage, 20(2):870-888, 2003.
- Jesper L. R. Andersson and Stamatios N. Sotiropoulos. An integrated approach to correction for off-resonance effects and subject movement in diffusion MR imaging. NeuroImage, 125:1063-1078, 2016. 7.
- Zhang, Y. and Brady, M. and Smith, S. Segmentation of brain MR images through a hidden Markov random field model and the expectation-maximization algorithm. IEEE Trans Med Imag, 20(1):45-57, 2001.
- Desikan, R.S., Segonne, F., Fischl, B., Quinn, B.T., Dickerson, B.C., Blacker, D., Buckner, R.L., Dale, A.M., Maguire, R.P., Hyman, B.T., Albert, M.S., Killiany, R.J., 2006. An automated labeling system for subdividing the human cerebral cortex on MRI scans into gyral based regions of interest. Neuroimage 31, 968-980.
- Wasserthal J, Neher P, Maier-Hein KH (2018) TractSeg - Fast and accurate white matter tract segmentation. Neuroimage 183:239–253.
- Larry V. Hedges & Ingram Olkin (1985). Statistical Methods for Meta-Analysis. Orlando: Academic Press. ISBN 978-0-12-336380-0.
Figures
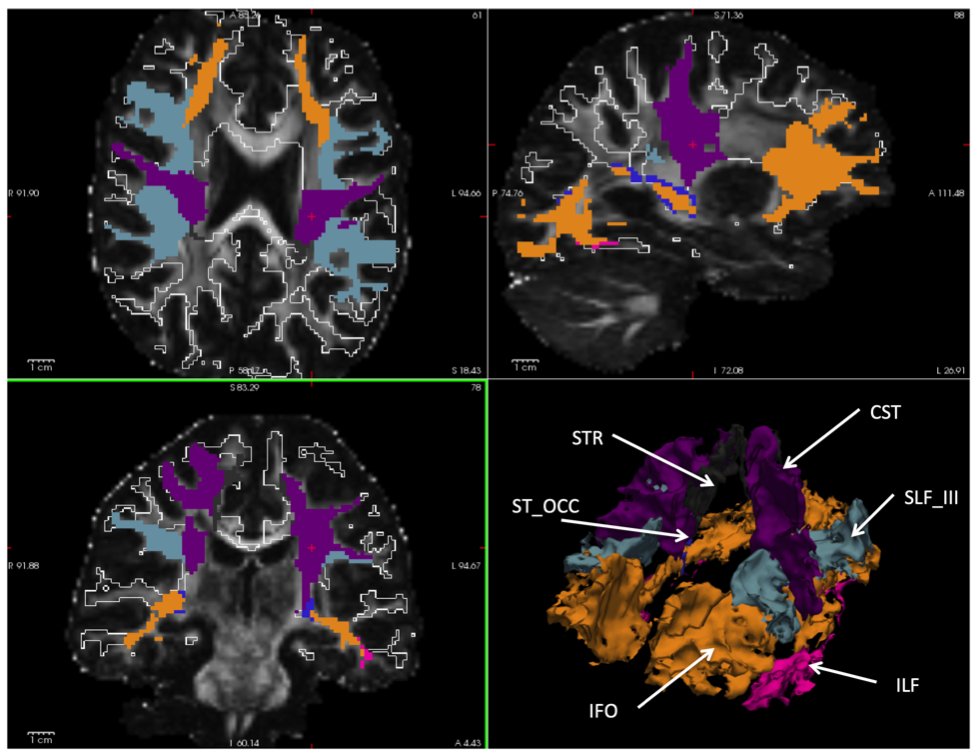
Fig. 1 Axial, sagittal, coronal and
3D isosurfaces visualization of individual white matter sub-parcellation
generated by an automated white matter tract segmentation (TractSeg) based on
the diffusion data. The color-coded white matter partitions are mapped onto the
FA maps of the corresponding subject. The white outline indicates the full normal-appearing white matter ROI without lesion areas.
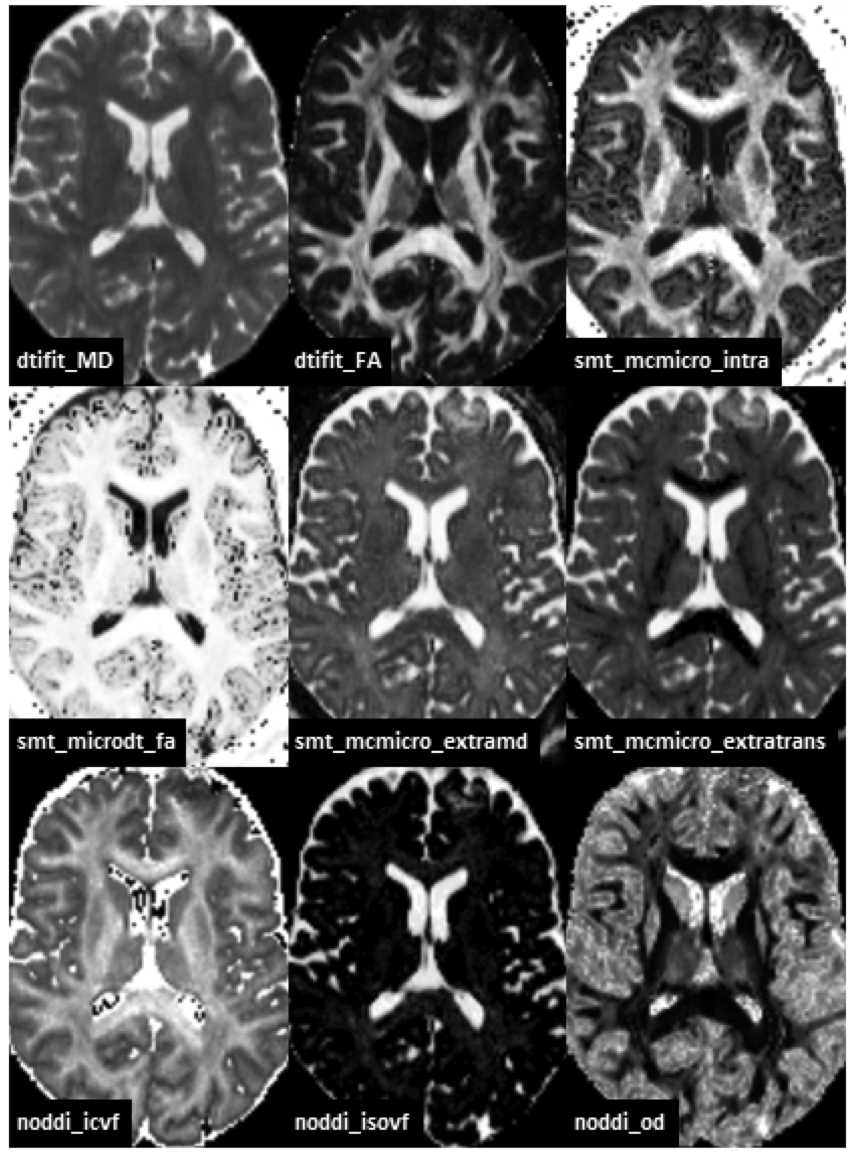
Fig. 2 Axial slice for all analyzed
diffusion metrics of a healthy volunteer. DTIFIT maps were computed using
dtifit from the FSL package, SMT maps were computed using the binaries from
Spherical Mean Technique software package and noddi metrics were computed
using the AMICO NODDI python implementation.
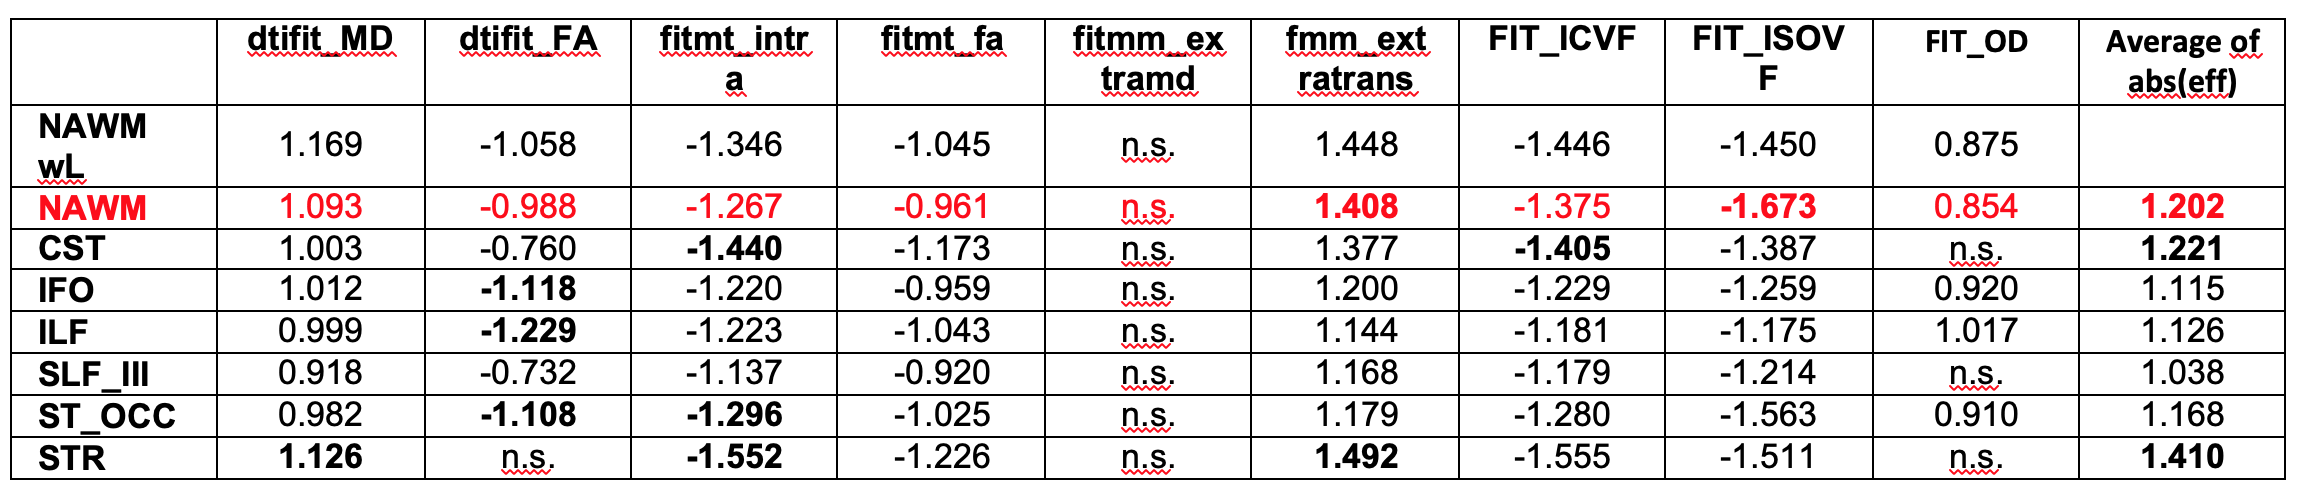
Tab. 1 List of effect sizes for
differences between of mean diffusion metrics between ROI data of MS patients
and healthy controls. The main results (NAWM) is colored in red. The effect
size was computed based on Glass D method [10] using the standard deviation of
the HC group as reference. The effect size represents the observed differences
of the means with respect to the standard deviation. (n.s. = not significant).
The last column list the average effect size for each corresponding region
computed as mean of absolute effect sizes.
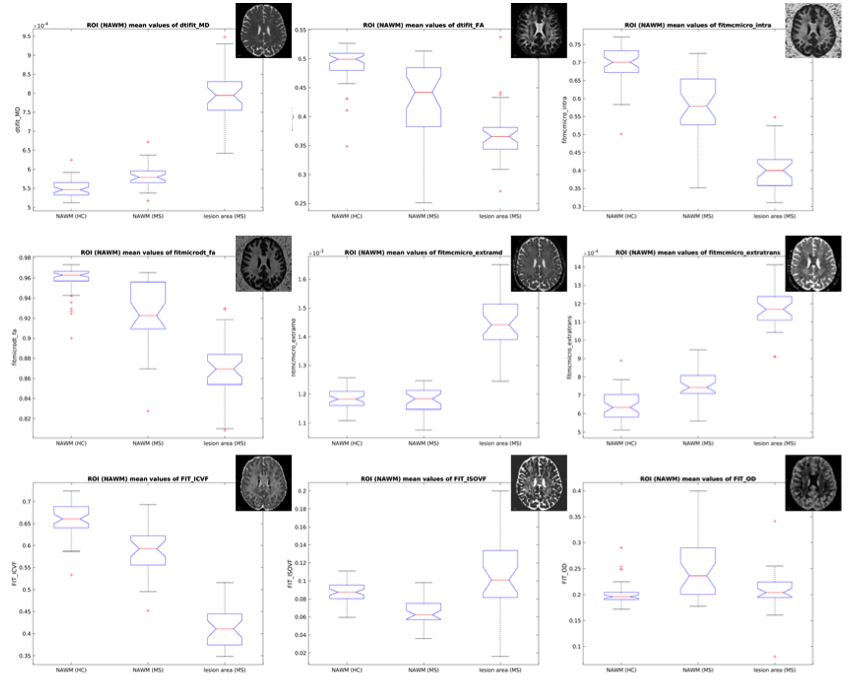
Fig. 4 The box plots allow the visual comparison of NAWM
ROI data for the 9 different diffusion metrics used in the analysis. In order
to compare NAWM values to typical lesion values, each subfigure contains also
the box plot for the lesion area. The small diffusion maps in the upper right
corner represent the corresponding diffusion metric maps of an example MS subject.