1394
Evaluation of different diffusivity and cognitive measures in subcortical regions in healthy subjects and RRMS patients.1Biomedical Imaging Center, Pontificia Universidad Católica de Chile, Santiago, Chile, 2Radiology Department, School of Medicine, Pontificia Universidad Católica de Chile, Santiago, Chile, 3Millennium Nucleus for Cardiovascular Magnetic Resonance, Santiago, Chile, 4Institute of Cognitive Neuroscience, University College London, London, UK., London, United Kingdom, 5Interdisciplinary Center of Neurosciences, Pontificia Universidad Católica de Chile, Santiago, Chile, 6Faculty of Engineering, Universidad de Concepción, Concepción, Chile, Concepción, Chile, 7UNATI, Neurospin, CEA,, Université Paris-Saclay, Gif-sur-Yvette, France, 8Neurology Department, School of Medicine, Pontificia Universidad Católica de Chile, Santiago, Chile, 9Neurology Service, Hospital Dr. Sótero del Río, Santiago, Chile, Santiago, Chile
Synopsis
We evaluated different diffusivity measurements of subcortical regions that can be related with different test scores in FAS, SDMT and PASAT test. For this purpose, we evaluated the FA, MD, RD and AD diffusivity maps of U-fibers with the test scores in healthy subjects and RRMS patients. In our sample, FAS test scores are significant linear related with Postcentral gyrus with RD and MD maps in RRMS patients. PASAT test scores are significant linear related with Precentral gyrus with FA and RD maps in healthy subjects. There is no linear relationship between SDMT test score and diffusivity maps.
Introduction
Multiple Sclerosis (MS) patients develop cognitive impairment at early stages of the disease (1,2). Cognitive decline can be assessed with a series of tests, such as the symbol digit modalities test (SDMT), the Paced Auditory Serial Addition Test (PASAT) and FAS test (3). Magnetic Resonance has been established as a common technique for the diagnosis and follow-up of the disease (4). Non-conventional MR techniques have demonstrated a high degree of specificity and sensitivity in detecting patients with MS. Diffusion-weighted imaging highlight the brain’s microstructural damage and demyelination, through different types of diffusivity indices, such as Fractional Anisotropy, and mean, axial and radial diffusivity (FA, MD, AD, and RD, respectively) (5). However, the imaging findings do not correlate with patient clinical symptoms (6).In this work, we evaluated which of the diffusivity measures of subcortical regions, are related to the corresponding test scores.
Materials and Methdos
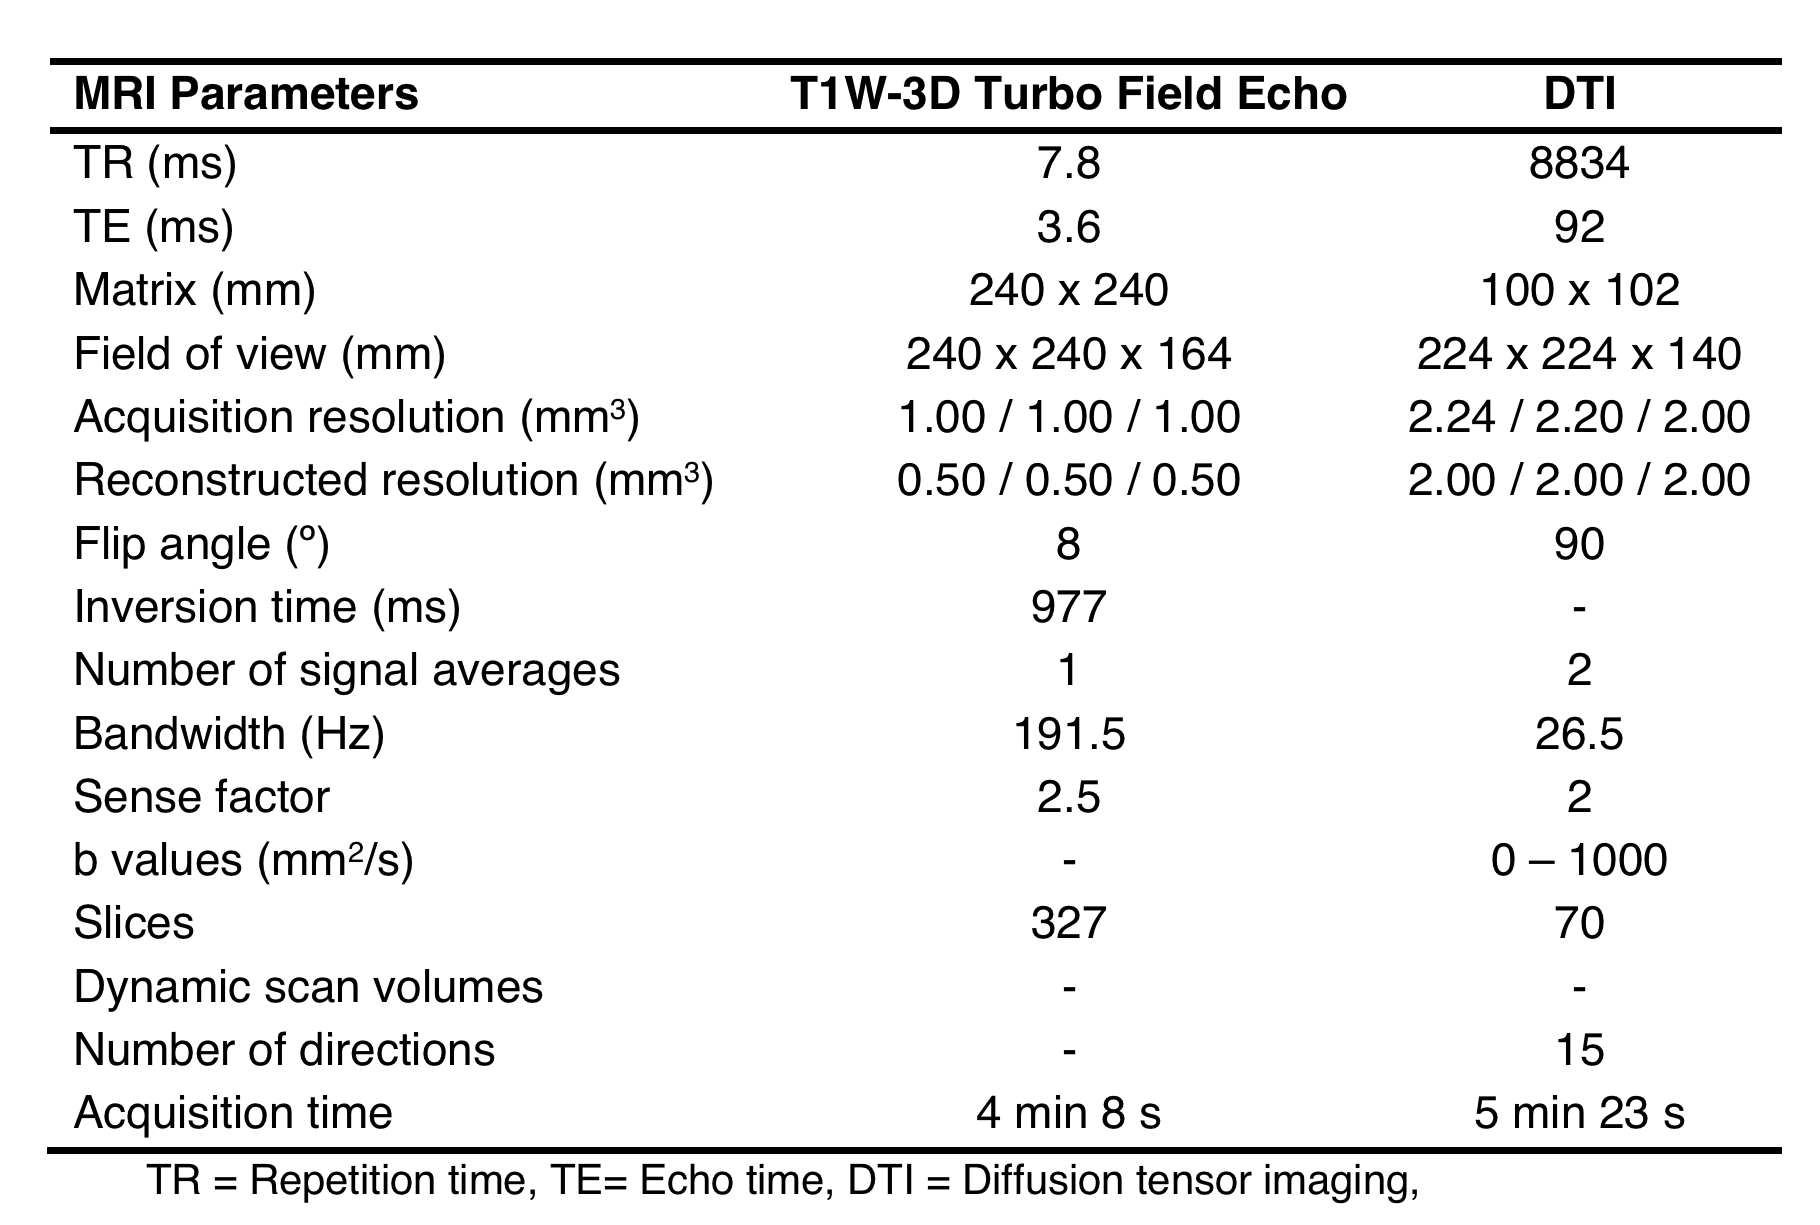
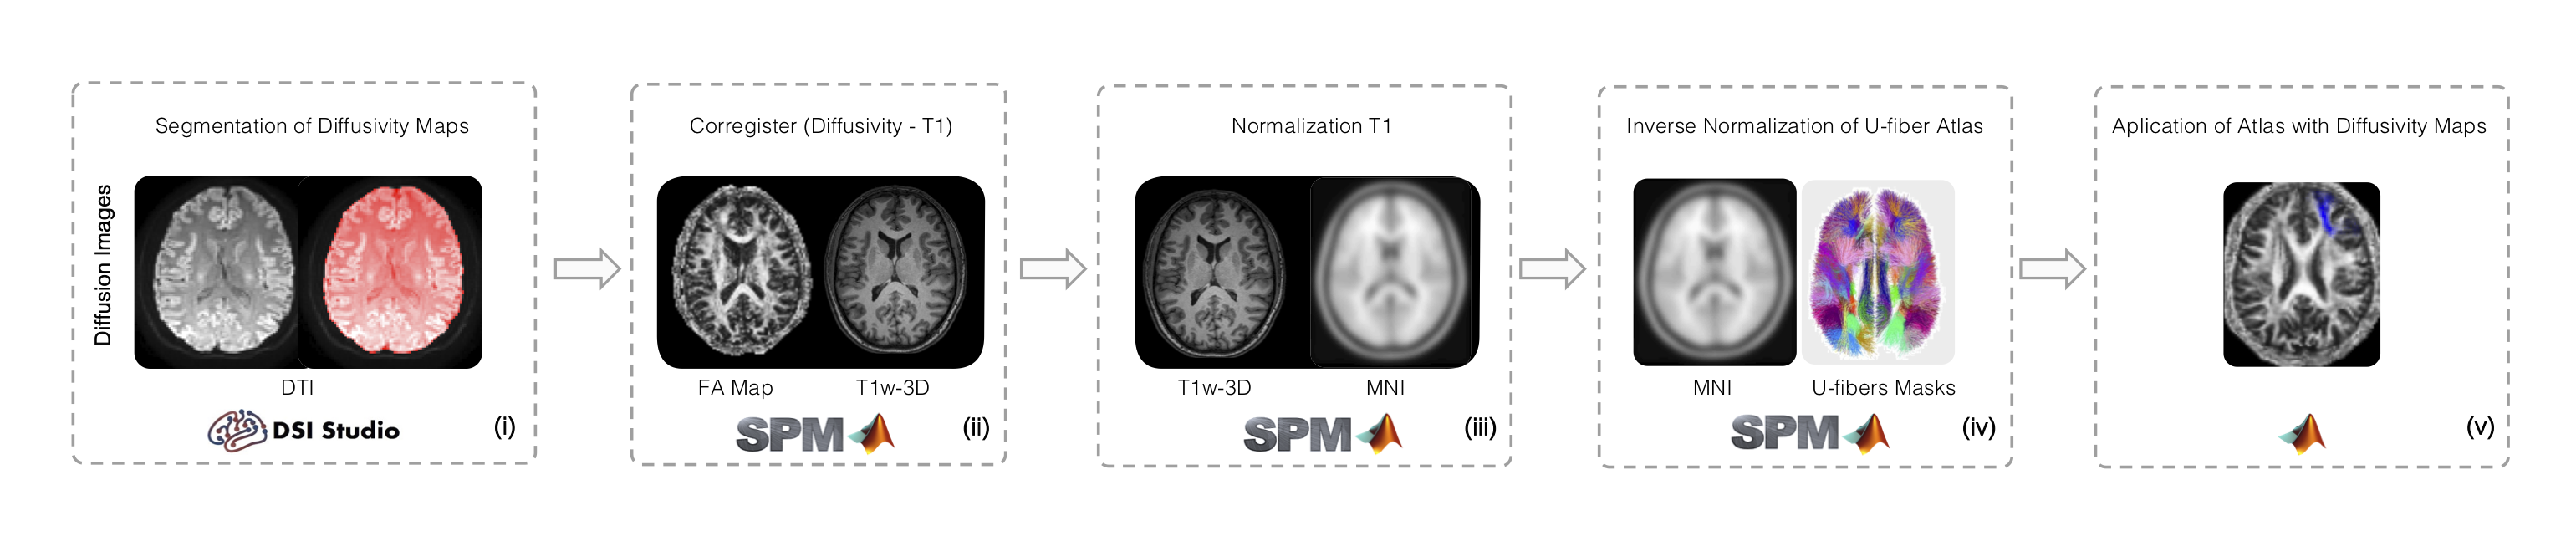
Healthy subjects (21 males with mean age 38 years, range 24 - 60 years old; 25 females with mean age 38 years, range 23 - 63 years old ) and relapsing-remitting (21 males with mean age 35 years, range, 21 - 50 years old; 25 females with mean age 38 years, range 22 - 63 years old) multiple sclerosis (RRMS) patients , diagnosed according to McDonald’s Criteria (4), were scanned on a 3T MRI scanner (Philips Ingenia, Best, Netherlands). Diffusion weighted images were acquired to calculate FA, RD, AD and MD through Diffusion Tensor Imaging (DTI). T1-weighted images were acquired as anatomical reference. MRI acquisition parameters are summarized in Table 1. All subjects had at least 13 years of education and did not have any MR-incompatible implants. RRMS patients and healthy subjects underwent SDMT, FAS and PASAT tests. The study was approved by the local ethics committee.FA, RD, AD and MD maps were calculated using DSI Studio (http://dsi-studio.labsolver.org). The resulting maps were then coregistered with T1-weighted images. Since the U-fiber masks from LNAO-SWM79 Atlas are in MNI space, we used a spatial transformation to bring them to a subject-specific space. All preprocessing steps were performed by using SPM12 (http://www.fil.ion.ucl.ac.uk/spm/software/spm12/) (Figure 1).
U-fiber masks from LNAO-SWM79 Atlas (7) were applied to each subject’s map to obtain the mean FA, RD, AD and MD to each subject’s U-fiber (Figure 1).
We performed 3 backward-elimination multiple regressions using SPSS21 (Armonk, NY: IBM Corp) to identify the independent predictors of each one of the three tests (SDMT, FAS and PASAT) scores with the diffusivity maps. The regressors were the U-fibers with the mean diffusivity of the latter.
Results
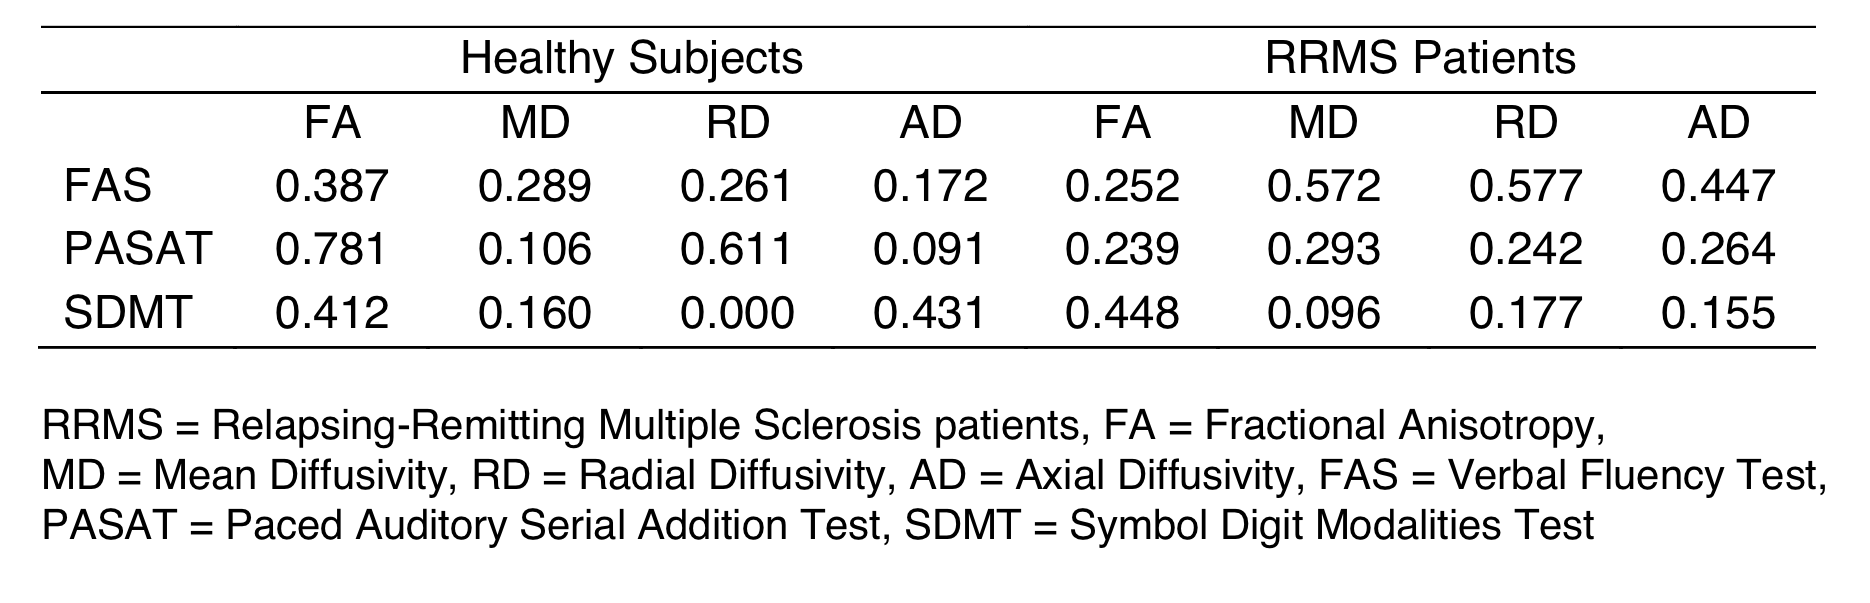
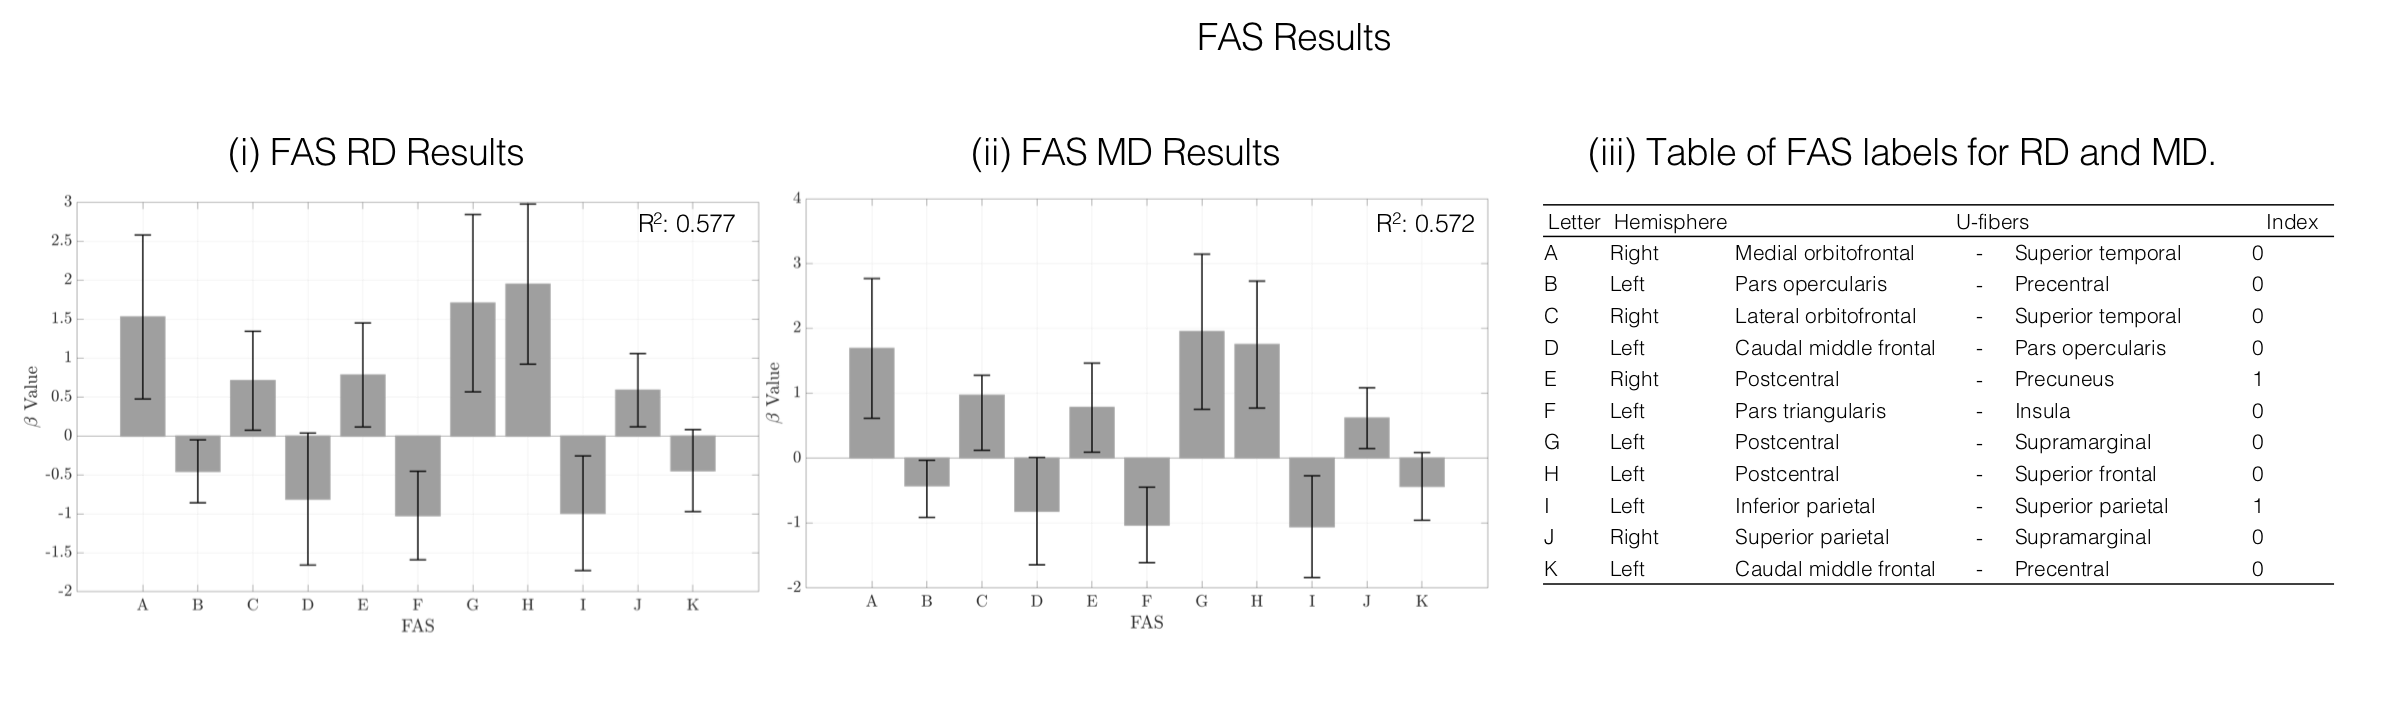
Table 2 summarizes each regression’s R2. Figures 2 and 3 show the statistically significant (p<0.05) beta values of the regressions predicting the FAS and PASAT test results, respectively.FAS test score was better predicted by MD and RD measures in RRMS patients, with a R2 score of 0.572 and 0.577, respectively. Frontal, Parietal and Temporal lobes are better predicted for both maps (Figure 2). In general, the beta values of all U-fibers for FAS test have similar scores. For RD map, the U-fiber Left Postcentral with supramarginal gyrus has the highest beta value. For MD map, the Left Postcentral with superior frontal gyrus has the highest beta value.
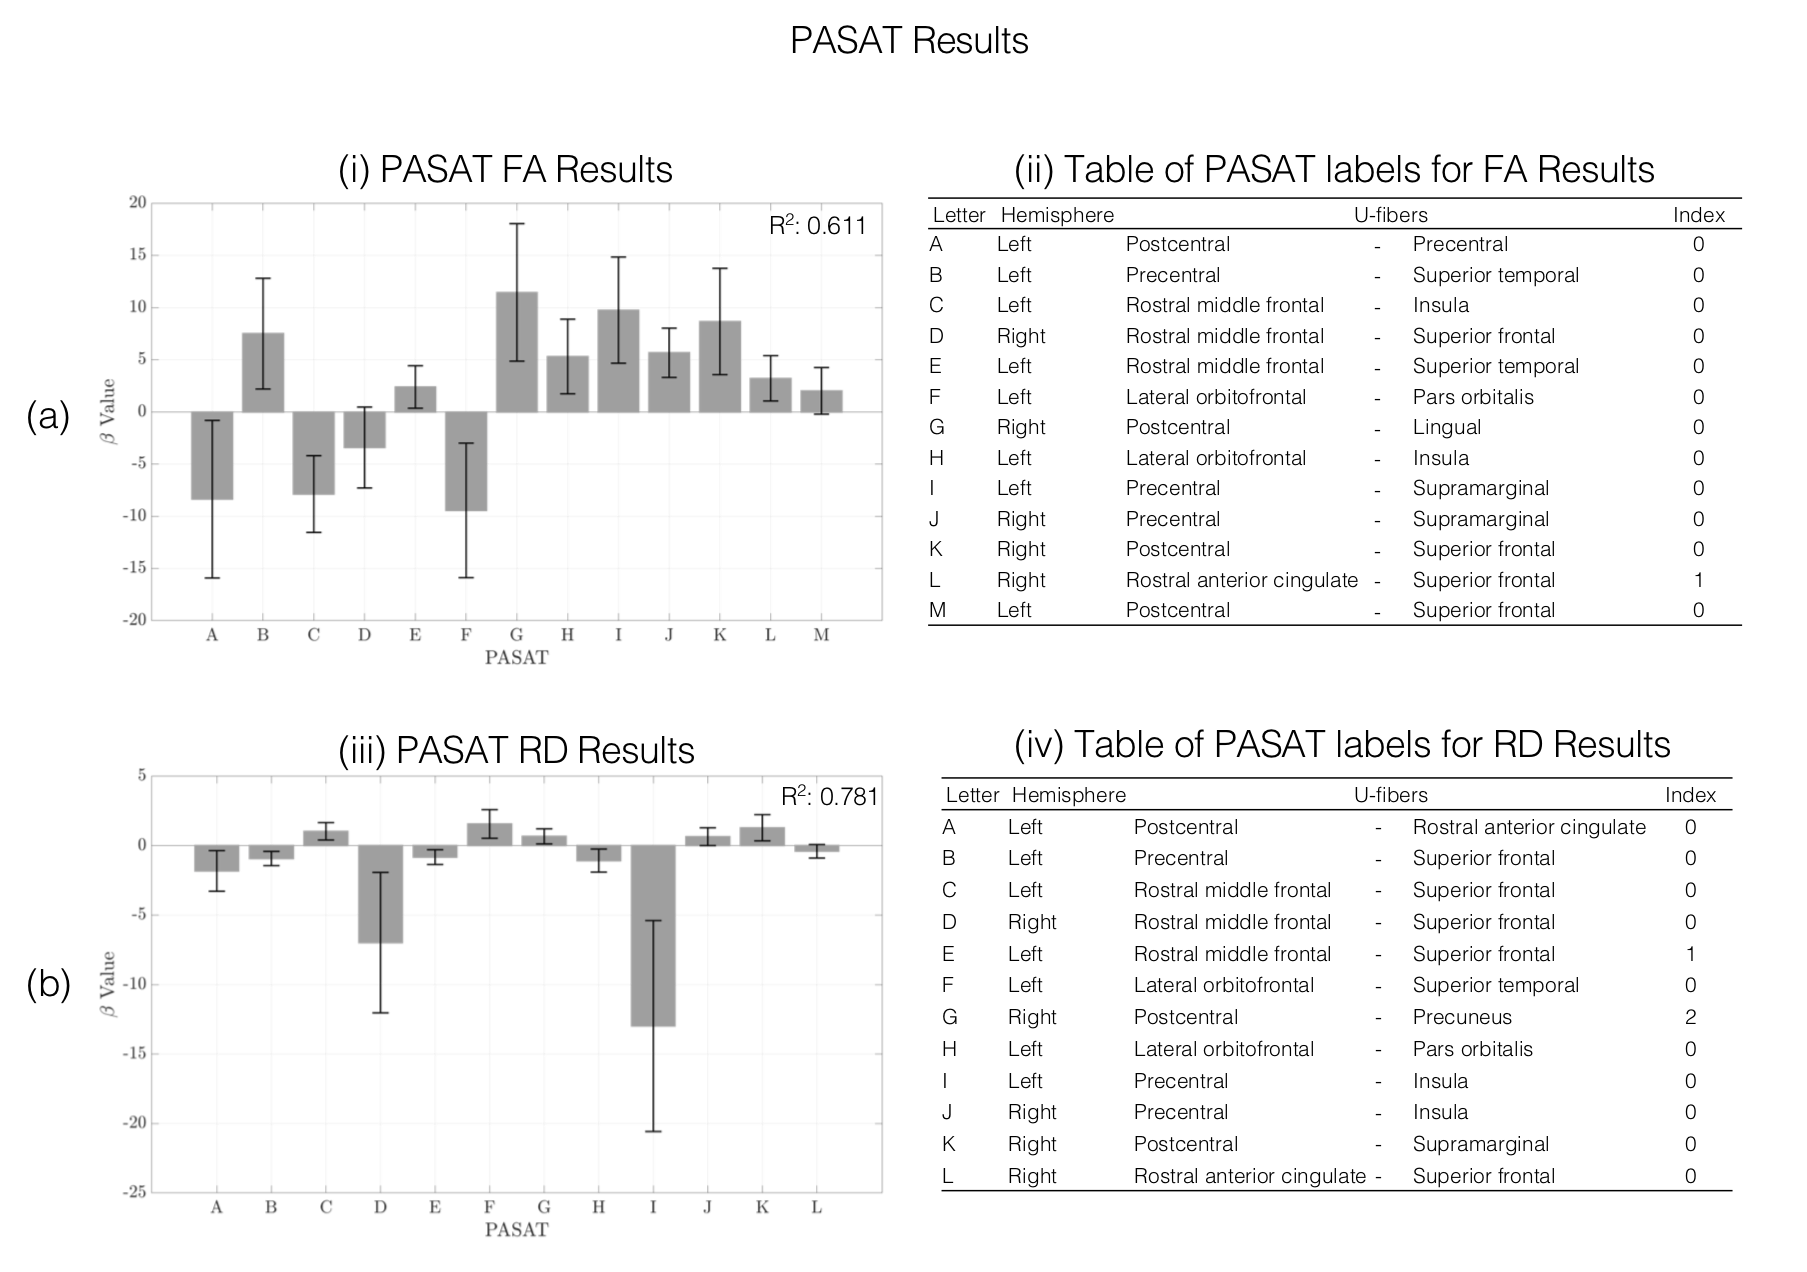
PASAT test score was better predicted in healthy subjects in FA and RD maps, with a R2 score of 0.781 and 0.611, respectively. Frontal and Parietal lobes are better predicted for both maps (Figure 3). For FA map, the U-fiber Left Post central and Lingual gyrus has the highest beta value. For RD map, the Left Post central and Insula gyrus has the highest beta value.
There is no linear relationship between SDMT test score and diffusivity maps.
Discussion and Conclusion
The results presented in this study show that the FAS test and PASAT scores of healthy subjects and RRMS patients, respectively are better fitted with several diffusivity maps. FAS test scores are significant linear related with Postcentral gyrus U-fiber with RD and MD maps. PASAT test scores are significant linear related with Precentral gyrus U-fiber with FA and RD maps. In other MS studies, they found that FA, RD and MD measurements can discriminate between patients with high and low cognitive disability levels (8-10).The U-fiber with the highest beta values could be considered as subcortical region that that might relate the cognitive performance in early stages of RRMS. A better understanding of how this disease affects the subcortical regions and indicates that a possible effect of diffusivity maps with test scores.
Future work should include more series of tests, in order to find a relation between the cognitive performance with the diffusivity measurements within the U-fibers.
Acknowledgements
This publication has received funding from Millenium Science Initiative of the Ministry of Economy, Development and Tourism, grant Nucleus for Cardiovascular Magnetic Resonance. Also, has been supported by CONICYT - PIA - Anillo ACT1416References
1. Audoin B, Au Duong MV, Ranjeva JP, et al. Magnetic resonance study of the influence of tissue damage and cortical reorganization on PASAT performance at the earliest stage of multiple sclerosis. Hum Brain Mapp. 2005 Mar;24(3):216-28.
2. Audoin B, Ranjeva JP, Au Duong MV, et al. Voxel-based analysis of MTR images: a method to locate gray matter abnormalities in patients at the earliest stage of multiple sclerosis. J Magn Reson Imaging. 2004 Nov;20(5):765-71.
3. Baysal Kıraç L, Ekmekçi Ö, Yüceyar N, et al. Assessment of early cognitive impairment in patients with clinically isolated syndromes and multiple sclerosis. Behav Neurol. 2014;2014:637694.
4. Polman CH, Reingold SC, Banwell B, et al. Diagnostic criteria for multiple sclerosis: 2010 revisions to the McDonald criteria. Ann Neurol. 2011 Feb;69(2):292-302.
5. Sbardella E, Tona F, Petsas N, et al. DTI Measurements in Multiple Sclerosis: Evaluation of Brain Damage and Clinical Implications. Mult Scler Int. 2013;2013:671730.
6. D. Mollison, R. Sellar, M. Bastin,et al. The clinico-radiological paradox of cognitive function and MRI burden of white matter lesions in people with multiple sclerosis: a systematic review and meta-analysis. PLoS One, 12 (5) (2017), Article e0177727.
7. Guevara M, Román C, Houenou J, et al. Reproducibility of superficial white matter tracts using diffusion-weighted imaging tractography. Neuroimage. 2017 Feb 15;147:703-725.
8. Winklewski PJ, Sabisz A, Naumczyk P, et al. Understanding the Physiopathology Behind Axial and Radial Diffusivity Changes-What Do We Know?. Front Neurol. 2018 Feb 27;9:92.
9. Koenig KA, Sakaie KE, Lowe MJ, et al. The relationship between cognitive function and high-resolution diffusion tensor MRI of the cingulum bundle in multiple sclerosis. Mult Scler. 2015 Dec;21(14):1794-801.
10. Rimkus Cde M, Junqueira Tde F, Lyra KP, et al. Corpus callosum microstructural changes correlate with cognitive dysfunction in early stages of relapsing-remitting multiple sclerosis: axial and radial diffusivities approach. Mult Scler Int. 2011;2011:304875.
Figures