1392
Optimization and evaluation of multi-compartment diffusion MRI using the spherical mean technique for practical multiple sclerosis imaging1Institute of Imaging Science, Vanderbilt University Medical Center, Nashville, TN, United States, 2Chemical and Physical Biology Program, Vanderbilt University, Nashville, TN, United States, 3Department of Radiology and Radiological Sciences, Vanderbilt University Medical Center, Nashville, TN, United States, 4Neuroimaging Unit/Neuroimmunology Division, Department of Neurology, Vanderbilt University Medical Center, Nashville, TN, United States, 5Department of Biomedical Engineering, Vanderbilt University, Nashville, TN, United States, 6Department of Physics and Astronomy, Vanderbilt University, Nashville, TN, United States
Synopsis
Multi-compartment diffusion imaging using the spherical mean technique (SMT) is a recently developed method that provides more specific information for probing axonal properties in e.g., multiple sclerosis (MS) patients. However, the accuracy and precision of SMT have not been comprehensively investigated to date. We used Cramér-Rao Lower Bound (CRLB) analysis and MS patient data to optimize an SMT acquisition protocol for practical MS imaging. Second, we used computer simulations to comprehensively evaluate the accuracy and precision of SMT for reporting axonal information under various pathologic conditions. The results support better implementation and interpretation of SMT imaging for MS patients.
Introduction
Axonal injury is a debilitating effect of multiple sclerosis (MS) and a key contributor to physical disability in patients. An accurate and precise biomarker linking in vivo imaging to pathological axonal characterization could improve the clinical study and treatment of MS. One such candidate is a recently developed diffusion MRI method – namely, the spherical mean technique (SMT)1 – which has shown to be sensitive to various lesion types in MS through voxel-wise mapping of apparent axonal volume fraction2,3. However, the accuracy and precision of SMT in probing axonal information have not been comprehensively investigated, hindering the application of SMT in MS. To assist implementation and interpretation of clinical MS imaging, we first used previously published SMT results of MS patients to optimize an SMT acquisition protocol for practical MS imaging, and then used computer simulations to determine the accuracy and precision of SMT in providing axonal information under different pathological conditions that may occur in MS lesions.Methods
Optimization: To optimize precision for better diagnostic specificity, we use a Cramér-Rao Lower Bound (CRLB) approach to minimize the variance of SMT-derived apparent volume fraction (vax) with Rician noise (SNR = 20). We limit signals to a total of 100 acquisitions to match the clinically tractable scan time of the widely-used, optimized NODDI acquisition scheme4. Four types of tissues were considered: normal white matter, normal appearing white matter, T2-hyperintense lesions, and chronic black-hole lesions. Ground truth SMT metrics were obtained from MS patient data (N=17), giving Dax ∈ (1.9, 1.8, 1.7, 1.7) µm2/ms and vax ∈ (60.7, 45.0, 36.5, 24.1%), respectively for the above tissues2,3. The optimization minimizes the maximal vax CRLB over all tissues – i.e., the worst-case variance.Computer simulations: Axon bundles were modeled as a two-compartment system; i.e., packed cylinders with a distribution of axon diameters (AxD’s) with various values of vax. Intra- and extra-axonal diffusivities were determined from references5,6 as 2.25 and 2.0 μm2/ms, respectively. A Finite Difference method7 was used to simulate noise-free diffusion MRI signals. Random Rician noise at SNR=20 was added to the signals and then SMT fitting was performed using the code available at (https://ekaden.github.io). The fitting accuracy was evaluated using the absolute differences between the mean fits and the ground truth values, and fitting precision was evaluated using the coefficient of variance (COV), i.e., the standard deviations divided by the mean results. Five simulation studies were performed to investigate performance of SMT under different pathologic conditions (Figure 2 through Figure 5).
Results and Discussion
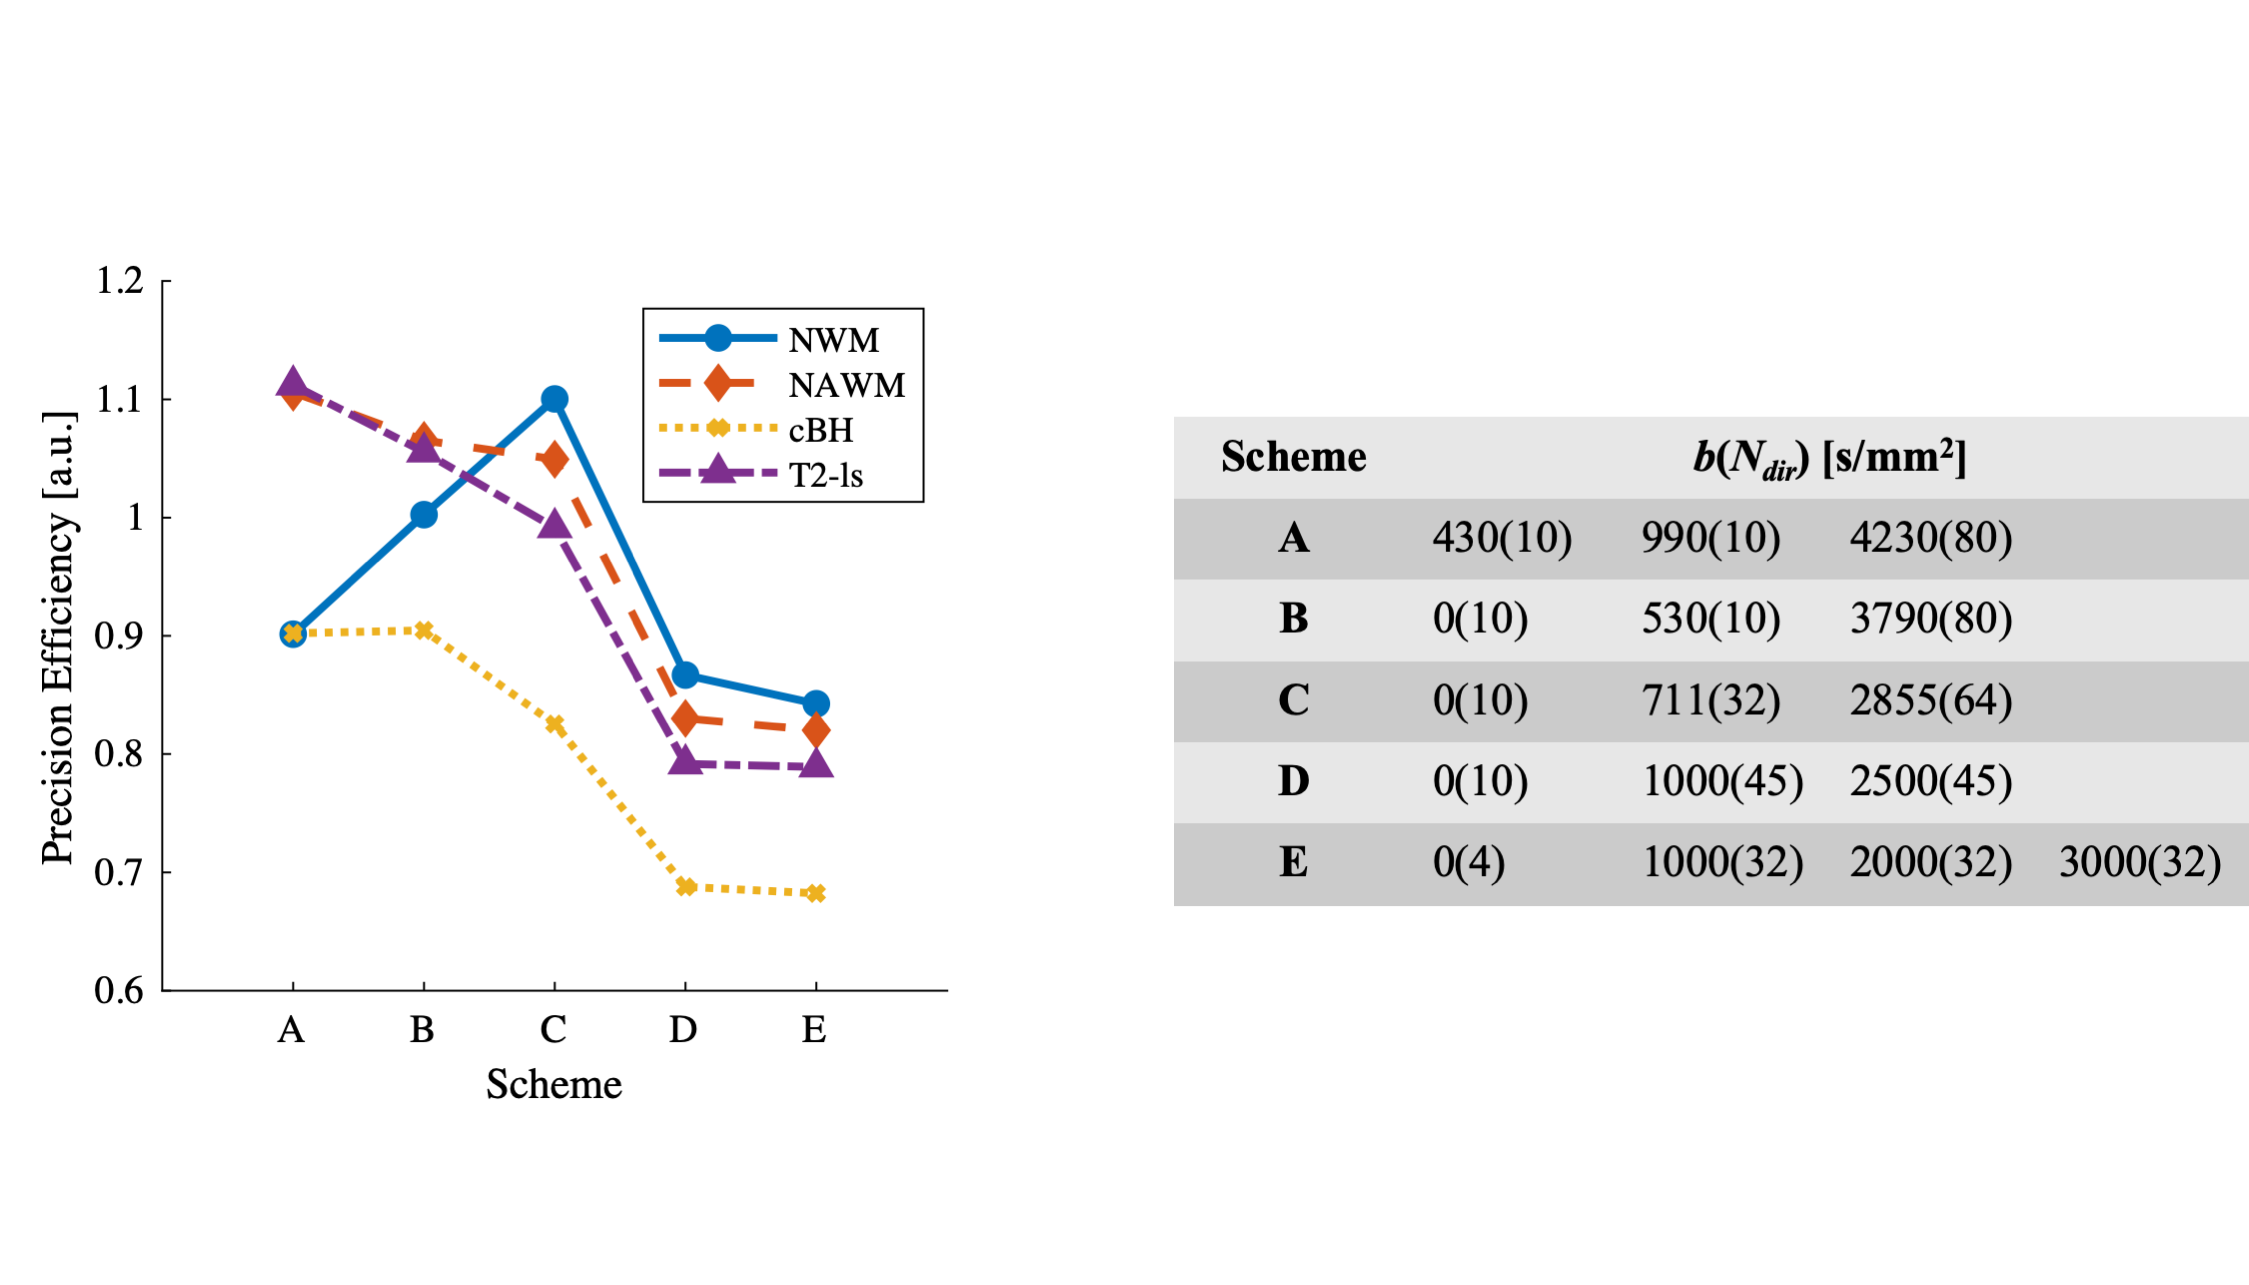
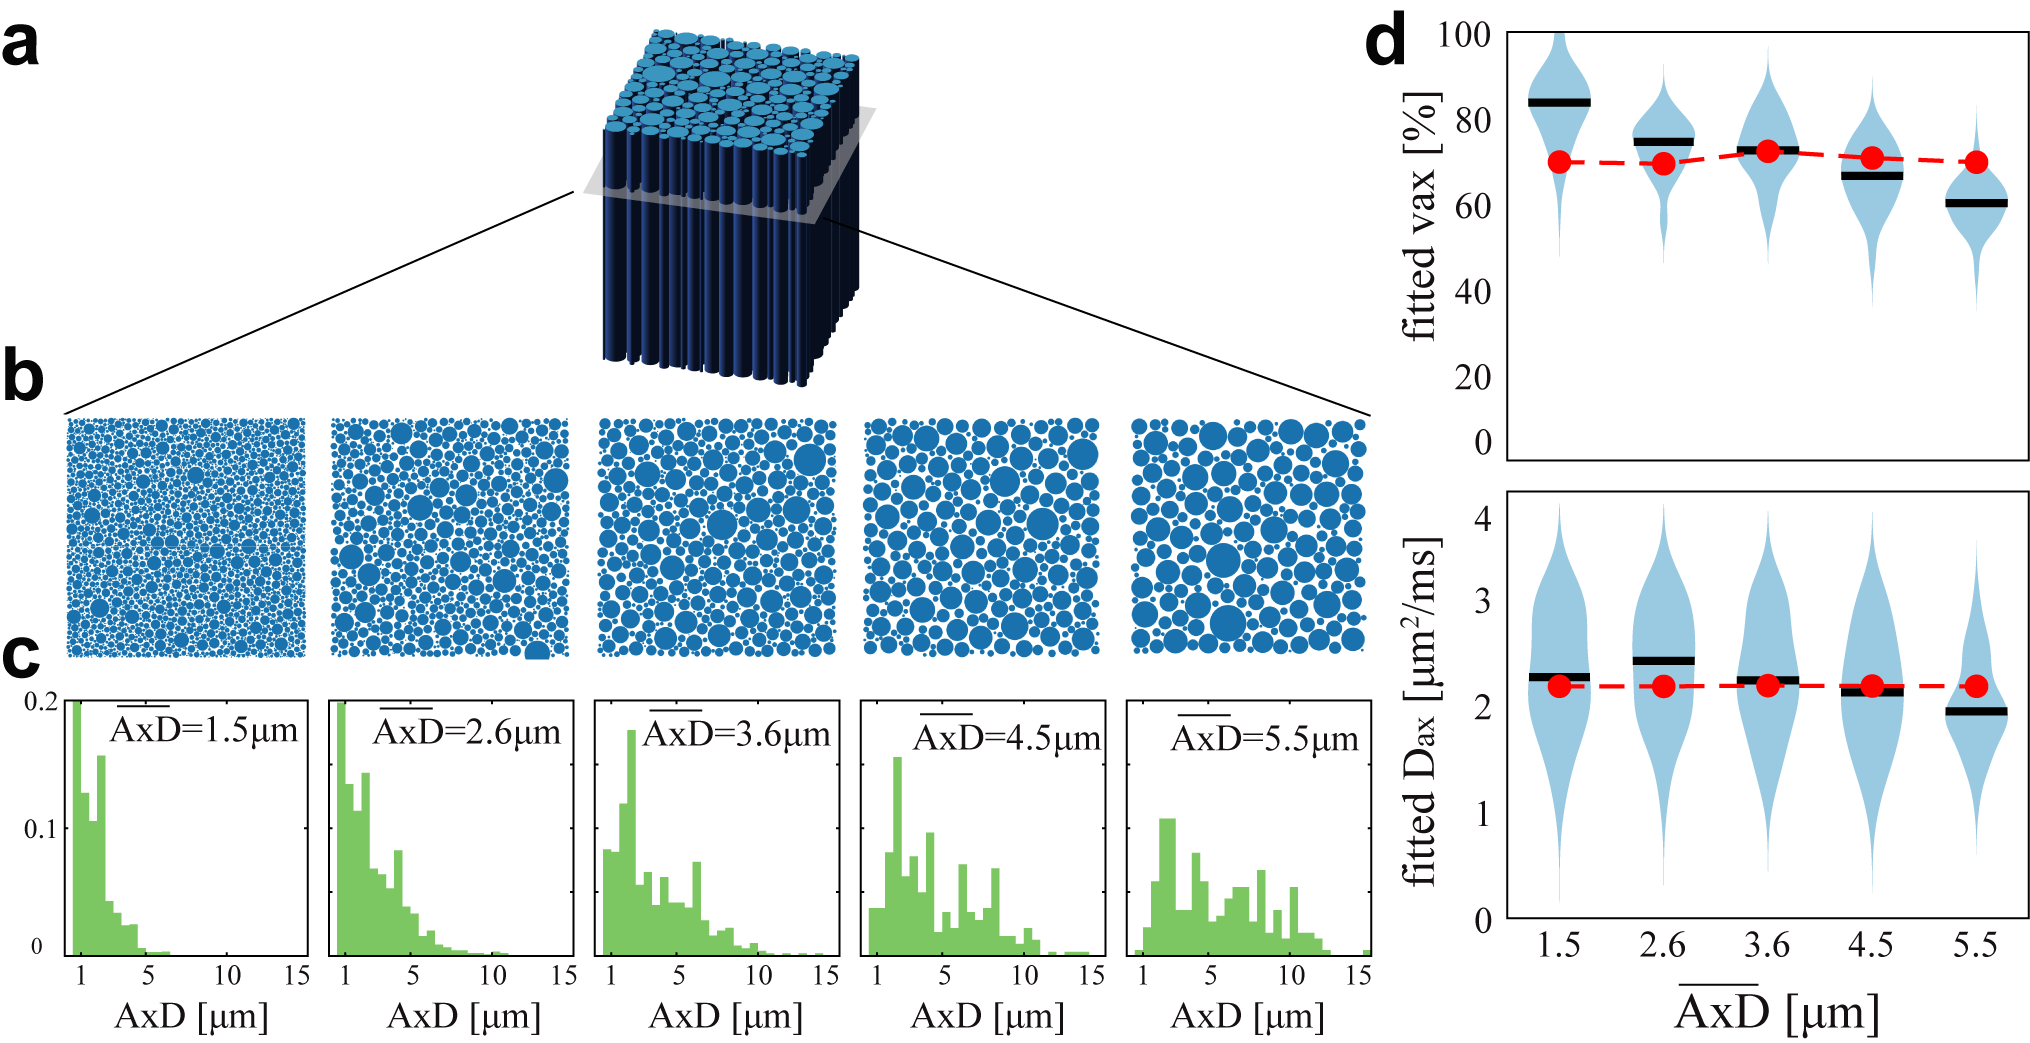
The optimization process yielded an acquisition scheme, described as b-value (number of directions Ndir at the b shell), of {430(10), 990(10), 4230(80) s/mm2}. Figure 1 compares this optimized acquisition scheme to other protocols.Figure 2 shows the influences of AxD distribution on SMT fitted metrics. For a physiologically relevant range of mean AxDs, SMT provides accurate fits of vax from 2.6 to 4.5 μm (differences < 6% of the true values) but overestimates vaxby 18% for small mean AxD (1.5 μm) while underestimating vaxby -13% for large AxD (5.5 μm). Presumably, this is because at small mean AxD, extra-axonal diffusivity at some regions is highly restricted and close to zero. SMT uses zero transverse diffusion as a marker of thin axons, so it could misidentify some extra-axonal space as axonal spaces and hence overestimate vax. Similarly, when AxD is very large, some intra-axonal is not zero so that SMT fitting can misidentify parts of these large axons as extra-axonal space. For Dax fittings, although the accuracy is desirable (differences < 8%), the COV’s are > 70% for all mean AxD values. This is consistent with previous reports of SMT imaging in MS patients that Dax is not a reliable indicator of MS lesions due to large variance.
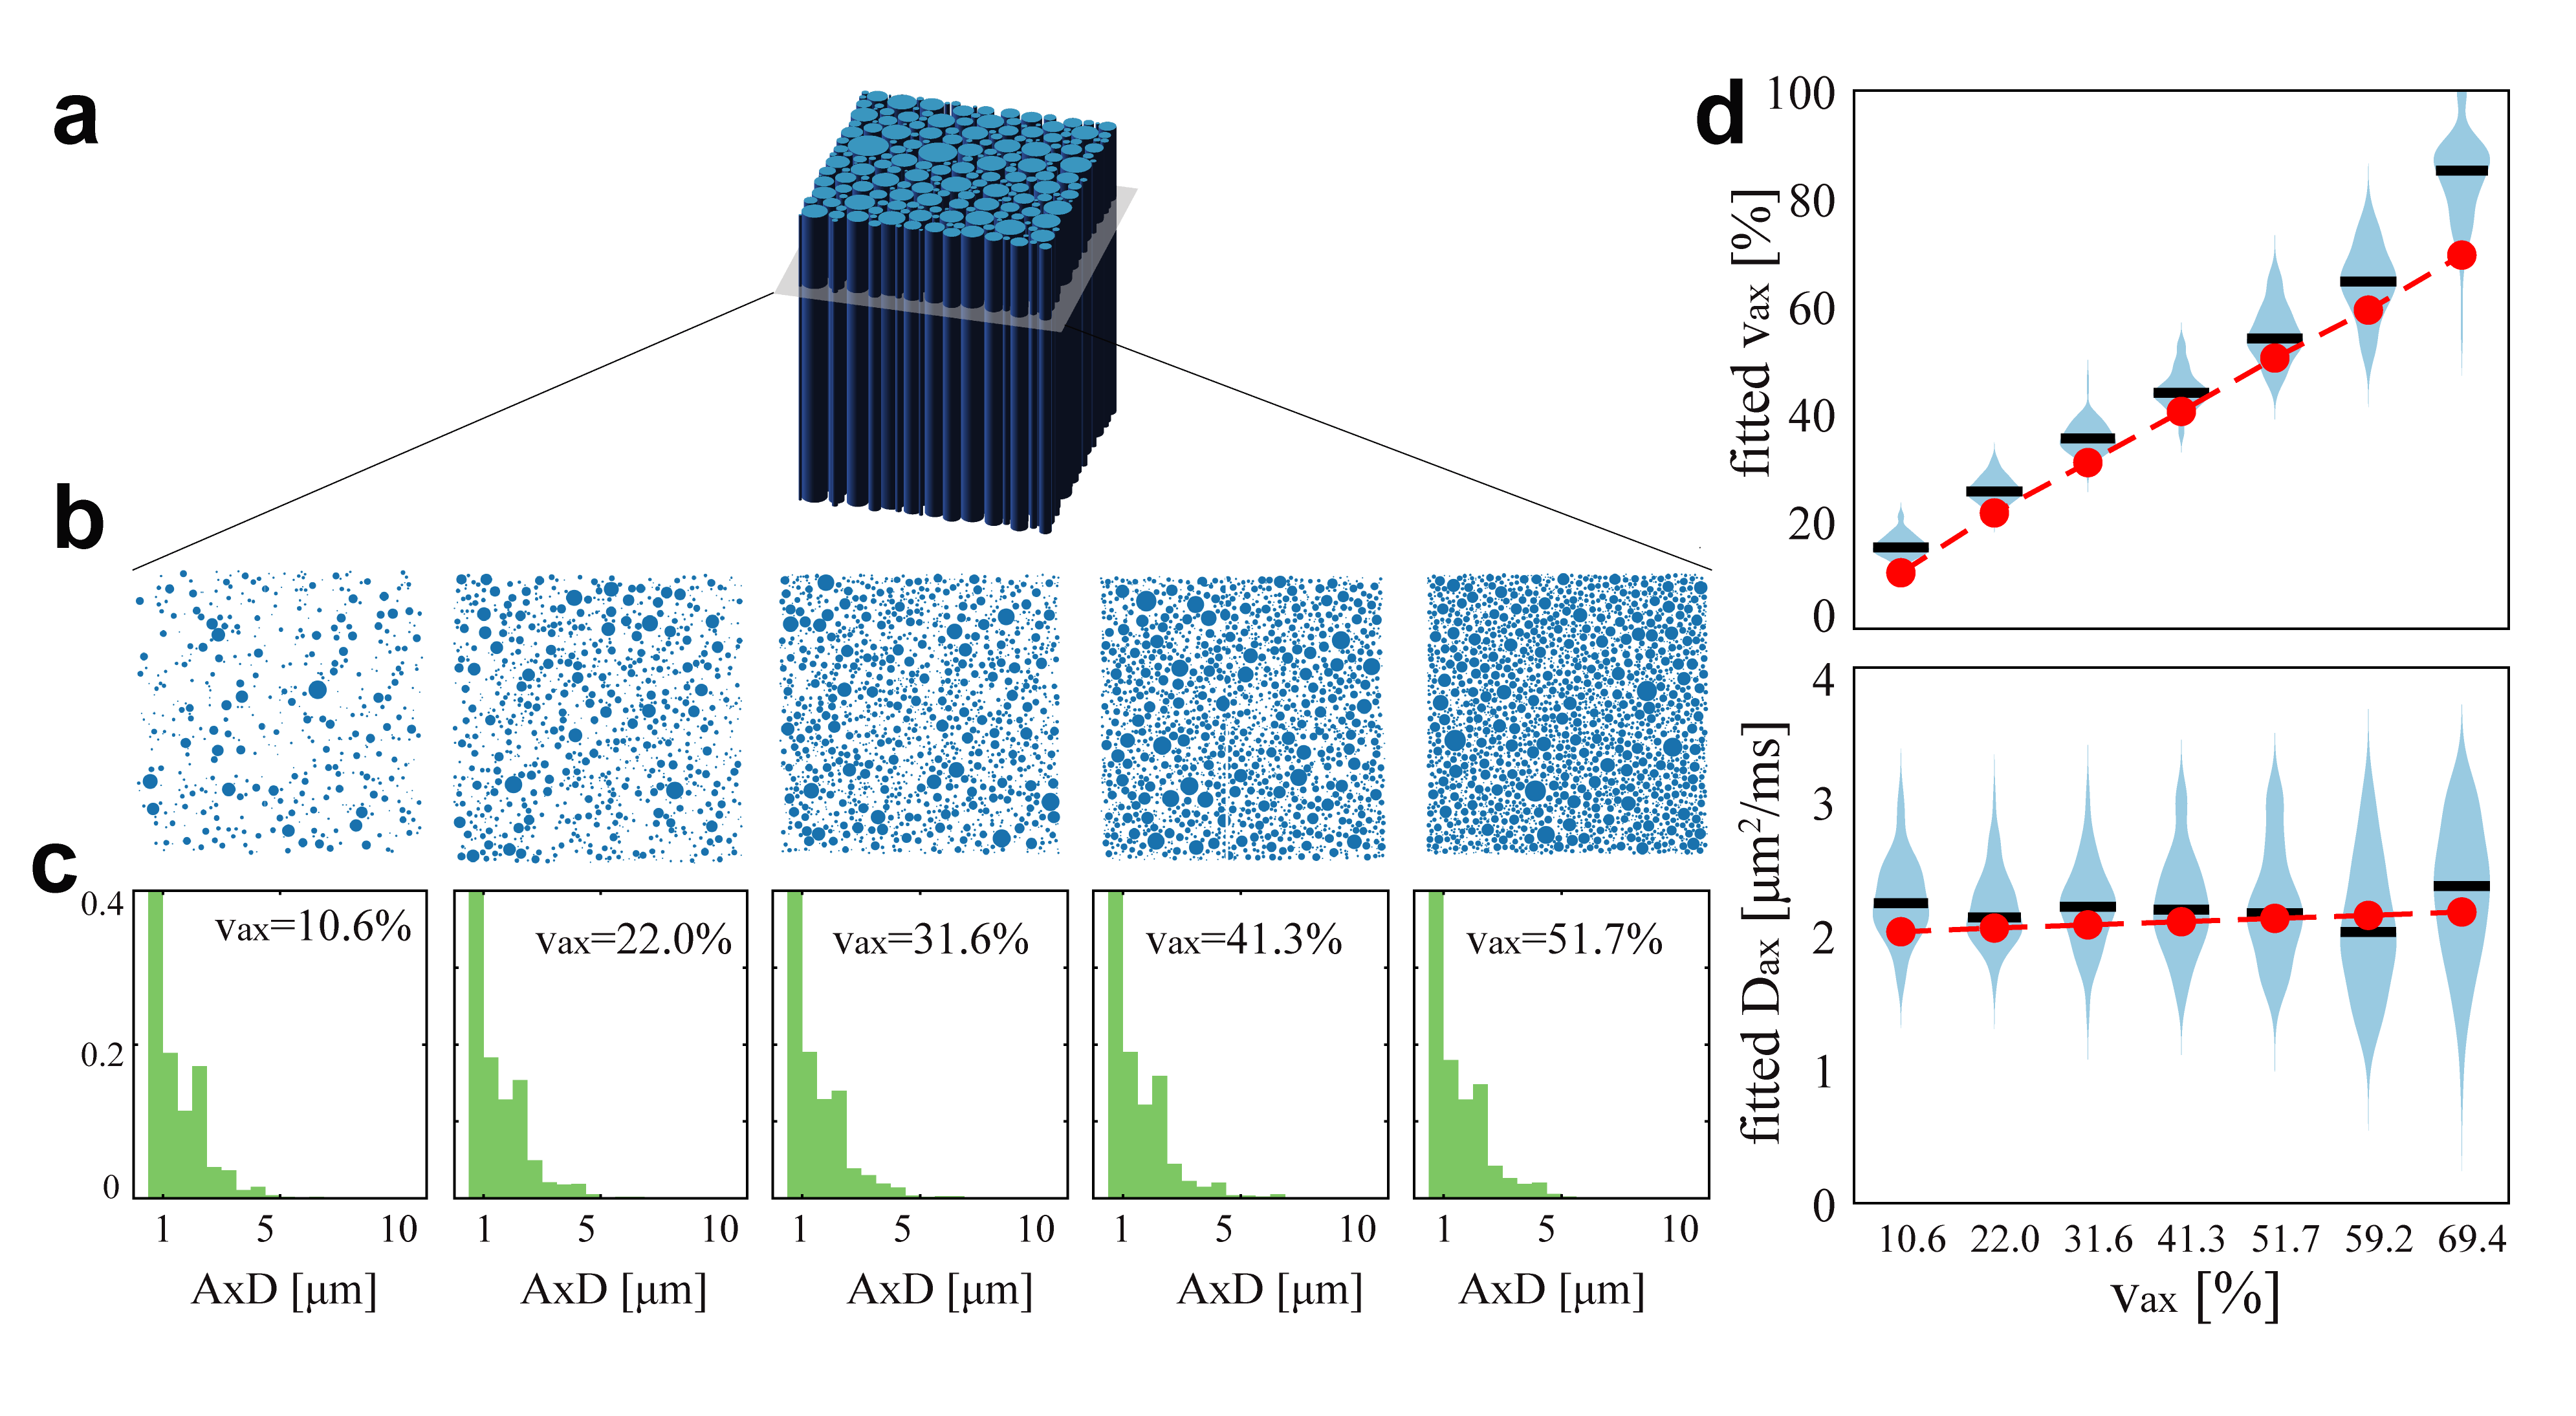
Figure 3 shows the influences of the ground truth vaxon the estimates of vaxand Dax. Despite consistent overestimates of vax (~8.8 – 46.7%), the fitted vax shows a clear linear correlation with ground truth vax (r = 0.97, p<0.01 using Pearson’s correlation). This suggests vax can be used a sensitive indicator to axonal contents, which is consistent with previous reports of SMT imaging in MS2,3.
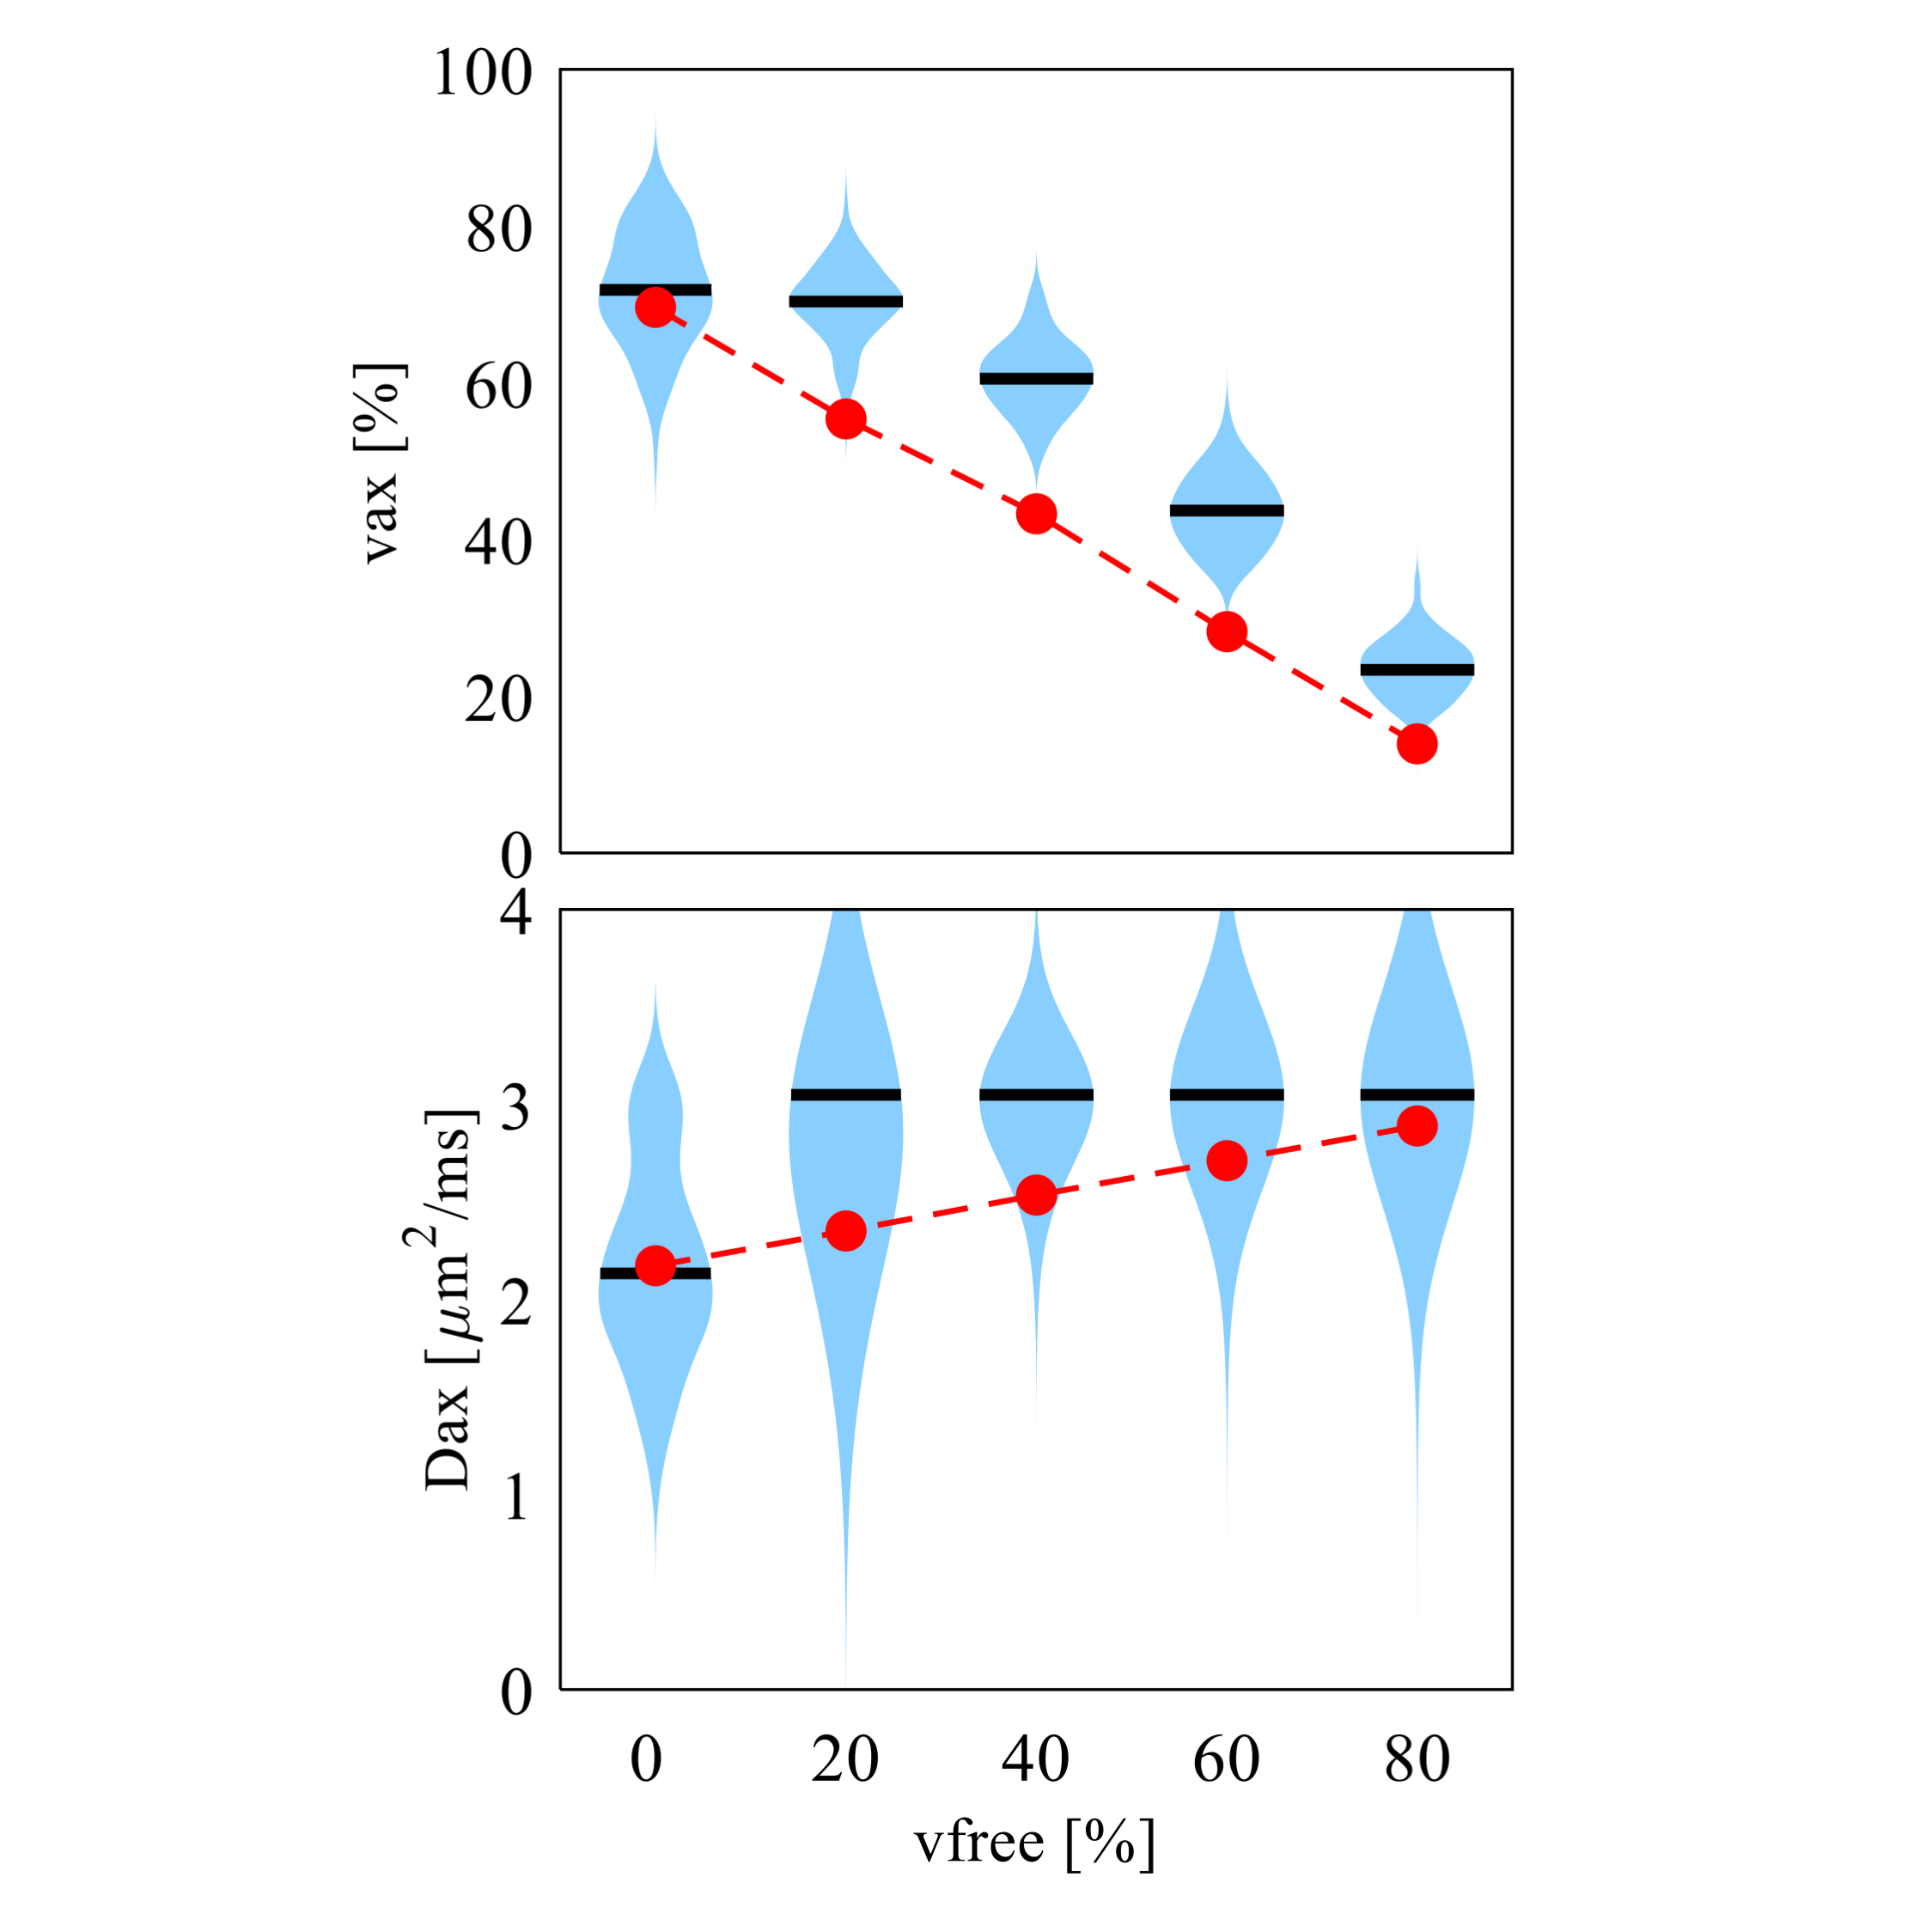
The influence of free water signal fractions is shown in Figure 4. Neither vax or Dax can be fit with high accuracy or precision. However, vax shows a clear dependence on free water fraction (r = 0.92, p<0.01), indicating that even if SMT is a two-compartment model, it still can provide valuable information on axonal content when three compartments are present.
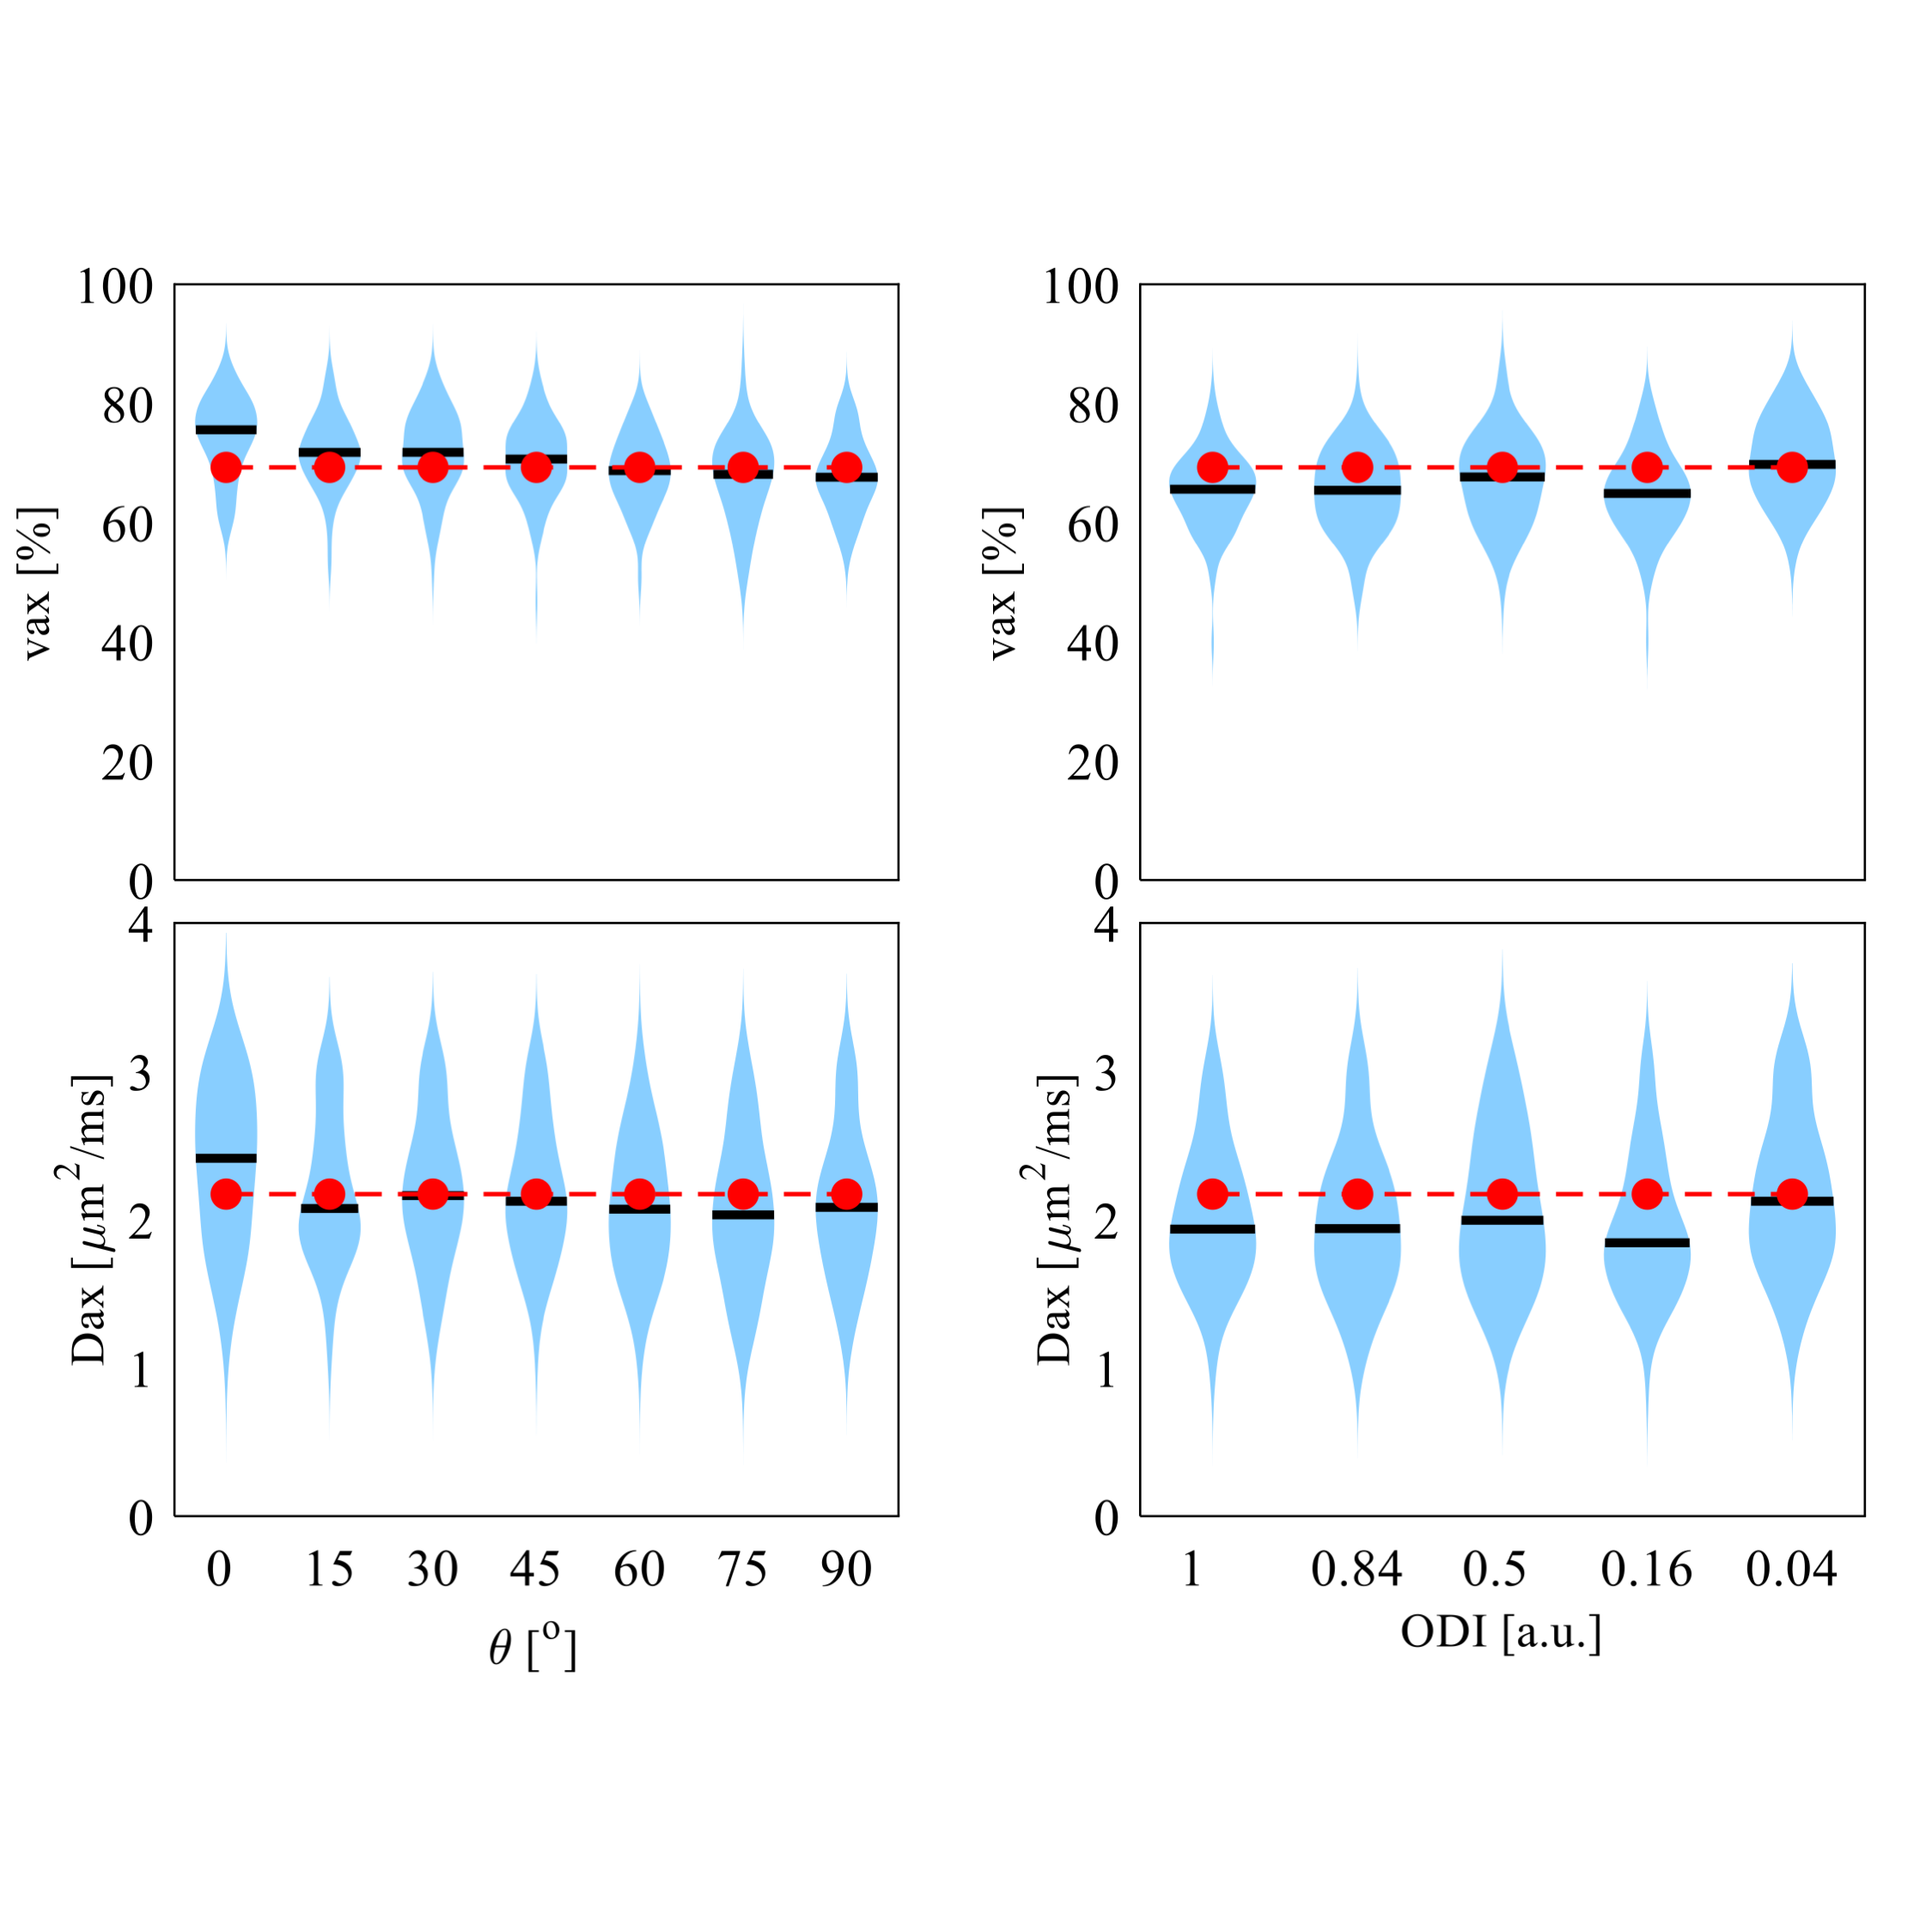
Figure 5 shows that SMT fittings were independent on the crossing angles of two fiber bundles and dispersion of a single fiber bundle. This confirms that SMT is insensitive to the fiber orientations, which is an advantage of SMT in brain imaging.
Conclusion
A biomarker such as axonal volume fraction to link in vivo imaging to axonal injury could improve diagnostics in multiple sclerosis. We report an optimized protocol for vax estimation using SMT for MS imaging. We then used computer simulations to comprehensively investigate the accuracy and precision of SMT fitting under different pathological conditions. These results could assist better implementation and interpretation of SMT imaging in MS patients.Acknowledgements
No acknowledgement found.References
1. E. Kaden, N. D. Kelm, R. P. Carson, M. D. Does, D. C. Alexander, Multi-compartment microscopic diffusion imaging. NeuroImage 139, 346-359 (2016).
2. S. By, J. Xu, B. A. Box, F. R. Bagnato, S. A. Smith, Multi-compartmental diffusion characterization of the human cervical spinal cord in vivo using the spherical mean technique. NMR Biomed 31, e3894 (2018).
3. F. Bagnato et al., Probing axons using multi-compartmental diffusion in multiple sclerosis. Annals of clinical and translational neurology 6, 1595-1605 (2019).
4. H. Zhang, T. Schneider, C. A. Wheeler-Kingshott, D. C. Alexander, NODDI: practical in vivo neurite orientation dispersion and density imaging of the human brain. Neuroimage 61, 1000-1016 (2012).
5. N. Kunz, A. R. da Silva, I. O. Jelescu, Intra- and extra-axonal axial diffusivities in the white matter: Which one is faster? NeuroImage 181, 314-322 (2018).
6. B. Dhital, M. Reisert, E. Kellner, V. G. Kiselev, Intra-axonal diffusivity in brain white matter. NeuroImage 189, 543-550 (2019).
7. J. Xu, M. D. Does, J. C. Gore, Numerical study of water diffusion in biological tissues using an improved finite difference method. Phys Med Biol 52, N111-126 (2007).
Figures