1391
Automated atlas-based mapping of white matter tract damage to multiple sclerosis symptoms1Advanced Clinical Imaging Technology, Siemens Healthcare, Lausanne, Switzerland, 2Department of Radiology, Lausanne University Hospital and University of Lausanne, Lausanne, Switzerland, 3Medical Imaging Processing, Ecole Polytechnique Fédérale de Lausanne (EPFL), Lausanne, Switzerland, 4Department of Neurology and Center of Clinical Neuroscience First Faculty of Medicine, Charles University and General University Hospital in Prague, Prague, Czech Republic, 5MR unit, Department of Radiology First Facutly of Medicine, Charles University and General University Hospital in Prague, Prague, Czech Republic, 6LTS5, Ecole Polytechnique Fédérale de Lausanne (EPFL), Lausanne, Switzerland
Synopsis
In multiple sclerosis, the standard radiological metrics correlate poorly with clinical disability (‘clinico-radiological paradox’). To help filling this gap, we propose to map neurological impairments to white matter tract damage resulting from lesions. Because diffusion imaging is typically not part of multiple sclerosis clinical workups, quantitative tract damage metrics were extracted using a tractography atlas and an automated lesion segmentation algorithm.
We were able to successfully identify which functional system (EDSS sub-score) was affected by damage on given tracts. These findings suggest the usefulness of using our fully automated atlas-based approach to study mechanisms of neurological diseases.
Introduction
The “clinico-radiological paradox” of multiple sclerosis (MS) arises from the lack of substantial correlation between classical radiological measures based on lesion load (e.g. lesion count) and clinical disability. The latter is typically evaluated using the Expanded Disability Status Scale (EDSS), a combined metric designed to reflect all possible symptoms that can affect MS patients. To this end, neurologists evaluate impairments in seven functional systems (visual, brainstem, pyramidal, cerebellar, sensory, bowel and bladder, and cerebral) as well as ambulatory ability. The functional systems are defined to be independent and reflect distinct neurological impairments that can result from MS lesions.To help filling the “clinico-radiological” gap, we suggest studying the relation between lesion location on white matter tracts and functional systems. Since diffusion imaging is typically not part of clinical MR protocols, we propose a fully automated atlas-based approach that uses an automated lesion segmentation prototype algorithm (LeMan-PV)1,2 and a tractography atlas to quantify white matter tract damage resulting from lesions.
Dataset
A prospective longitudinal observational study enrolled patients within four months after their first clinical event suggestive of multiple sclerosis3. MRI scans were acquired at 1.5T (Philips Gyroscan NT 15, Best, the Netherlands) and included fluid-attenuated inversion recovery (FLAIR) with 1.5 mm thickness (TR/TE/TI 11000/140/2600 ms) and 3D spoiled-gradient-recalled (SPGR) images with 1 mm slice thickness (TR/TE 25/5 ms). Clinical disability was estimated in terms of EDSS and the functional scores were reported. 170 patients with complete data at onset were retained.Methods
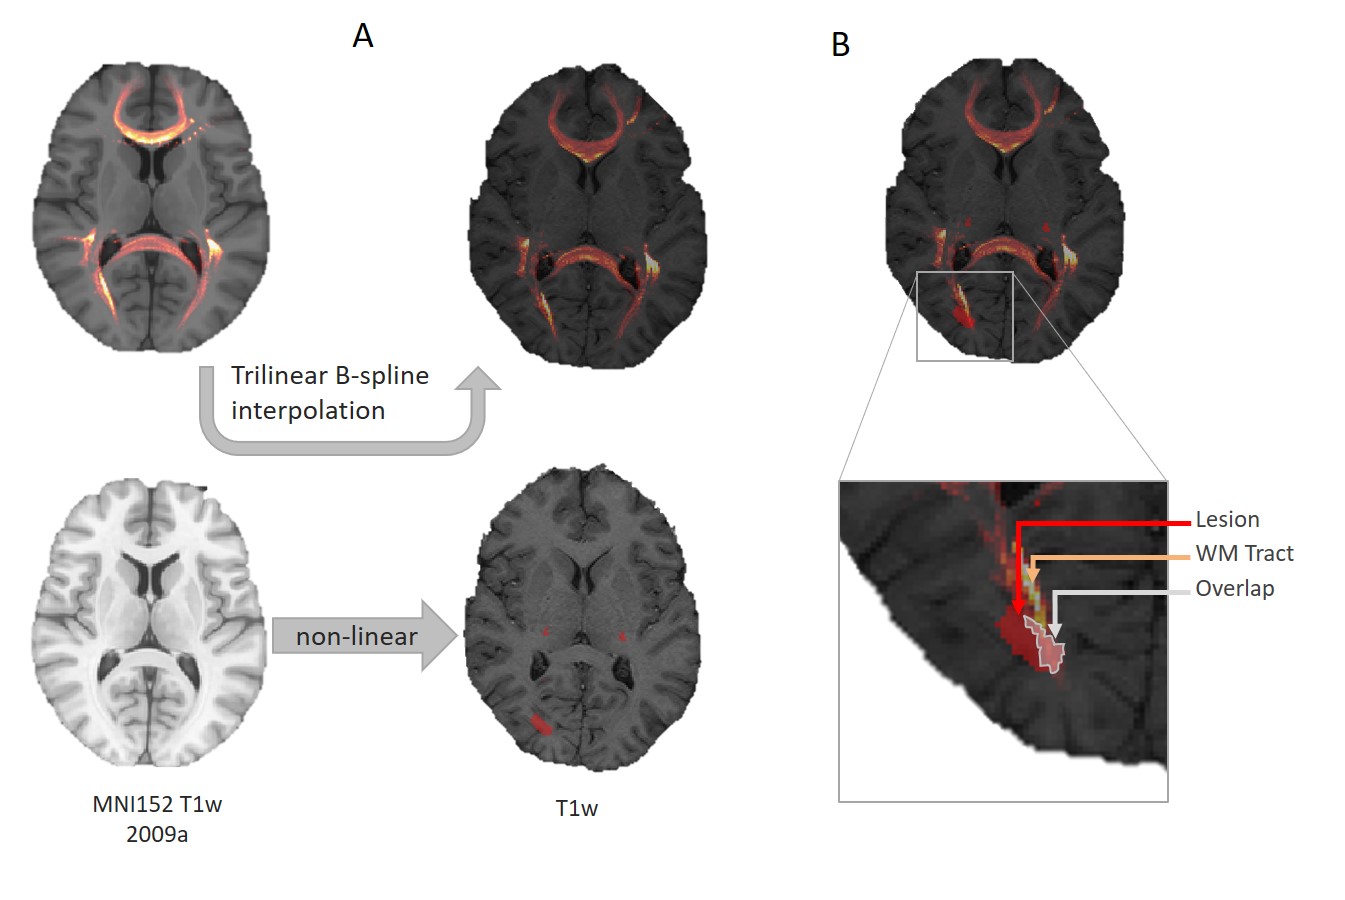
Estimation of Tract DamageSixty-six white matter tracts were isolated from a tractography atlas4, and the corresponding density maps were extracted. Lesions were segmented using FLAIR and SPGR with LeMan-PV, and the resulting lesion concentration maps binarized (threshold=0.3). The tract density image ($$$TDI$$$) of each tract and the lesion mask were then superimposed in the patient’s native space using spatial registration (see Figure 1). For each tract $$$t$$$, we estimated the percentage of damaged ($$$PD$$$) tract as:
$$PD_t=\frac{\sum_{o \in O}TDI_t(o)}{\sum_{m \in M}TDI_t(m)} $$
with $$$O$$$ the set of voxels in the overlap, $$$M$$$ the set of voxels in the tract density map and $$$TDI_t(i)$$$ the tract density at voxel $$$i$$$.
Lesion to Function Mapping
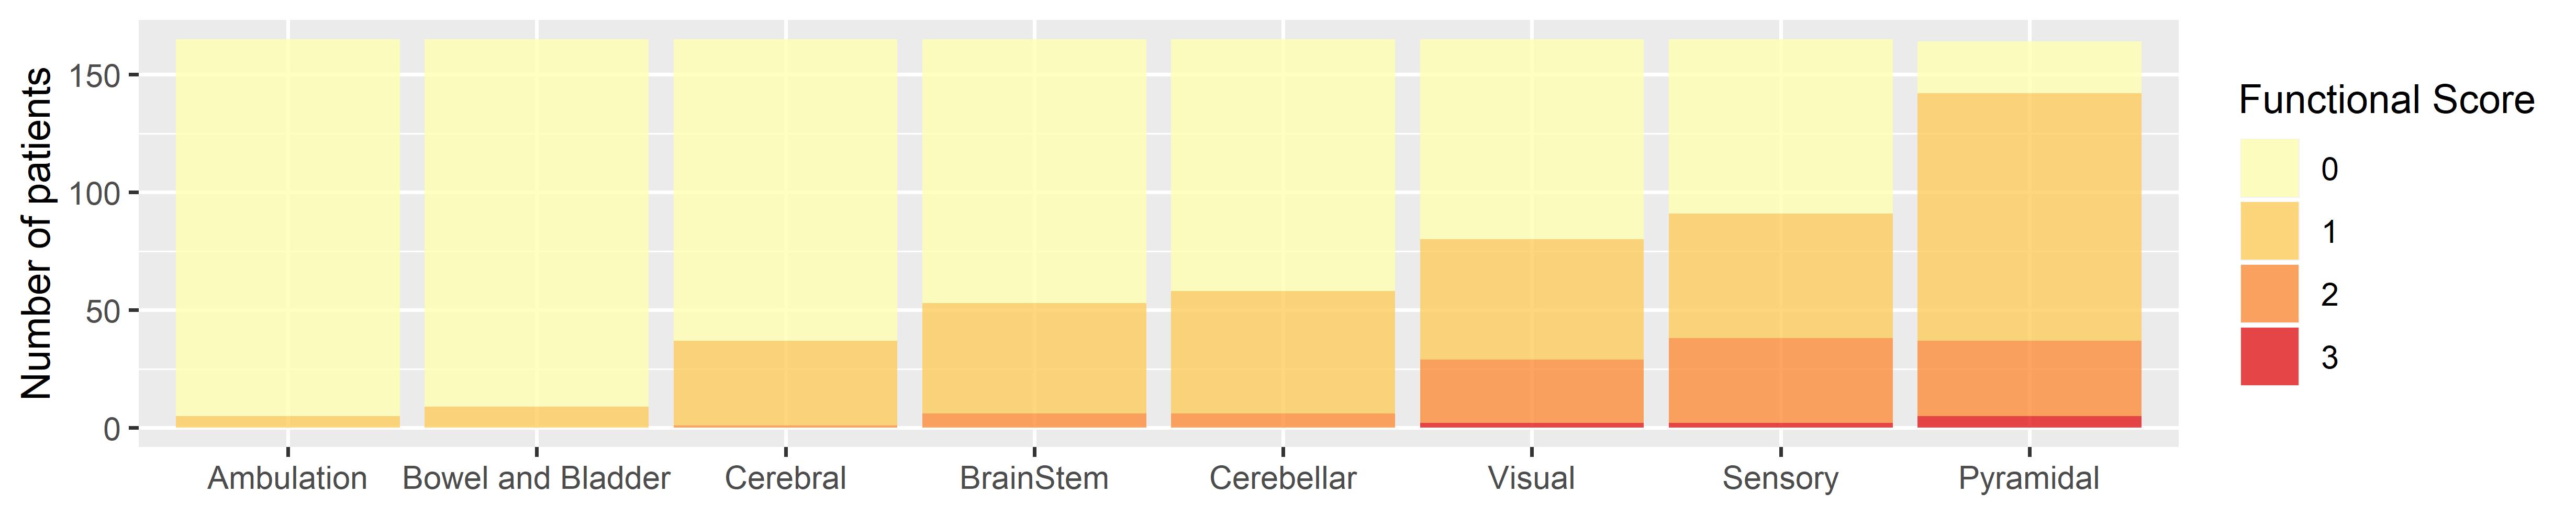
Cerebral, ambulatory and bowel and bladder systems were discarded due to insufficient number of patients with nonzero scores (see Figure 2).
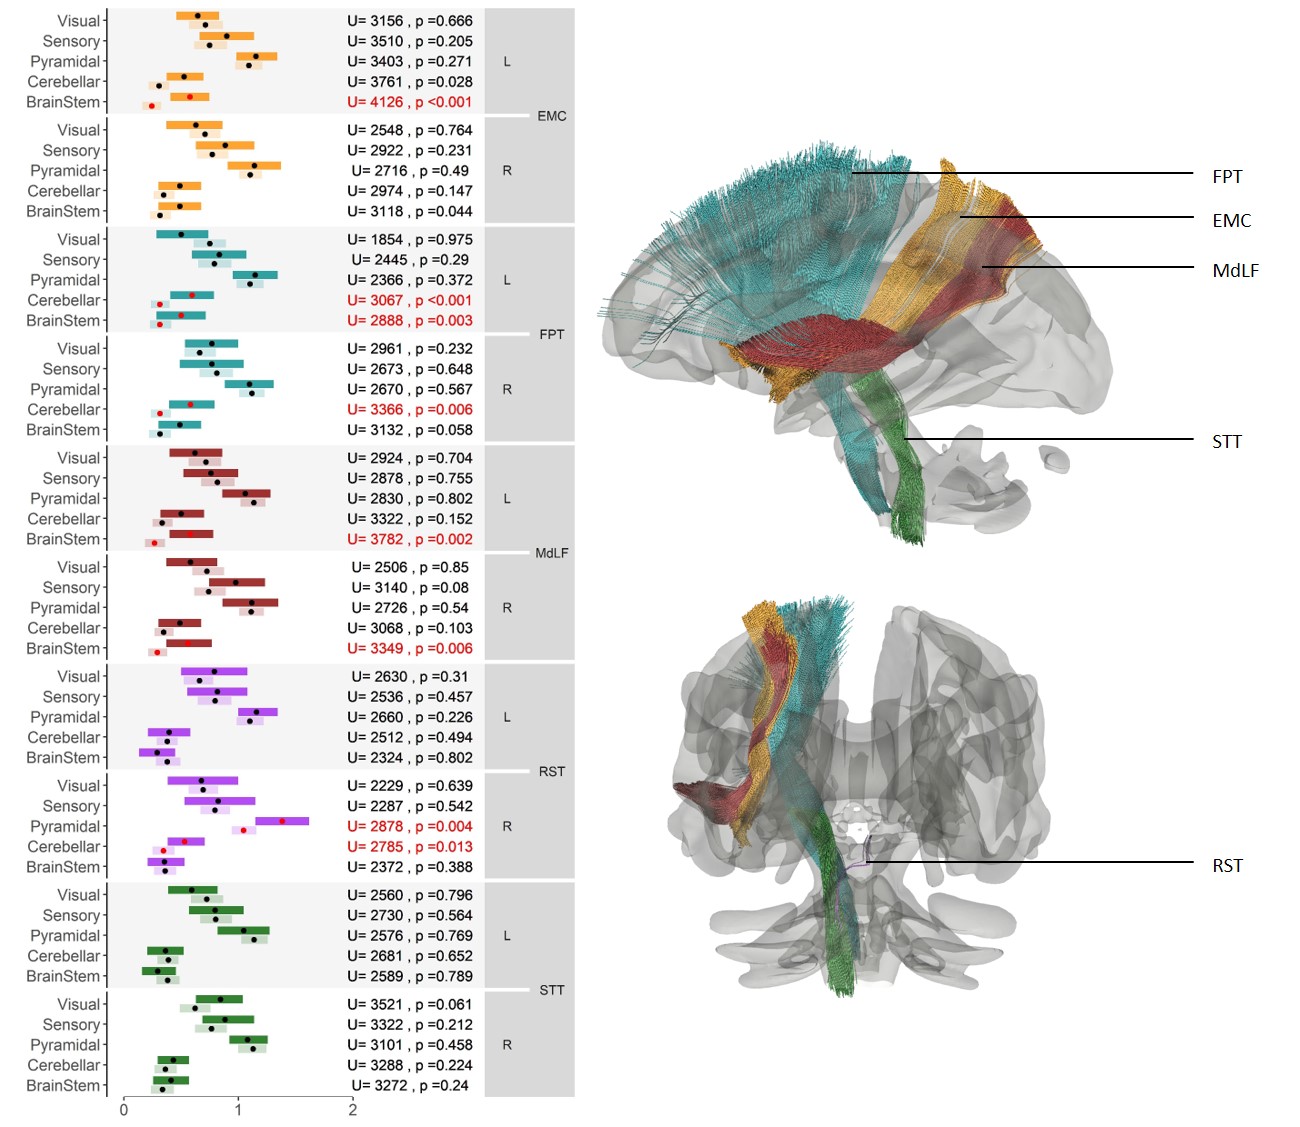
For this analysis, we selected an a priori subset of five tracts with well-established function and formulated hypotheses on which a functional score (FS) was expected to measure symptoms impacting that function using the Neurostatus scoring5. We chose the Extreme Capsule (EMC), known for its role in language6, and the Middle Longitudinal Fasciculus (MdLF), involved in the control of eye movement7; both functions were evaluated by the Brainstem FS. We also selected the Frontopontine Tract (FPT), a pyramidal tract involved in the coordination of planned motor functions8 expected to be reflected by either the Cerebellar or the Pyramidal FS. Finally, we chose two brainstem pathways, the Rubrospinal Tract (RST), involved in the motor control of upper limbs9 (Pyramidal FS), and the Spinothalamic Tract (STT) which conveys information on nociception and temperature10 (Sensory FS).
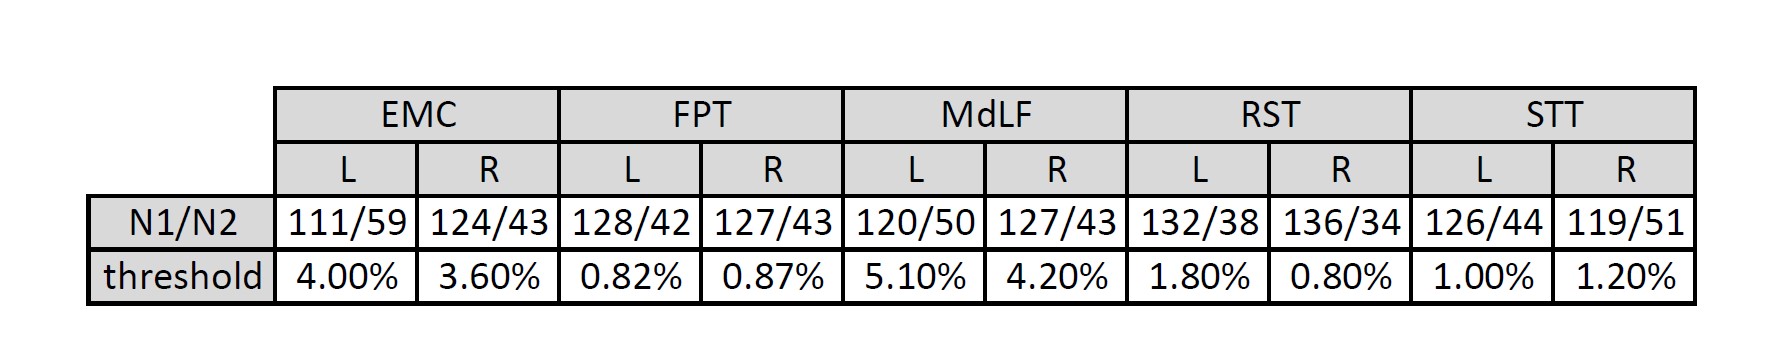
For each one of these tracts, we clustered the population into two groups: group 1) patients with lower PD and group 2) patients with higher PD, using the population average PD as threshold. Then, we compared the distributions of functional scores (FS) between the two groups using a Mann–Whitney U-test with the hypotheses:
$$H_0=FS(PD_1)=FS(PD_2)$$
$$H_A=FS(PD_1)<FS(PD_2)$$
For each tract, p-values were corrected for multiple comparisons across functional systems using the Benjamini-Hochberg false discovery rate (FDR).
Results
The number of patients in each group and the threshold value used to split the population are shown in Table 1 for each tract. The number of patients per group are comparable across all tracts. The threshold used for clustering is always comparable between left and right except for RST, suggesting that on average the right RST is less damaged.We reported the average FS for each group (group 1, lighter color) with bootstrap 95% confidence intervals in Figure 3 for each tract. The results of the U-test are also reported with uncorrected p-values. Tests that are significant after correction for multiple comparisons are reported in red.
Overall, the expected fiber-FS associations matched known tract functions, except for the right EMC, the left RST and especially both STT, for which our data supports no association with any FS. Unexpectedly, the left FPT was also associated with Brainstem FS and the right RST with Cerebellar FS.
Discussion/Conclusion
Importantly, since our method relies on spatial registration of patients’ brain to standard healthy templates, the analysis must be restricted to young subjects at early disease stages to avoid registration limitations that would be induced by brain atrophy and aging.Both the specificity of our results, whereby tracts show associations only with certain functional systems, and the sensitivity, whereby tracts mostly show associations with expected functional scores, suggest that the use of a tractography atlas is valuable when no diffusion data is available.
Our approach could provide useful insights for a better understanding of brain function not only in multiple sclerosis but in a number of neurological diseases.
Acknowledgements
No acknowledgement found.References
[1] Fartaria, Mário Joao, et al. "Automated detection of white matter and cortical lesions in early stages of multiple sclerosis." Journal of Magnetic Resonance Imaging 43.6 (2016): 1445-1454.
[2] Fartaria, Mário João, et al. "Segmentation of cortical and subcortical multiple sclerosis lesions based on constrained partial volume modeling." International Conference on Medical Image Computing and Computer-Assisted Intervention. Springer, Cham, (2017).
[3] Horakova, Dana, et al. "Environmental factors associated with disease progression after the first demyelinating event: results from the multi-center SET study." PloS one 8.1 (2013): e53996.
[4] Yeh, Fang-Cheng, et al. "Population-averaged atlas of the macroscale human structural connectome and its network topology." NeuroImage 178 (2018): 57-68.
[5] Şen, Sedat. "Neurostatus and EDSS Calculation with Cases." Archives of Neuropsychiatry 55.suppl 1 (2018): S80.
[6] Makris, Nikos, and Deepak N. Pandya. "The extreme capsule in humans and rethinking of the language circuitry." Brain Structure and Function 213.3 (2009): 343.
[7] Rea, Paul. “Chapter 9 - Spinal Tracts – Descending/Motor Pathways.” Essential clinical anatomy of the nervous system, Academic Press (2015): 161-176.
[8] Rea, Paul. “Chapter 10 – Brainstem Tracts.” Essential clinical anatomy of the nervous system, Academic Press (2015): 177-192.
[9] Lawrence, Donald G., and Henricus GJM Kuypers. "The functional organization of the motor system in the monkey: I. The effects of bilateral pyramidal lesions." Brain 91.1 (1968): 1-14.
[10] Rea, Paul. “Chapter 8 - Spinal Tracts – Ascending/Sensory Pathways.” Essential clinical anatomy of the nervous system, Academic Press (2015): 133-160.
[11] DSI Studio, version Apr 25 2019, Available: http://dsi-studio.labsolver.org
Figures