1389
White matter magnetic resonance diffusion measures in Multiple Sclerosis with overactive bladder1Department of Brain Repair & Rehabilitation, UCL Queen Square Institute of Neurology, London, United Kingdom, 2Department of Uro-Neurology, National Hospital for Neurology and Neurosurgery, London, United Kingdom, 3NMR Research Unit, UCL Queen Square MS Centre, London, United Kingdom, 4Department of Neurology, Xuan Wu Hospital of Capital Medical University, Beijing, China, 5Centre for Medical Image Computing, UCL Department of Medical Physics and Bioengineering, London, United Kingdom, 6School of Biomedical Engineering and Imaging Sciences, King’s College London, London, United Kingdom, 7Dementia Research Centre, UCL Queen Square Institute of Neurology, London, United Kingdom, 8Department of Electrical, Computer and Biomedical Engineering, University of Pavia, Pavia, Italy, 9Department of Perinatal Imaging & Health, School of Biomedical Engineering & Imaging Sciences, King’s College London, London, United Kingdom, 10King’s Health Partners, St Thomas’ Hospital, London, United Kingdom, 11Department of Computer Science and Centre for Medical Image Computing, University College London, London, United Kingdom, 12Universitat Oberta de Catalunya, Barcelona, Spain, 13Department of Brain and Behavioral Sciences, University of Pavia, Pavia, Italy, 14Brain MRI 3T Center, IRCCS Mondino Foundation, Pavia, Italy
Synopsis
White matter (WM) abnormalities subtending overactive bladder (OAB) symptoms in multiple sclerosis (MS) is poorly understood. MS patients with and without OAB symptoms were recruited to investigate the association between WM changes and OAB symptoms in MS. Lower FA were found in MS with OAB compared with MS without LUTS (p=0.072). An inverse correlation was found between FA and OAB severity (p=0.021) in MS. OAB symptoms are associated with WM anisotropy changes in MS as demonstrated by diffusion-weighted imging (DWI).
Introduction
Lower urinary tract symptoms (LUTS) are described in more than 80% of multiple sclerosis (MS), with overactive bladder (OAB) being the commonest. In recent years, magnetic resonance imaging (MRI), in particular functional MRI (fMRI) has provided considerable insight into the central neural control of lower urinary tract (LUT) functions.1 In patients with MS, activation and deactivation have been seen in cortical and subcortical grey matter (GM) regions following a bladder infusion task.2 These studies focus on the GM changes, however MS is overwhelmingly a white matter (WM) disease and the nature of the association between WM changes and LUTS is unknown. Structural MRI studies in patients with small vessel disease affecting WM suggest that the anterior thalamic radiation (ATR) and the superior longitudinal fasciculus (SLF) are specifically important for LUT functions and are involved in continence control.3 WM hyperintensity (WMH) in the anterior corona radiata (ACR) and the cingulate gyrus are reported to predict urinary incontinence and degree of bother.4 However, the relative contribution of brain WM changes to the clinical symptoms of OAB in MS is poorly understood. The aims of this study are to determine by means of MRI, in particular diffusion-weighted imaging (DWI): i) microstructural WM difference between health and MS, and MS with OAB symptoms and MS without LUTS; ii) whether there are associations between microstructural indices and clinical scores of OAB symptoms in MS.Methods
Methods: Twenty-nine right-handed female MS patients [Mean age (±SD) = 43.3(9.4), mean EDSS (±SD) = 2.3(1.8)] were scanned at 3.0 Tesla scanner (Philips Achieva, Best, The Netherlands) with a DWI protocol and clinical MRI. Image processing and Tract-Based Spatial Statistics (TBSS) were performed using the FMRIB Software Library (FSL, Oxford, UK, https://fsl.fmrib.ox.ac.uk/fsl). The diffusion-weighted images were corrected for eddy current-induced distortions and movements using FSL. DTI fitting and calculation of FA maps were performed using the NiftyFit toolbox.3 TBSS was performed to determine possible fractional anisotropy (FA) differences between the two groups. The standard TBSS pipeline was applied to the data: all FA images were non-linearly registered to the 1x1x1 mm3 FMRIB58_FA template in 1x1x1 mm3 MNI152 space (MNI, McConnell Brain Imaging Centre), then skeletonised and concatenated into a 4D file (skeletonized). The WM skeleton was created with a FA threshold of 0.2. Clinical scans were used for WM lesion segmentation. The Urinary Symptom Profile (USP) questionnaire assessed OAB severity. Descriptive statistics of age, EDSS, lesion volume, disease duration, and the OAB sub-score from the USP questionnaire (USP-OAB) were expressed as mean and standard deviation and all variables were checked for skewness and presence of outliers. SPSS version 24 was used for the statistical analysis and a p value < 0.05 was considered statistically significant, and p value < 0.1 was considered a favourable statistical trend. Differences of distribution and frequency of WM changes were plotted in a bullseye plot of WM regions.4 The lesion volume frequency plots represented the ratio between the median and the interquartile range (IQR, measuring statistical dispersion) of lesion volume in the given region and volume of that region.
Results
An inverse correlation was found between FA in areas of frontal and parietal lobes and OAB sub-scores from USP questionnaire (p=0.021) in MS. Areas of lower FA were found in both frontal lobes and the rest of the non-dominant hemisphere, including corpus callosum, anterior corona radiata bilaterally, right anterior thalamic radiation, superior longitudinal fasciculus bilaterally, right inferior longitudinal fasciculus, in MS with OAB compared with MS without LUTS (p=0.072).Discussion
We explored differences in WM changes in MS-OAB and MS-no-LUTS by evaluating changes in FA using diffusion MRI, and, to the best of our knowledge, this is the first study establishing the WM changes subtending OAB in MS. Current understanding of the central neural network controlling LUT functions is informed by positron-emission tomography (PET) and fMRI studies of the GM which suggests a network involving different regions including thalamus, insula, ACC, mPFC and lPFC. The involvement of WM tracts in determining the function/dysfunction of this network is currently only speculative,1 therefore this study aimed to evaluate the extent of WM tracts damage, specifically in MS. The scenario is very much complicated in MS given the mixture of disability in motor, sensory, autonomic and visual functions. The current study compensates our understanding of WM changes related to OAB in MS by identifying: i) FA reductions in the MS-OAB group, compared with MS-no-LUTS; ii) a negative correlation between FA and the USP-OAB sub-score, suggesting that a lower FA was associated with more severe OAB symptoms.Conclusion
By using DWI, the association between OAB symptoms and WM changes are identified and adds knowledge to the current LUT working model. As MS is predominantly a WM disease, these findings suggest that WM involvement, including cingulum, anterior corona radiata, anterior thalamic radiation, superior longitudinal fasciculus, and superior frontal-occipital fasciculus and a non-dominant prevalence in WM, can result in significant problems with OAB symptoms, possibly even with minimal direct GM involvement.Acknowledgements
No acknowledgement found.References
1. Griffiths D. Functional imaging of structures involved in neural control of the lower urinary tract. 1st ed. Elsevier B.V. Epub ahead of print 2015. DOI: 10.1016/B978-0-444-63247-0.00007-9.
2. Khavari R, Karmonik C, Shy M, et al. Functional Magnetic Resonance Imaging with Concurrent Urodynamic Testing Identifies Brain Structures Involved in Micturition Cycle in Patients with Multiple Sclerosis. J Urol 2017; 197: 438–444.
3. Tadic, Griffiths, Murrin, et al. Brain Activity During Bladder Filling Is Related To White Matter Structural Changes in Older Women with Urinary Incontinence. Neuroimage 2010; 51: 1294–1302.
4. Kuchel GA, Moscufo N, Guttmann CR, et al. Localization of Brain White Matter Hyperintensities and Urinary Incontinence in Community-Dwelling Older Adults. Journals Gerontol Ser A Biol Sci Med Sci 2009; 64A: 902–909.
5. Melbourne A, Toussaint N, Owen D, et al. NiftyFit: a Software Package for Multi-parametric Model-Fitting of 4D Magnetic Resonance Imaging Data. Neuroinformatics 2016; 14: 319–337.
6. Sudre CH, Gomez Anson B, Davagnanam I, et al. Bullseye’s representation of cerebral white matter hyperintensities. J Neuroradiol 2018; 45: 114–122.
Figures
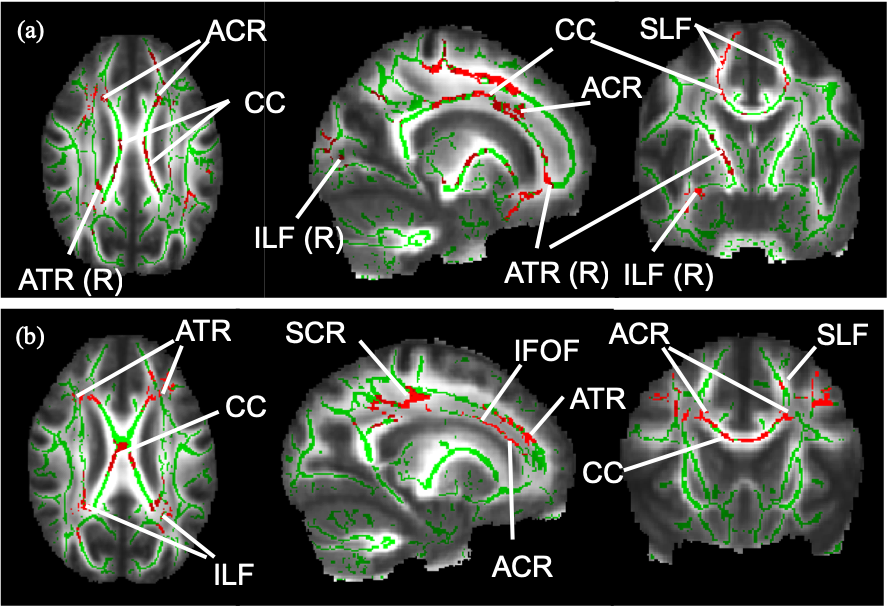
Figure 1. WM skeleton and significant results from TBSS.
(a) Voxels in red show a significant FA reduction in MS-OAB compared to MS-no-LUTS, adjusting for age and EDSS (p = 0.072). (b) Voxels in red show significant negative correlation between FA and USP-OAB sub-score (p = 0.021). ACR: anterior corona radiata; ATR: anterior thalamic radiation; CC: corpus callosum; IFOF: inferior fronto-occipital fasciculus; ILF: inferior longitudinal fasciculus; R: right-sided; SCR: superior corona radiata; SLF: superior longitudinal fasciculus.
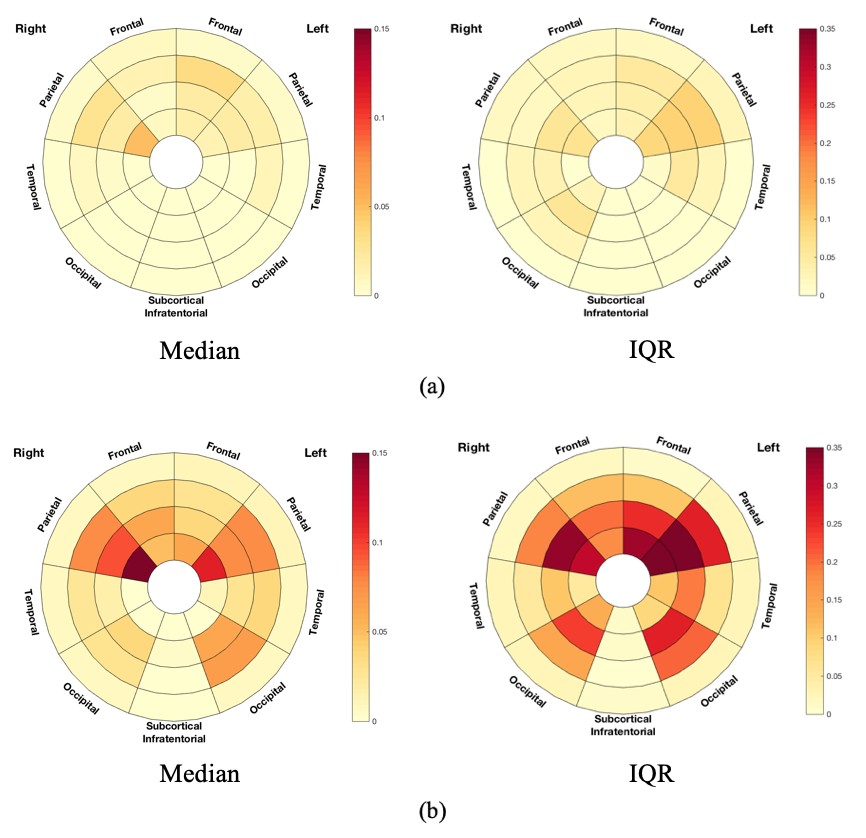
Figure 2. Frequency plots of lesion volume in terms of median and IQR in (a) MS-no-LUTS and (b) MS-OAB.
The frequency plots were drawn as the ratio between number of significant voxels in a given region and volume of this region. The colour bars from bottom to top indicate the lesion volume from less to more. IQR: interquartile range.
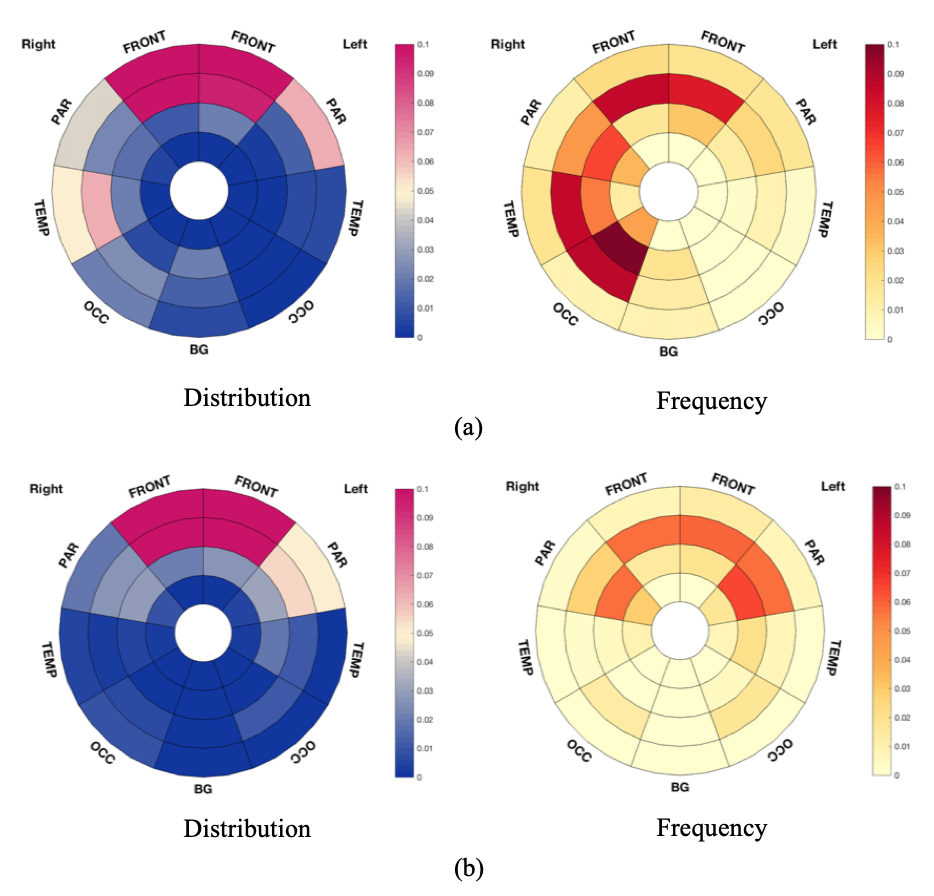
Figure 3. Bullseye plots showing significant results from TBSS.
(a) Bullseye plots showing reduced FA in MS-OAB, compared with MS-no-LUTS, adjusting for age and EDSS (p = 0.072). (b) Bullseye plots showing negative correlation between FA and USP-OAB sub-score across MS patients (n = 26, p = 0.021). Distribution plots reflect the ratio between number of voxels of interest (significant values) located in specific region and overall number of significant voxels, while frequency plots were drawn as the ratio between number of significant voxels in a given region and volume of this region.