1388
Clinical disability is associated with normal-appearing white matter MTsat in recently diagnosed relapsing-remitting multiple sclerosis.1Centre for Clinical Brain Sciences, University of Edinburgh, Edinburgh, United Kingdom
Synopsis
Magnetization transfer saturation (MTsat) is a quantitative measure of white matter (WM) integrity with inherent correction for B1 inhomogeneities and T1 relaxation. MTsat is sensitive to pathological changes in axonal myelin in multiple sclerosis (MS) and may predict clinical disability. MTsat within normal-appearing WM and WM hyperintensities was measured in 76 patients with recently diagnosed relapsing-remitting MS. After accounting for age, MTsat in normal-appearing WM, but not WM hyperintensities, predicted clinical disability (as assessed by Multiple Sclerosis Functional Composite z-scores) in MS when central tendency and standard deviation were considered. This suggests MTsat is sensitive to early MS pathology.
Introduction
Magnetization transfer saturation (MTsat) provides a non-invasive, quantitative MRI measure of myelin integrity in vivo, with inherent correction for B1 inhomogeneities and T1 relaxation1. Compared with healthy controls, MTsat within cerebral normal-appearing white matter (NAWM) has previously been shown to be reduced in relapsing-remitting multiple sclerosis (RRMS)2. MTsat in lesions has also been correlated with clinical disability in MS3. However, previous work has been limited by small sample sizes, heterogeneous MS cohorts and multi-platform acquisition protocols. The aim of this study was therefore to investigate the relationship between myelin integrity in both NAWM and white matter hyperintensities (WMHs), as assessed by MTsat, and clinical disability in a large, homogeneous cohort of patients recently diagnosed with RRMS.Methods
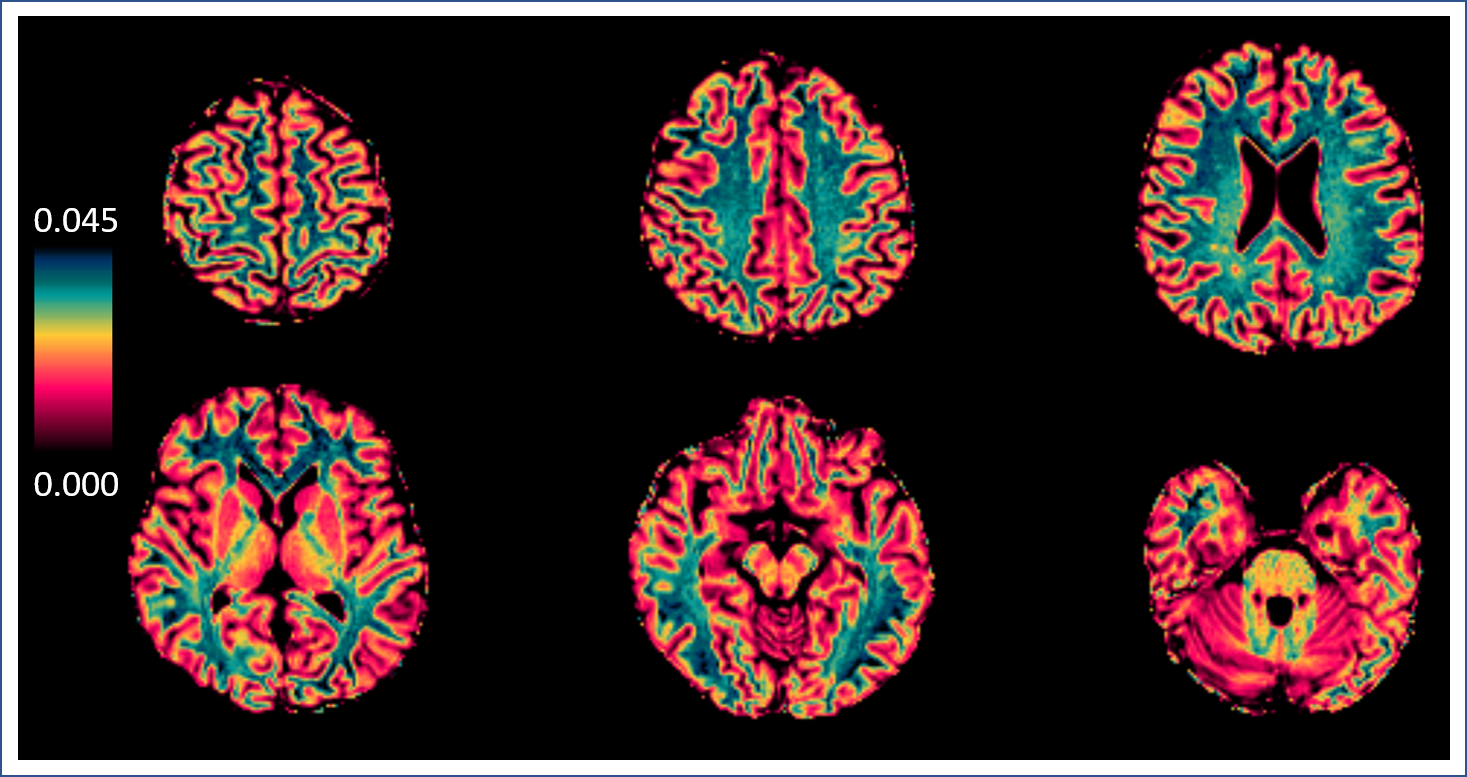
People with RRMS (n=76) were recruited to a sub-study of FutureMS, a large observational cohort study of people recently diagnosed with RRMS in Scotland, UK (https://future-ms.org/). Structural imaging (including 3D T1-weighted MPRAGE and T2 FLAIR) and magnetization transfer (MT) imaging (multi-echo 3D FLASH with and without an off-resonance MT saturation pulse, plus an additional T1-weighted image, 1.4mm isotropic resolution) was performed on a 3T Siemens Prisma MR system (Siemens Healthcare, Erlangen, Germany). Structural T1-weighted images were segmented with FreeSurfer (6.0) to obtain NAWM masks. T2 FLAIR WMHs were automatically segmented with a combination of FSL (5.0.1) and an in-house FLAIR thresholding method and manually corrected. MTsat parametric maps (see Figure 1) were calculated according to equations from Helms et al.1,4. Tissue masks were co-registered to MTsat space, thresholded at 0.5 and binarized (FSL 5.0.1). Median, mean and standard deviation were extracted from masked MTsat maps within NAWM and WMHs. To avoid collinearity of variables in statistical analyses, the derived NAWM and WMH coefficients of variation (CV) were calculated as CV=standard deviation/mean (MATLAB 2018). Multiple Sclerosis Functional Composite (MSFC) z-scores (standardized to the entire cohort, n=430) were taken as a measure of clinical disability. Two multiple linear regression analyses were performed with MSFC z-scores as the dependent variable. Model (1) independent variables were median NAWM MTsat, median WMH MTsat and age. Independent variables in model (2) were MTsat CV within NAWM, MTsat CV within WMHs MTsat and age (RStudio, α=0.05).Results
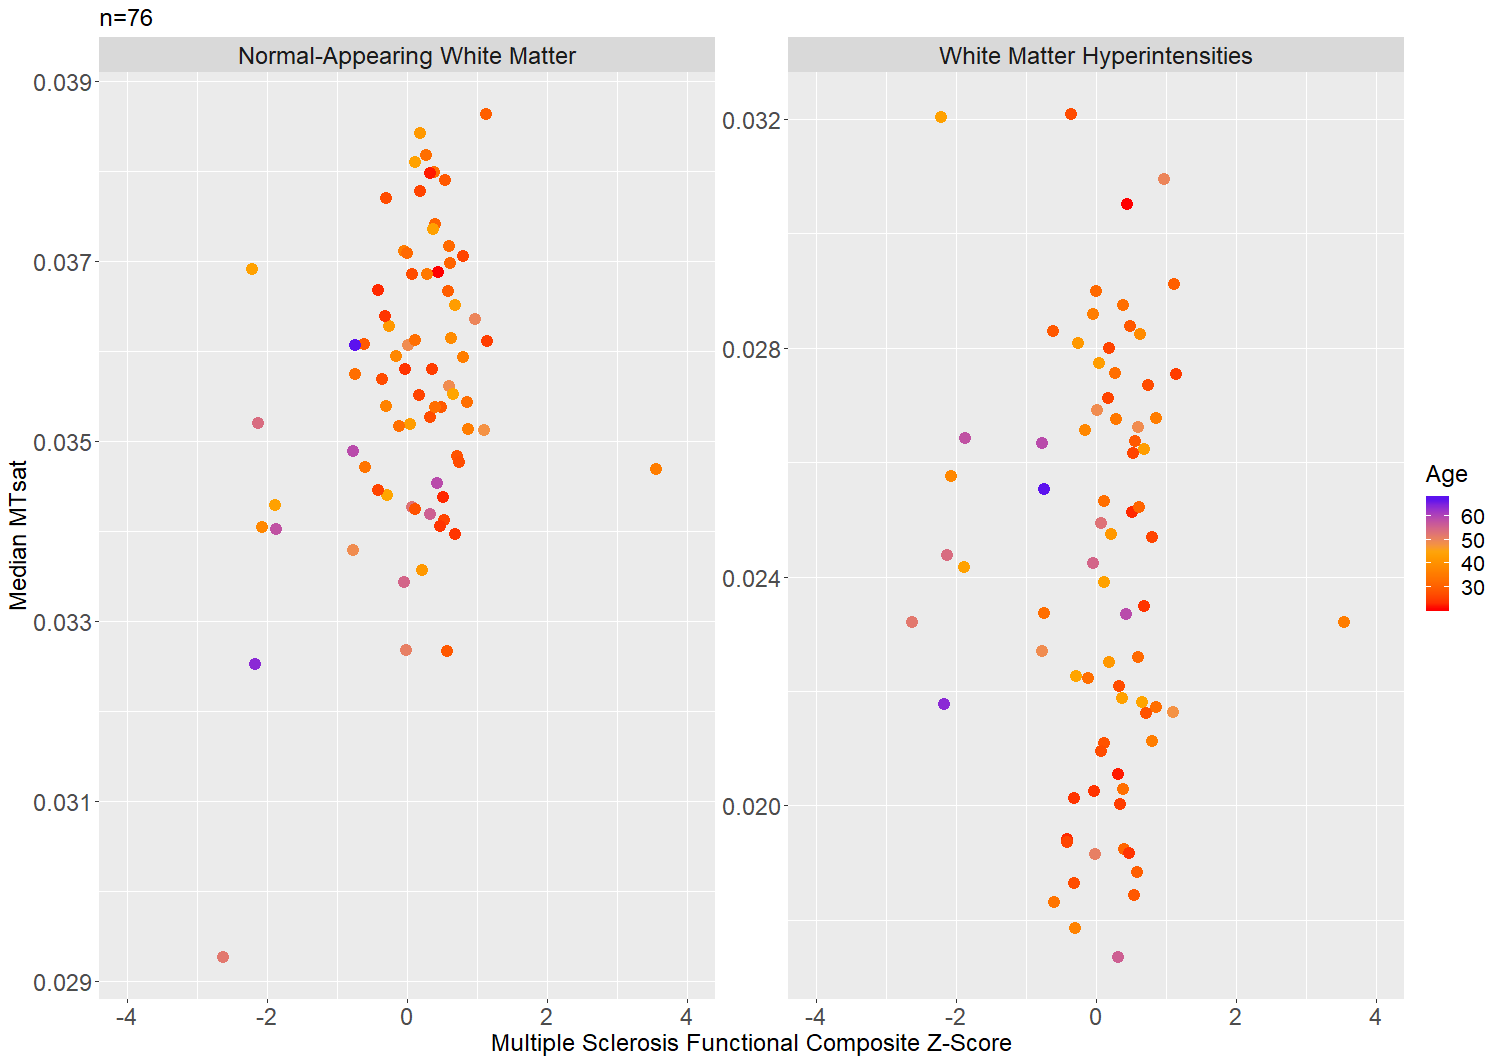
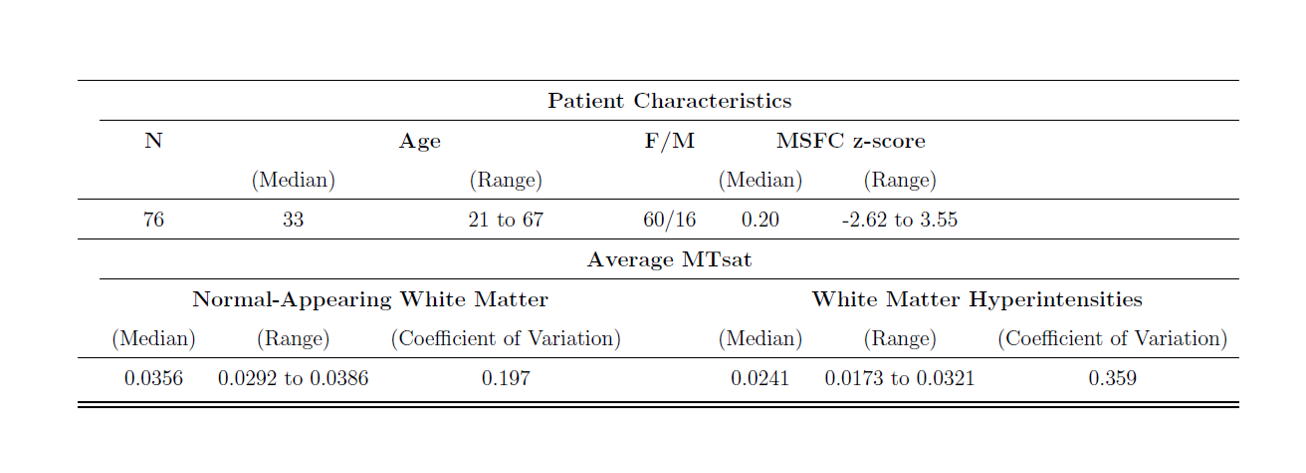
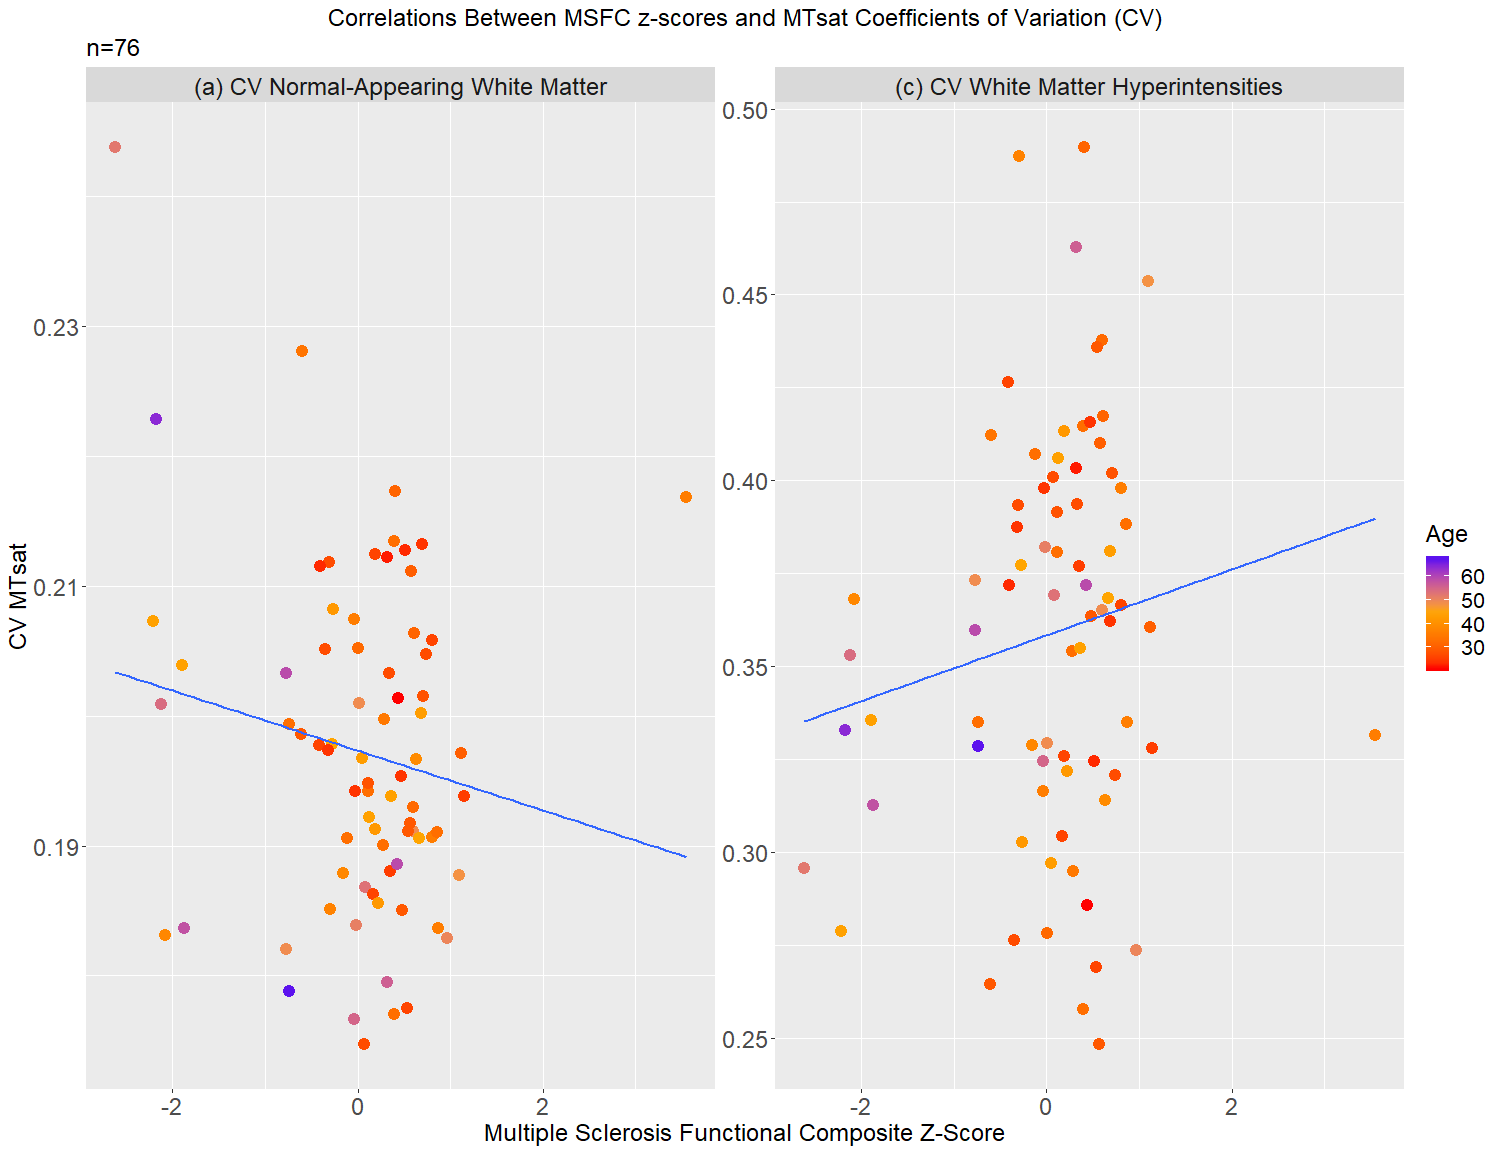
Patient characteristics and median MTsat values are reported in Table 1. Scatterplots for MSFC z-scores versus median MTsat in NAWM and WMHs are shown in Figure 2, and MSFC z-scores versus CV within NAWM and CV within WMHs are shown in Figure 3.Results indicated that regression model (1) significantly predicted MSFC z-score, F(3,72) = 5.44, p<0.005, adj. R2=0.15. However, although age contributed significantly to the model (β=-0.025, p<0.05), median NAWM MTsat and median WMH MTsat did not (β=124.36 and -8.95, p=0.06 and 0.74, respectively).
The results of regression (2) show that the model significantly predicted MSFC z-score, F(3,72) =6.588, p<0.001, adj. R2=0.18. MTsat CV within NAWM contributed significantly to the model (β=-17.238, p<0.05), as did age (β=-0.034, p<0.01). However, MTsat CV within WMHs was not a significant factor in the model (β=2.04, p=0.26).
Discussion
MTsat in NAWM, but not WMHs, was related to clinical disability in recently diagnosed RRMS when central tendency and variation of values were jointly considered. In line with previous research, our results indicate that MTsat may be sensitive to subtle pathological changes in myelin integrity in RRMS, which impact upon clinical disability. However, our results differ from previous studies in that median MTsat in NAWM only trended towards significance as a predictor of clinical disability, while MTsat in WMHs was not significant. This highlights the importance of both central tendency and spread of MTsat NAWM values when assessing the relationship with clinical disability, and suggests that white matter is heterogeneously affected in RRMS. Moreover, the divergence of our results from previous studies may be explained by our larger, better defined cohort. Our results may also reflect the limited variance in disability of patients recently diagnosed with RRMS - which appears to be largely driven by age. The association between age and MSFC z-scores may also be due to delayed diagnosis following disease symptom onset in older patients. Future analyses will explore longitudinal change in clinical disability in relation to white matter structural integrity, as well as the influence of disease symptom onset and age on MSFC z-scores and myelin integrity in RRMS.Conclusion
In conclusion, MTsat in NAWM, but not WMHs, was related to clinical disability in early RRMS, after accounting for age.Acknowledgements
Participants who took part in the present study
Radiographers at the Edinburgh Imaging Facility RIE
Anne Rowling Regenerative Neurology Clinic, Edinburgh
SPRINT-MS/MND CSO PhD Programme
CSO & SMS-IC Scotland
BIOGEN
References
1 Helms G, Dathe H, Kallenberg K, Dechent P. High‐resolution maps of magnetization transfer with inherent correction for RF inhomogeneity and T1 relaxation obtained from 3D FLASH MRI. Magnetic Resonance in Medicine: An Official Journal of the International Society for Magnetic Resonance in Medicine. 2008 Dec;60(6):1396-407.
2 Lommers E, Simon J, Reuter G, Delrue G, Dive D, Degueldre C, Balteau E, Phillips C, Maquet P. Multiparameter MRI quantification of microstructural tissue alterations in multiple sclerosis. NeuroImage: Clinical. 2019 May 29:101879.
3 Lema A, Bishop C, Malik O, Mattoscio M, Ali R, Nicholas R, Muraro PA, Matthews PM, Waldman AD, Newbould RD. A comparison of magnetization transfer methods to assess brain and cervical cord microstructure in multiple sclerosis. Journal of Neuroimaging. 2017 Mar;27(2):221-6.
4 https://github.com/mjt320/MT-Saturation
Figures