1387
Susceptibility Relaxation based Optimization for Visualization of the Central Vein Sign in Multiple Sclerosis Using Multi-Echo Gradient Echo
Jiahao Li1, Weiyuan Huang2, Xianfu Luo2, Thanh D. Nguyen2, Susan A. Gauthier2, Pascal Spincemaille2, and Yi Wang1,2
1Biomedical Engineering, Cornell University, Ithaca, NY, United States, 2Radiology, Weill Cornell Medicine, New York, NY, United States
1Biomedical Engineering, Cornell University, Ithaca, NY, United States, 2Radiology, Weill Cornell Medicine, New York, NY, United States
Synopsis
The central vein sign (CVS) has been suggested as a potential biomarker for multiple sclerosis (MS) lesion detection and differential diagnosis. A major hurdle for clinical investigation of CVS of MS lesion is the lack of high-quality visualization on current MRI. In this work, we propose a Susceptibility Relaxation based Optimization (SRO) method that uses routinely acquired multi-echo gradient echo magnitude and phase data to generate an image with optimal CVS contrast while preserving lesion signal. Preliminary qualitative and quantitative results demonstrate that SRO provides superior MS lesion and CVS detection compared to prior methods.
Introduction
Lesion detection in multiple sclerosis (MS) diagnosis is guided by the 2017 McDonald criteria1, which calls for research into lesion differentiation using imaging to distinguish MS lesions from other neurological disorders. The central vein sign (CVS) signal has been proposed as a potential biomarker in MS differential diagnosis using T2* weighted imaging2,3. Located within MS lesions, the central vein is believed to play a pathological role in the autoimmune disease onset and development. Current methods to visualize these central veins include high-pass filtered phase imaging, susceptibility weighted imaging (SWI), and FLAIR*4. Here, we propose a novel post-processing method, Susceptibility Relaxation based Optimization (SRO), for combining both magnitude and phase information in multi-echo gradient echo to produce an image with high central-vein-to-lesion contrast and high lesion-to-normal-appearing-white-matter contrast, in order to enhance CVS visualization while keeping the hyperintense lesion morphology.Methods
Data acquisition:Using a HIPAA compliant and IRB approved protocol, data were collected from 20 patients diagnosed with MS. MRI was performed on a 3T Siemens scanner using 3D multi-echo GRE (mGRE) sequence (voxel size $$$0.75\times0.75\times3mm^3$$$, 10 echoes, $$$\Delta$$$TE=4.1ms, matrix size $$$260\times320\times50\sim60$$$) and a 3D T2-FLAIR sequence (voxel size $$$0.94\times0.94\times1mm^3$$$, matrix size $$$256\times256\times160$$$).
Image processing:
Experienced radiologists segmented all MS lesions on the FLAIR images, which were then co-registered to the mGRE magnitude images. SRO for mGRE processing pipeline is shown in Figure 1. R2* is obtained from the complex gradient echo signal using the Levenberg-Marquardt algorithm, followed by background field correction5 using the background field as estimated by PDF6,7 to reduce air-tissue interface artifacts. Ignoring partial volume effect, the magnitude signal for each voxel is assumed to follow a mono-exponential decay with rate of R2*. Then for optimal R2* (susceptibility plus relaxation) contrast, we could choose an optimal echo time TE*:
$$TE^{*} = \underset{TE}{\operatorname{argmax}}|\frac{\partial S(TE_{i})}{\partial R2^{*}}| = \underset{TE}{\operatorname{argmax}}|\frac{\partial }{\partial R2^{*}}m_{0}\exp(-R2^{*}TE_{i})|=\frac{1}{R2^{*}}$$
Therefore, TE is chosen to be around the T2* value of central vein to yield a signal $$$S(TE^{*})$$$ with the best CVS contrast. To overcome the fitting noise and signal loss in the lesion area, the resulting image is multiplied with additional weighting factors derived from both the T2* and phase map:
$$S^{*} = wS(\text{TE}^{*})=w_{\text{SWI}}w_{\text{R2}^{*}}m_{0}\exp(-\widehat{R2^{*}}T2_v^*)$$
The initial R2* map is reversed and set by threshold to highlight lesion area as the first weighting term. $$$w_{R2^{*}}=1/R2^*$$$ where $$$R2^*\geq R2_\text{thres}^*$$$; otherwise, $$$w_{R2^{*}}=1/R2_\text{thres}^*$$$. $$$w_\text{SWI}$$$ = SWI signal intensity in order to highlight brain vessel structure, and the phase data are processed with high pass filtering to generate standard SWI images and SWI.
Analysis:
An ROI-based statistical analysis was performed on manually labelled central veins on all MS patient data, from which an approximate central vein R2* distribution is computed. The result of SRO is compared with both high-pass filtered phase images and SWI for the visualization of CVS. Ten cases were randomly selected in which the number of CVS in the MS lesions were counted by two experienced radiologists. An estimation of the central vein to lesion contrast is obtained as $$$C_{v/l} = |\overline{S}_v-\overline{S}_l|/|\overline{S}_v+\overline{S}_l|$$$, where $$$\overline{S}_v$$$ is the average signal intensity at central vein area, $$$\overline{S}_l$$$ is the average signal intensity at lesion area for each MS lesion. Since phase images remove anatomic information based on spatial frequency, we only compared with SWI for ROI-based relative contrast measurement.
Results
The ROI-based R2* distribution is shown in Figure 2. The mean value of central vein R2* was 15.9Hz, thus TE* chosen to be 63ms. For MS lesion CVS visualization, SRO images were superior to SWI images (p<0.05, Wilcoxon signed-rank test). For the 10 cases with total of 141 MS lesions, 51.8% of lesions were identified with CVS on SRO images, while 25.5% on SWI and 37.6% on high passed phase images. Figures 3&4 show two representative cases of SRO, SWI, high-pass filtered phase and T2-FLAIR images for comparison of both lesion depiction and CVS conspicuity. Figure 5 shows quantitative comparison of the central vein to lesion contrast on SRO and SWI. SRO provided an average contrast (0.10) 5 times larger than that of SWI (0.02), and the central vein to lesion contrast on SRO was consistently higher than that on SWI ($$$p<10^{-80}$$$, paired t-test).Discussion and Conclusion
Our data demonstrate that susceptibility relaxation based optimization (SRO) provides superior visualization of MS lesion and central vein sign, compared to SWI magnitude and SWI phase (high pass filtered phase). Among the three methods, the central vein is presented as a hypointense linear feature inside the lesion. Our developed SRO method integrates T2* map that is sensitive to lesion, and R2* contrast that is sensitive to central vein sign. Accordingly, SRO images are capable of showing lesions as hyperintense, whereas both SWI and phase images have limited lesion morphological depiction, in addition to showing central vein sign. Using weights from both magnitude and phase data from multi-echo GRE, SRO is a promising method for visualizing the central vein within an MS lesion.Acknowledgements
The authors would like to thank Yan Wen and Junghun Cho and other members from Dr Wang’s lab for insightful discussion. This research is supported by NIH R01 NS090464, S10 OO021782, R01 NS105744, R01 NS104283 and NMSS RR-1602-07671.References
- Thompson AJ, Banwell BL, Barkhof F, et al. Diagnosis of multiple sclerosis: 2017 revisions of the McDonald criteria. The Lancet Neurology 2018;17(2):162-173.
- Sati P, Oh J, Constable RT, et al. The central vein sign and its clinical evaluation for the diagnosis of multiple sclerosis: a consensus statement from the North American Imaging in Multiple Sclerosis Cooperative. Nat Rev Neurol 2016;12(12):714-722.
- Sinnecker T, Clarke MA, Meier D, et al. Evaluation of the Central Vein Sign as a Diagnostic Imaging Biomarker in Multiple Sclerosis. JAMA Neurol 2019.
- Sati P, George IC, Shea CD, et al. FLAIR*: a combined MR contrast technique for visualizing white matter lesions and parenchymal veins. Radiology 2012;265(3):926-932.
- Yablonskiy DA, Sukstanskii AL, Luo J, et al. Voxel spread function method for correction of magnetic field inhomogeneity effects in quantitative gradient-echo-based MRI. Magn Reson Med 2013;70(5):1283-1292.
- de Rochefort L, Liu T, Kressler B, et al. Quantitative susceptibility map reconstruction from MR phase data using bayesian regularization: validation and application to brain imaging. Magn Reson Med 2010;63(1):194-206.
- Liu T, Khalidov I, de Rochefort L, et al. A novel background field removal method for MRI using projection onto dipole fields (PDF). NMR Biomed 2011;24(9):1129-1136.
Figures
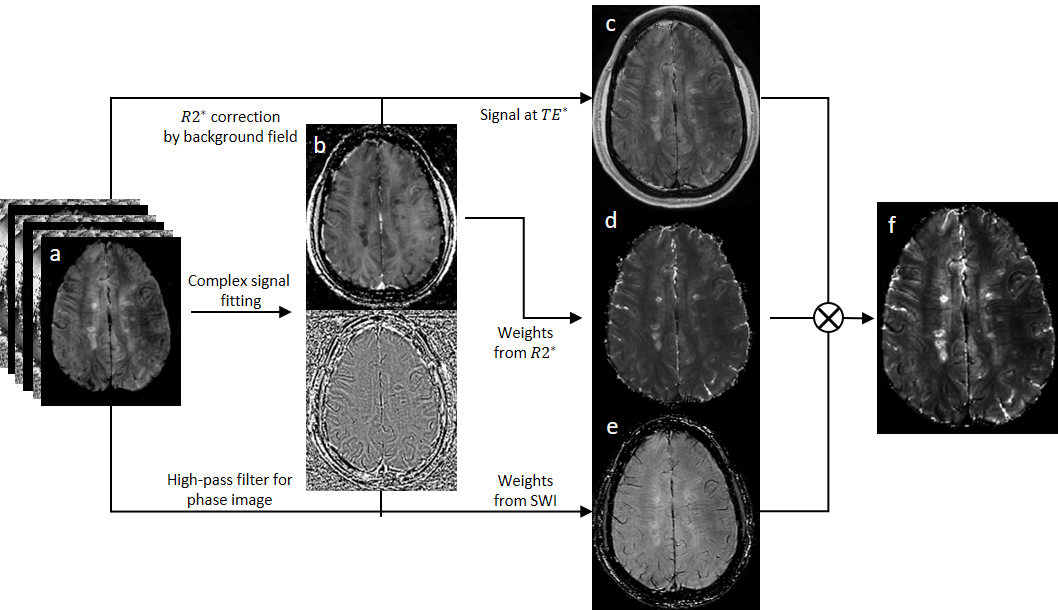
Figure 1. Pipeline for SRO to generate an enhanced CVS image. a) complex
signal from multi-echo GRE; b) signal fitting to get R2* map followed by background
field correction and phase followed by high-pass filtering; c) magnitude signal
at optimal echo time; d) weights from R2* map; e) SWI; f) SRO generated enhanced
CVS image.
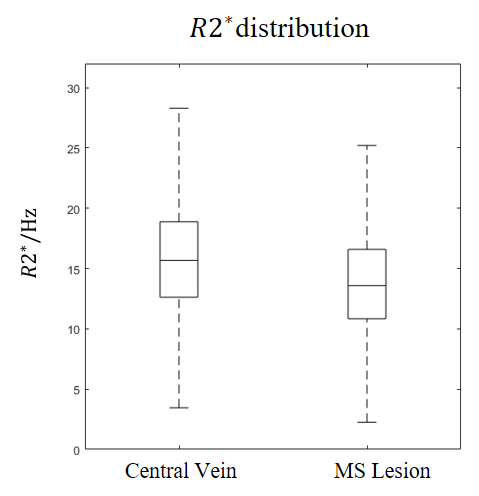
Figure 2. R2* of the central vein and MS lesion in all lesions detected in 20 MS
patients. For central vein R2*, median value is 15.7Hz, mean value is 15.9Hz; for
MS lesion excluding central vein area, median value is 13.6Hz, mean value is
13.9Hz. Based on the analysis, we choose the inverse mean central vein R2* as the
optimal TE, which was around 63ms.
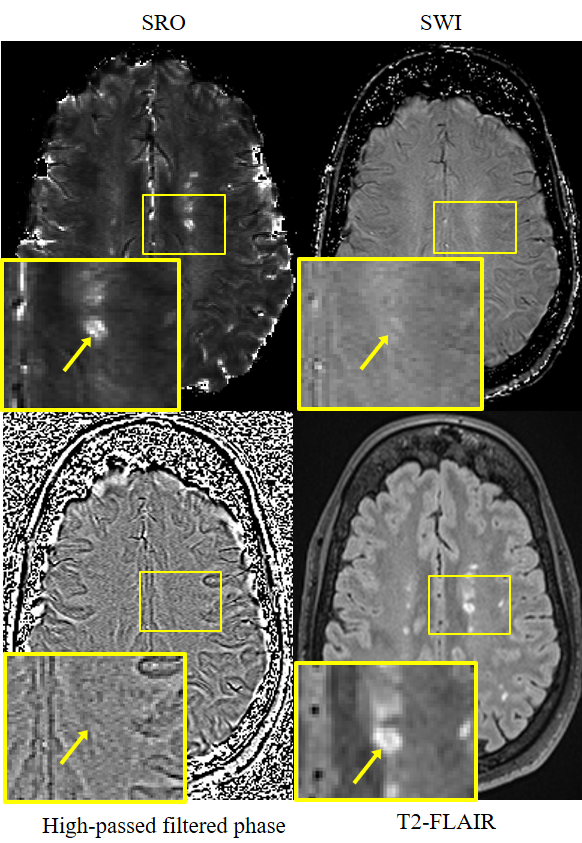
Figure 3. An MS lesion demonstrated in (left to right, top to
bottom) SRO, SWI, high-pass filtered phase image and T2-FLAIR. The lower left
corner in each image shows a magnified view of an MS lesion (arrow). The
central vein is clearly demonstrated in SRO, which also shows the rest of the
MS lesion as hyperintense. In contrast, lesion morphology is not depicted on
either SWI or high pass filtered phase. T2-FLAIR is used as gold standard for
MS lesion recognition.
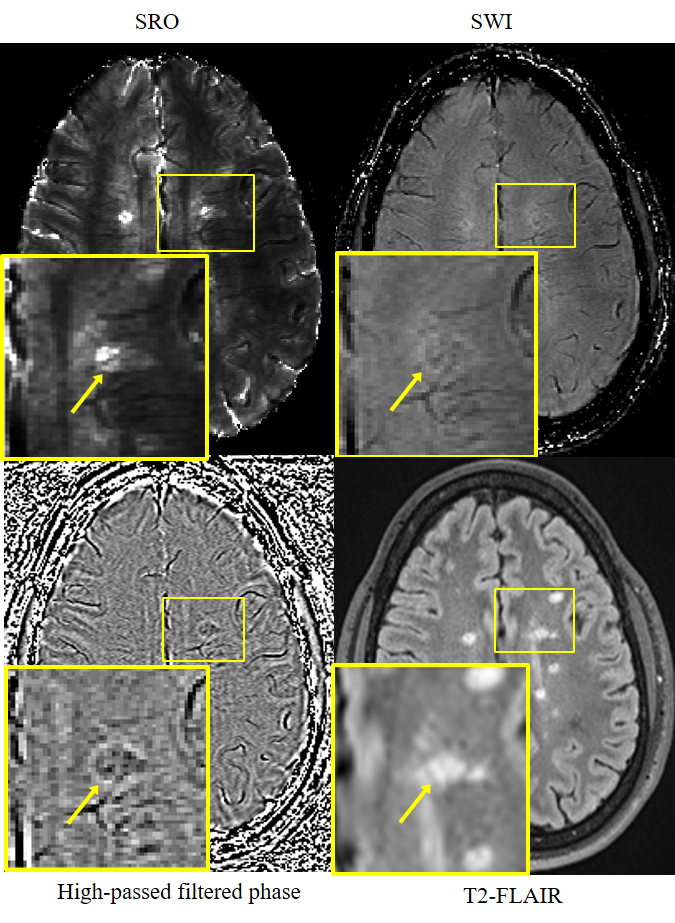
Figure 4. A central vein (lesion indicated by arrow) demonstrated
(from left to right, top to bottom) in SRO, SWI and high-pass filtered phase image. The lower
left corner of each image shows a magnified view. The central vein is presented
on SRO with conspicuity as a hypointense line running through hyperintense MS
lesion. However, on either SWI or high passed phase, the clear appearance of
central vein is not available in this case. T2-FLAIR is used as gold standard for MS lesion recognition.
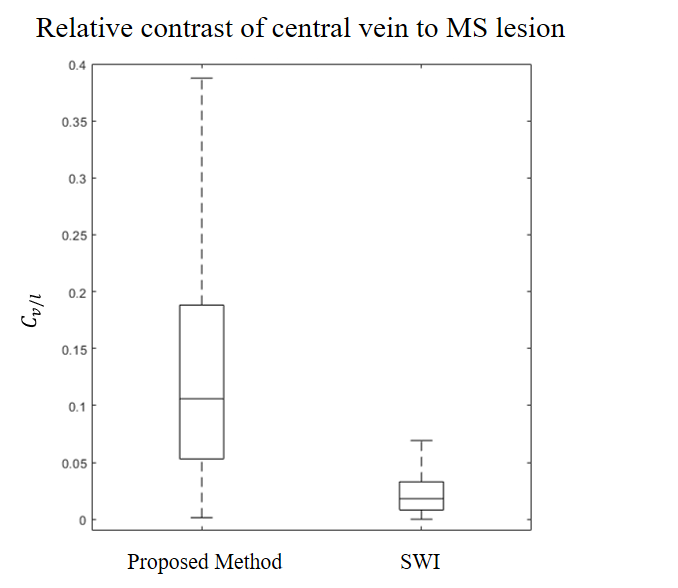
Figure 5. Central vein to lesion contrast for SRO versus SWI for all lesions in 20
MS patients. The median value was 0.1 and 0.02, for SRO and SWI, respectively,
resulting in a fivefold increase in contrast.