1386
Quantitative susceptibility of thalamus, basal ganglia and normal appearing white matter in multiple sclerosis1Department of Diagnostic and Interventional Radiology, Lausanne University Hospital and University of Lausanne, Lausanne, Switzerland, 2Department of Diagnostic and Interventional Radiology, Lausanne University Hospital and University of Lausanne; Siemens Healthcare AG; École Polytechnique Fédérale de Lausanne (EPFL), Lausanne, Switzerland, 3Advanced Clinical Imaging Technology, Siemens Healthcare AG, Lausanne, Switzerland, 4Signal Processing Laboratory (LTS 5), École Polytechnique Fédérale de Lausanne (EPFL), Lausanne, Switzerland, 5I2FH, Institut d'Imagerie Fonctionnelle Humaine, Montpellier University Hospital Center, Gui de Chauliac Hospital, Montpellier, France, 6Department of Diagnostic and Interventional Radiology, Lausanne University Hospital and University of Lausanne; École Polytechnique Fédérale de Lausanne (EPFL), Lausanne, Switzerland
Synopsis
Quantitative susceptibility mapping is an emerging MRI technique that may provide additional information on brain tissue with potential applications in multiple sclerosis characterization and monitoring. However, the link between tissue susceptibility and disease evolution is not well known. This study investigates the relationship between basal ganglia, thalamus and normal appearing white matter susceptibility and lesion load, based on a fully automated pipeline for lesion and brain segmentation. Significant correlations were found between lesion load and susceptibility in putamen, thalamus, and white matter, presumably due to myelin loss in basal ganglia and iron loss in normal appearing white matter and thalamus.
Introduction
Quantitative susceptibility mapping (QSM) is an emerging technique that can potentially facilitate the characterization of inflammation and demyelination in the brain of multiple sclerosis (MS) patients [1]. In MS, myelin and iron content changes are thought to be the main factors of susceptibility change in the different brain regions and lesions [2, 3]. Thus, QSM is increasingly used for the characterization of iron load in the deep gray matter (DGM) and lesions [4]. Magnetic susceptibility in specific brain regions and lesions might hence be a potential biomarker to monitor disease progression. However, the relation between susceptibility in the brain and the disease state is still not widely investigated. Prior work indicates higher susceptibility for basal ganglia (probably due to demyelination) and lower susceptibility for thalamus and normal appearing white matter (NAWM, probably due to iron loss) with disease progression [5-7]. Moreover, thalamic damage seems to be related to NAWM damage [8]. However, because of technical differences, studies are not fully comparable and conclusive. The goal of this study was to evaluate i) the association between DGM and NAWM susceptibilities, and ii) their relation to disease status based on lesion load.Methods
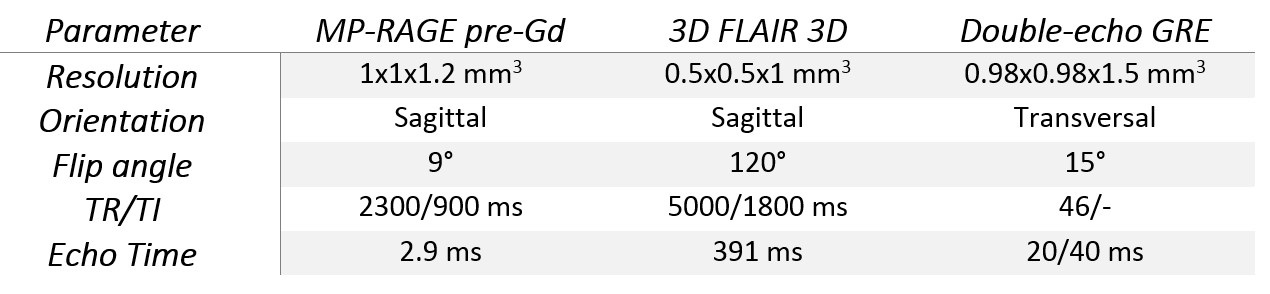
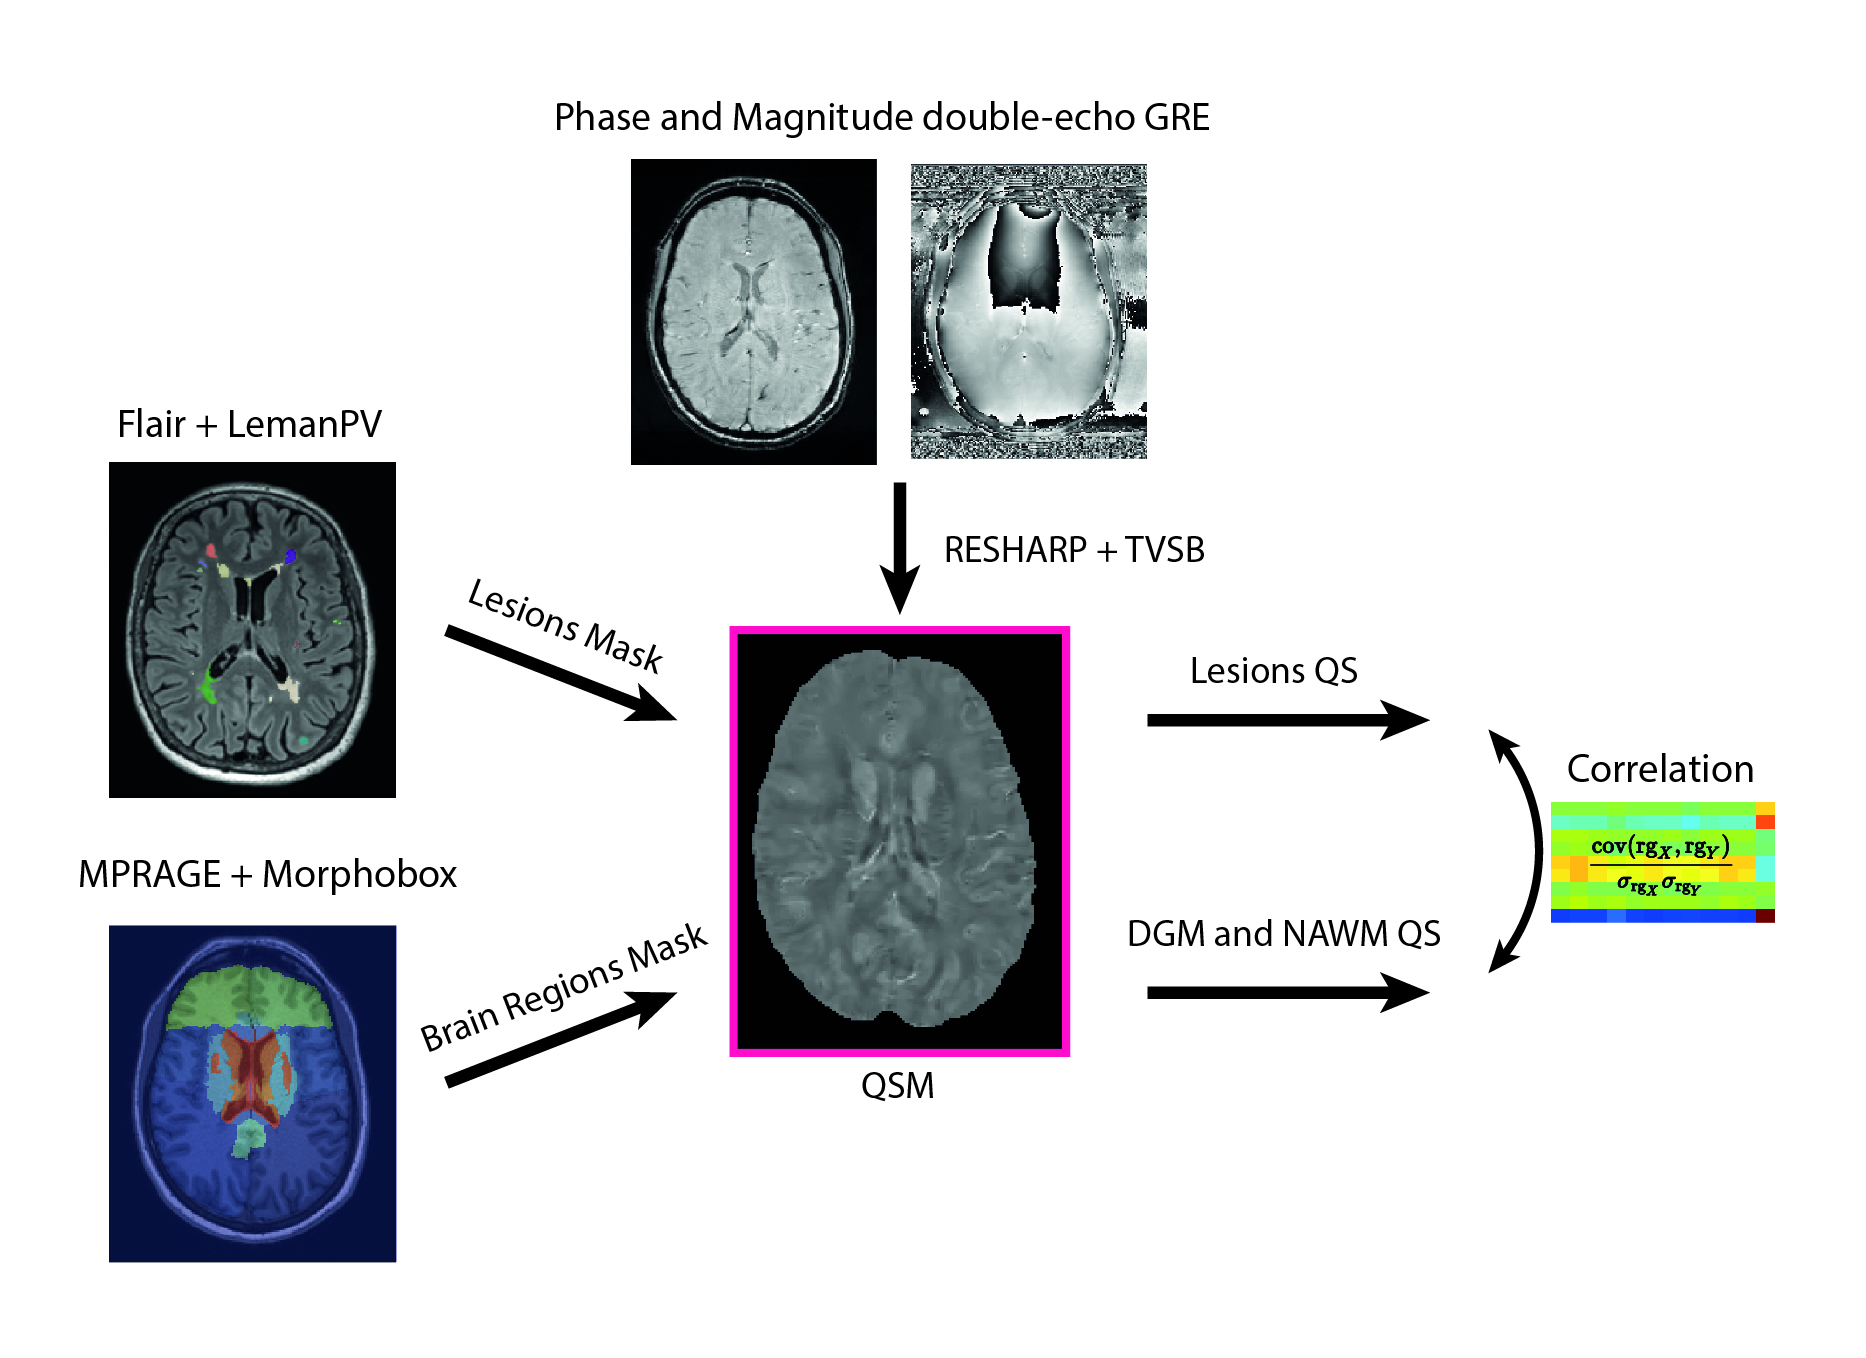
We performed a retrospective study on a cohort of 73 (59 women, mean age = 38.5 years, standard deviation = 12 years, range: 17-66 years) MS patients, who underwent a single-time-point brain MRI at 3T (MAGNETOM Skyra, Siemens Healthcare, Erlangen, Germany). The acquisition protocol included 3D FLAIR, T1-MP-RAGE pre/post-Gd, and double-echo GRE (TE=20/40ms) sequences (relevant acquisition parameters are given in Table 1). The fully automated prototype method LeManPV [9, 10] was used for the segmentation of MS lesions taking 3D FLAIR and T1-MP-RAGE pre-Gd images as input. Brain lobes, and segmentations of NAWM, thalamus, and basal ganglia (putamen, pallidum, and caudate) were obtained using the MorphoBox prototype [11] taking T1-MP-RAGE pre-Gd images as input. QSM maps were estimated from GRE images using a standard post-processing pipeline that incorporates RESHARP and TVSB algorithms [12, 13]. LeMan-PV and MorphoBox output masks were rigidly registered into the QSM space using ELASTIX [14]. Subsequently, median QSM values of thalamus, NAWM, and basal ganglia were extracted (see Figure 1). Since the QSM reconstruction includes an ill-posed inverse problem, it is only possible to quantify magnetic susceptibility in relation to a reference value rather than in absolute terms [15, 16]. To account for this offset, the median QSM value of the frontal and parietal normal appearing NAWM was subtracted from each extracted QSM value of the same patient (except the NAWM itself). Spearman’s correlations were evaluated in two scenarios:i) Lesion load analysis: relation between total lesion volume in each brain lobe and susceptibility in
a. thalamus and NAWM, expecting negative correlation due to decreased iron content.
b. basal ganglia, expecting positive correlation due to decrease in myelin content.
ii) NAWM susceptibility analysis: relation between NAWM and DGM susceptibilities, expecting a positive correlation due to interconnectivity.
Results
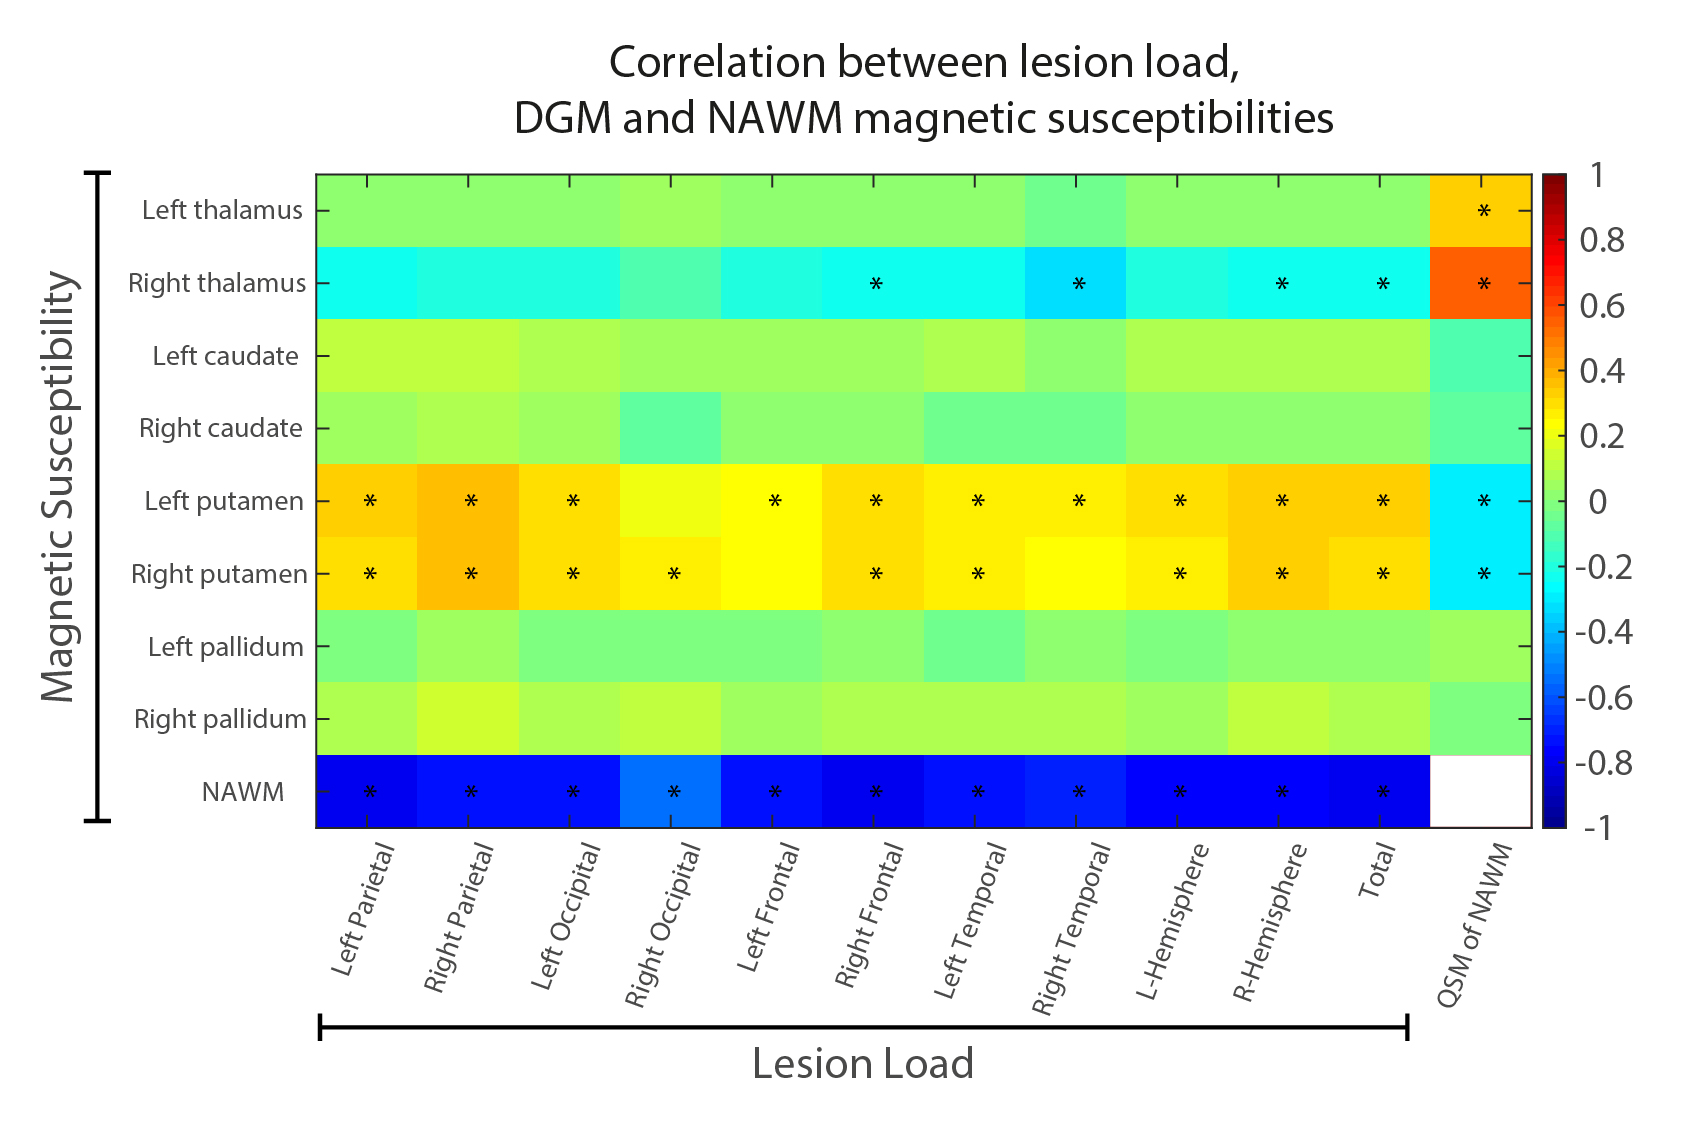
From the entire cohort, two patients were excluded due to poor image quality.i) Lesion load analysis: We found significantly positive correlations between both right and left putamen and the supratentorial lobes (rho = [0.25 to 0.35], p-value = [0.002 to 0.038]) except the right occipital lobe. We found significantly negative correlations between right thalamus and right frontal lobe (rho = -0.25, p-value = 0.04) as well as right thalamus and temporal lobes (rho = -0.32, and p-value = 0.005, see Figures 2). We found strong negative correlations between NAWM susceptibility and lesion load of each region (rho = [-0.55 to -0.78], p-value < 0.0001).
ii) NAWM susceptibility analysis: We found a positive correlation in the right (rho = 0.54, p-value = 0.00001) and left (rho = 0.32, p-value = 0.005) thalami, and a negative correlation in right (rho = -0.29, p-value = 0.012) and left (rho = -0.29, p-value = 0.014) putamen.
Discussion
Comparing lesion load with DGM structures and NAWM susceptibilities, we found that a lower susceptibility of the thalamus and NAWM as well as a higher susceptibility for basal ganglia were associated with higher lesion load. Assuming that lesion load is related to disease duration and disability (although not perfectly correlated), these results are in line with previous studies [7]. Our findings bring more evidence that susceptibility of the studied structures could be used as biomarkers for disease progression (providing information about iron loss in NAWM and thalamus and myelin loss in the basal ganglia. Additionally, we found a positive correlation between NAWM susceptibility and thalamus susceptibility, adding evidence to the interconnectivity of both structures and their association to the damage in MS [8].Conclusion
In this study, we found several correlations between lesion load per lobe and susceptibility values of the thalamus, NAWM and basal ganglia. From our findings, new biomarkers for disease progression in MS providing information regarding iron and/or myelin loss could potentially be derived which would facilitate personalized treatment planning in the clinical practice.Acknowledgements
No acknowledgement found.References
1. Wisnieff, C., et al., Quantitative susceptibility mapping (QSM) of white matter multiple sclerosis lesions: interpreting positive susceptibility and the presence of iron. Magnetic resonance in medicine, 2015. 74(2): p. 564-570.
2. Stüber, C., D. Pitt, and Y. Wang, Iron in Multiple Sclerosis and Its Noninvasive Imaging with Quantitative Susceptibility Mapping. International Journal of Molecular Sciences, 2016. 17(1): p. 100. 3. Langkammer, C., et al., Quantitative susceptibility mapping (QSM) as a means to measure brain iron? A post mortem validation study. NeuroImage, 2012. 62(3): p. 1593-1599.
4. Schweser, F., et al., Mapping of thalamic magnetic susceptibility in multiple sclerosis indicates decreasing iron with disease duration: A proposed mechanistic relationship between inflammation and oligodendrocyte vitality. NeuroImage, 2018. 167: p. 438-452.
5. Hametner, S., et al., Iron and neurodegeneration in the multiple sclerosis brain. Annals of neurology, 2013. 74(6): p. 848-861.
6. Chen, W., et al., Quantifying the susceptibility variation of normal-appearing white matter in multiple sclerosis by quantitative susceptibility mapping. American Journal of Roentgenology, 2017. 209(4): p. 889-894.
7. Zivadinov, R., et al., Brain Iron at Quantitative MRI Is Associated with Disability in Multiple Sclerosis. Radiology, 2018. 289(2): p. 487-496.
8. Kipp, M., et al., Thalamus pathology in multiple sclerosis: from biology to clinical application. Cellular and molecular life sciences, 2015. 72(6): p. 1127-1147.
9. Fartaria, M.J., et al., Automated detection of white matter and cortical lesions in early stages of multiple sclerosis. Journal of Magnetic Resonance Imaging, 2016. 43(6): p. 1445-1454.
10. Fartaria, M.J., et al. Segmentation of Cortical and Subcortical Multiple Sclerosis Lesions Based on Constrained Partial Volume Modeling. 2017. Cham: Springer International Publishing.
11. Schmitter, D., et al., An evaluation of volume-based morphometry for prediction of mild cognitive impairment and Alzheimer's disease. NeuroImage: Clinical, 2015. 7: p. 7-17.
12. Deverdun, J., et al., Validation of a quantitative susceptibility mapping acquisition and reconstruction pipeline using a new iron sucrose based MR susceptibility phantom. Journal of Neuroradiology, 2017. 44(4): p. 269-272.
13. Carra-Dalliere, C., et al., Use of quantitative susceptibility mapping (QSM) in progressive multifocal leukoencephalopathy. Journal of Neuroradiology, 2016. 43(1): p. 6-10.
14. Klein, S., et al., Elastix: a toolbox for intensity-based medical image registration. IEEE transactions on medical imaging, 2009. 29(1): p. 196-205.
15. Straub, S., et al., Suitable reference tissues for quantitative susceptibility mapping of the brain. Magnetic Resonance in Medicine, 2017. 78(1): p. 204-214.
16. Wang, Y. and T. Liu, Quantitative susceptibility mapping (QSM): Decoding MRI data for a tissue magnetic biomarker. Magnetic resonance in medicine, 2015. 73(1): p. 82-101.
Figures