1384
Cross-relaxation magnetic resonance imaging for multiple sclerosis1Department of Neurology, University of California San Francisco, San Francisco, CA, United States, 2Department of Cell Biology and Anatomy, National Cheng Kung University, Tainan, Taiwan
Synopsis
Magnetization transfer (MT) is of great interest in clinical and pre-clinical imaging to probe tissue properties that cannot be visualized directly with conventional MRI. Current research and development of MT MRI is based on the chemical exchange mechanism. However, it has long been reported that, instead of chemical exchange, the cross-relaxation mechanism is responsible for MT in biological tissue. In this work, a fast MRI method is developed based on cross relaxation for the measurement of the spin–lattice relaxation rate and the MT rate and is applied to characterize multiple sclerosis lesions.
INTRODUCTION
Multiple sclerosis (MS) is an inflammatory, demyelinating condition of the central nervous system, which affects 2.3 million people worldwide. MRI is the preferred imaging modality for MS and the magnetic transfer (MT) MRI is particularly of interest. Through the MT effect, water and myelin exchange magnetization; hence the myelin content can be inferred from MRI of water.In conventional MT MRI, the MT effect is described by chemical exchange, in which the spin–lattice relaxation (R1) and MT are independent mechanisms1. However, it has long been reported2–8 that chemical exchange is not responsible for MT in biological tissue, but cross relaxation is. In cross relaxation, protons do not exchange sites but their spins change states through transitions between energy levels. MT is the result of the zero- and double-quantum transitions, and R1 is the result of the single- and double-quantum transitions. Because the three transitions exist at the same time and cannot be manipulated individually, R1 and the MT rate cannot be measured separately, as opposed to the conventional approach. In this work, a fast MRI method is developed based on cross relaxation for the measurement of R1 and the MT rate and is applied to characterize MS lesions.
METHODS
Denote the magnetization of the water and macromolecule protons by M and Q, respectively. Cross relaxation is described by the Solomon equations9. A simplified form is given by$$\frac{dM_z}{dt}=R_1(M_\mathrm{eq}-M_z)+R_k\left[(M_\mathrm{eq}-M_z)-(Q_\mathrm{eq}-Q_z)\right]$$
$$\frac{dQ_z}{dt}=R_1^{Q}(Q_\mathrm{eq}-Q_z)+R_k\left[(Q_\mathrm{eq}-Q_z)-(M_\mathrm{eq}-M_z)\right]$$
where Rk is the MT rate. Q is a dimensionless function of time that describes the dynamic steady-state of the macromolecular magnetization. The cross-relaxation (CR) MRI pulse sequence will collect image data to fit to these equations to determine R1 and Rk together. A CR MRI scan will run the Look–Locker pulse sequence twice, one with off-resonance (1.2 kHz) MT pulses on and one with the MT pulses off. The MT pulse is applied before each slice excitation pulse. A whole brain scan can be completed in 9 min (including flip-angle mapping), covering both supratentorial and infratentorial regions. The sequence uses 2D spirals10 with 8 segments and collects total of 12 images to fit Eqs. (1) and (2) for M0, R1, Rk, and Meq. 84 slices with 20% gap are acquired in 6 slice groups for each image, and are interpolated to 100 slices. Other parameters: FOV 230×230 mm, matrix 152×152, final resolution 1.5×1.5×1.5mm, TE 4.0 ms, inter-pulse spacing 108 ms, flip angle 55°.
RESULTS AND DISCUSSION
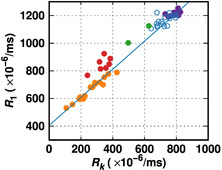
In Fig. 1, the coordinates of each point are the average R1 and Rk values of pixels in one lesion from a different patient. The orange points represent chronic stable lesions in MS patients. The purple points are from normal volunteers; each represents a volume of ~20 pixels. The normal and chronic points can be fitted to a straight line as shown in Fig. 1.All data points of the enhancing lesions, a sign of active inflammation, and the points of diffusely-abnormal white matter (DAWM) appear above the line. The points of normal appearing WM (NAWM) in patients appear close to those of normal WM but have lower Rk values, suggesting minor degeneration of myelin content.
The straight line is predictable by the relaxation physics. Although R1 and Rk do not directly depend on each other, they both depend on the correlation time τc. Normal WM and chronic lesions share the same line, which implies that the tissue micro-environment with respect to macromolecule tumbling is similar; the difference is their myelin content as reflected by Rk. However, the events related to active MS lesions, such as edema, presence of myelin degeneration products, and increased cellularity, can alter the tissue micro-environment; therefore, the data points of the enhancing lesions and DAWM appear off the line.
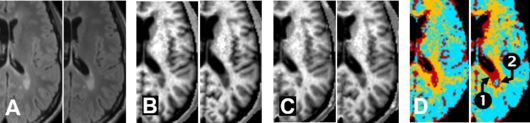
CR MRI provides a novel way to visualize the status of MS-specific activities as shown in Fig. 2. The between-visit change of the lesion near the ventricle is not obvious in the T2*-weighted images; consequently, the lesion might not be considered active. However, the demyelinating progression can easily be identified in the CR MRI Rk maps. The lesion was not enhancing at the two visits; thus, conventional MRI cannot relate the progression with any on-going disease activities. By contrast, the color-coded status map indicates that, at the initial visit, the lesion was as active as an enhancing lesion (dark red pixels), and the adjacent tissue is abnormal (gold pixels). The status map of the second visit is also informative of the lesion progression: (1) the expanded part of the lesion had become more demyelinated (dark red pixels) and (2) a small portion of the lesion became chronic (i.e., back on the R1–Rk line; blue-green pixels). CR MRI may provide information unavailable from conventional MRI to better describe lesion progression.
CONCLUSION
This work introduces a pulse sequence and an analysis method that realize the measurement of the cross-relaxation rates for MRI. In cross relaxation, R1 and MT are two coexistent pathways of the same relaxation mechanism rather than two different relaxation mechanisms. Analysis with MS lesions suggests that CR MRI is clinically feasible and, compared with conventional MRI techniques, can better describe lesion inflammation and demyelination status and document lesion progression.Acknowledgements
References
1. McConnell, H. M. Reaction Rates by Nuclear Magnetic Resonance. J. Chem. Phys. 28, 430–431 (1958).
2. Campbell, I. . & Freeman, R. Influence of cross-relaxation on NMR spin-lattice relaxation times. J. Magn. Reson. 11, 143–162 (1973).
3. Kalk, A. & Berendsen, H. J. . Proton magnetic relaxation and spin diffusion in proteins. J. Magn. Reson. 24, 343–366 (1976).
4. Koenig, S. H., Bryant, R. G., Hallenga, K. & Jacob, G. S. Magnetic cross-relaxation among protons in protein solutions. Biochemistry 17, 4348–4358 (1978).
5. Edzes, H. T. & Samulski, E. T. The measurement of cross-relaxation effects in the proton NMR spin-lattice relaxation of water in biological systems: Hydrated collagen and muscle. J. Magn. Reson. 31, 207–229 (1978).
6. Sykes, B. D., Hull, W. E. & Snyder, G. H. Experimental evidence for the role of cross-relaxation in proton nuclear magnetic resonance spin lattice relaxation time measurements in proteins. Biophys. J. 21, 137–146 (1978).
7. Fung, B. . & McGaughy, T. W. Cross relaxation in hydrated collagen. J. Magn. Reson. 39, 413–420 (1980).
8. Grad, J. & Bryant, R. G. Nuclear magnetic cross-relaxation spectroscopy. J. Magn. Reson. 90, 1–8 (1990).
9. Solomon, I. Relaxation Processes in a System of Two Spins. Phys. Rev. 99, 559–565 (1955).
10. Glover, G. H. Simple analytic spiral K-space algorithm. Magn. Reson. Med. 42, 412–415 (1999).
Figures