1383
QSM and R2* capture physical and cognitive impairment in multiple sclerosis1Physics and Astronomy, University of British Columbia, Vancouver, BC, Canada, 2Pediatrics, University of British Columbia, Vancouver, BC, Canada, 3Medicine (Neurology), University of British Columbia, Vancouver, BC, Canada, 4Radiology, University of British Columbia, Vancouver, BC, Canada, 5MS/MRI Research (Neurology), University of British Columbia, Vancouver, BC, Canada
Synopsis
Abnormalities seen on clinical MRIs in the brain and spinal cord of multiple sclerosis (MS) patients lack specificity to myelin. Thus, efficacy of new treatments that aim to protect or remyelinate cannot be fully captured. Quantitative MR metrics, such as R2* and quantitative susceptibility mapping (QSM), have demonstrated good sensitivity to myelin and iron-related tissue changes, but the clinical relevance of such changes has not yet been assessed. We showed that R2* provides good group-wise distinction of MS patients and controls, while QSM values reflected clinically meaningful variations in upper and lower motor function as well as cognitive processing speed.
Introduction
On MRI, multiple sclerosis (MS) is characterized by focal and diffuse damage in both white and gray matter1,2, reflecting demyelination, axonal loss and glial scarring3. Due to the inflammatory and often asymptomatic nature of MS lesions, measurements of lesion count or volume typically fail to represent the probability and degree of progression and clinical disability of patients4,5. Moreover, because of the low specificity of clinical MRI abnormalities to myelin, the efficacy of new treatments that aim to protect or remyelinate axons in order to halt progression6 cannot be fully captured7. Susceptibility-sensitive imaging, including R2*8 and QSM9,10, has demonstrated sensitivity to myelin-related changes11,12 and therefore promises to aid in assessing treatment efficacy. Importantly, R2* and QSM are also susceptible to tissue iron13,14, a notable contributor to myelin health and maintenance15. However, specific clinical relevance of changes in R2* and QSM has not yet been fully assessed. Here, we tested whether differences between early MS patients and healthy controls can be detected by R2* or QSM. Further, we assessed if these differences relate to clinical metrics of physical and cognitive performance.Methods
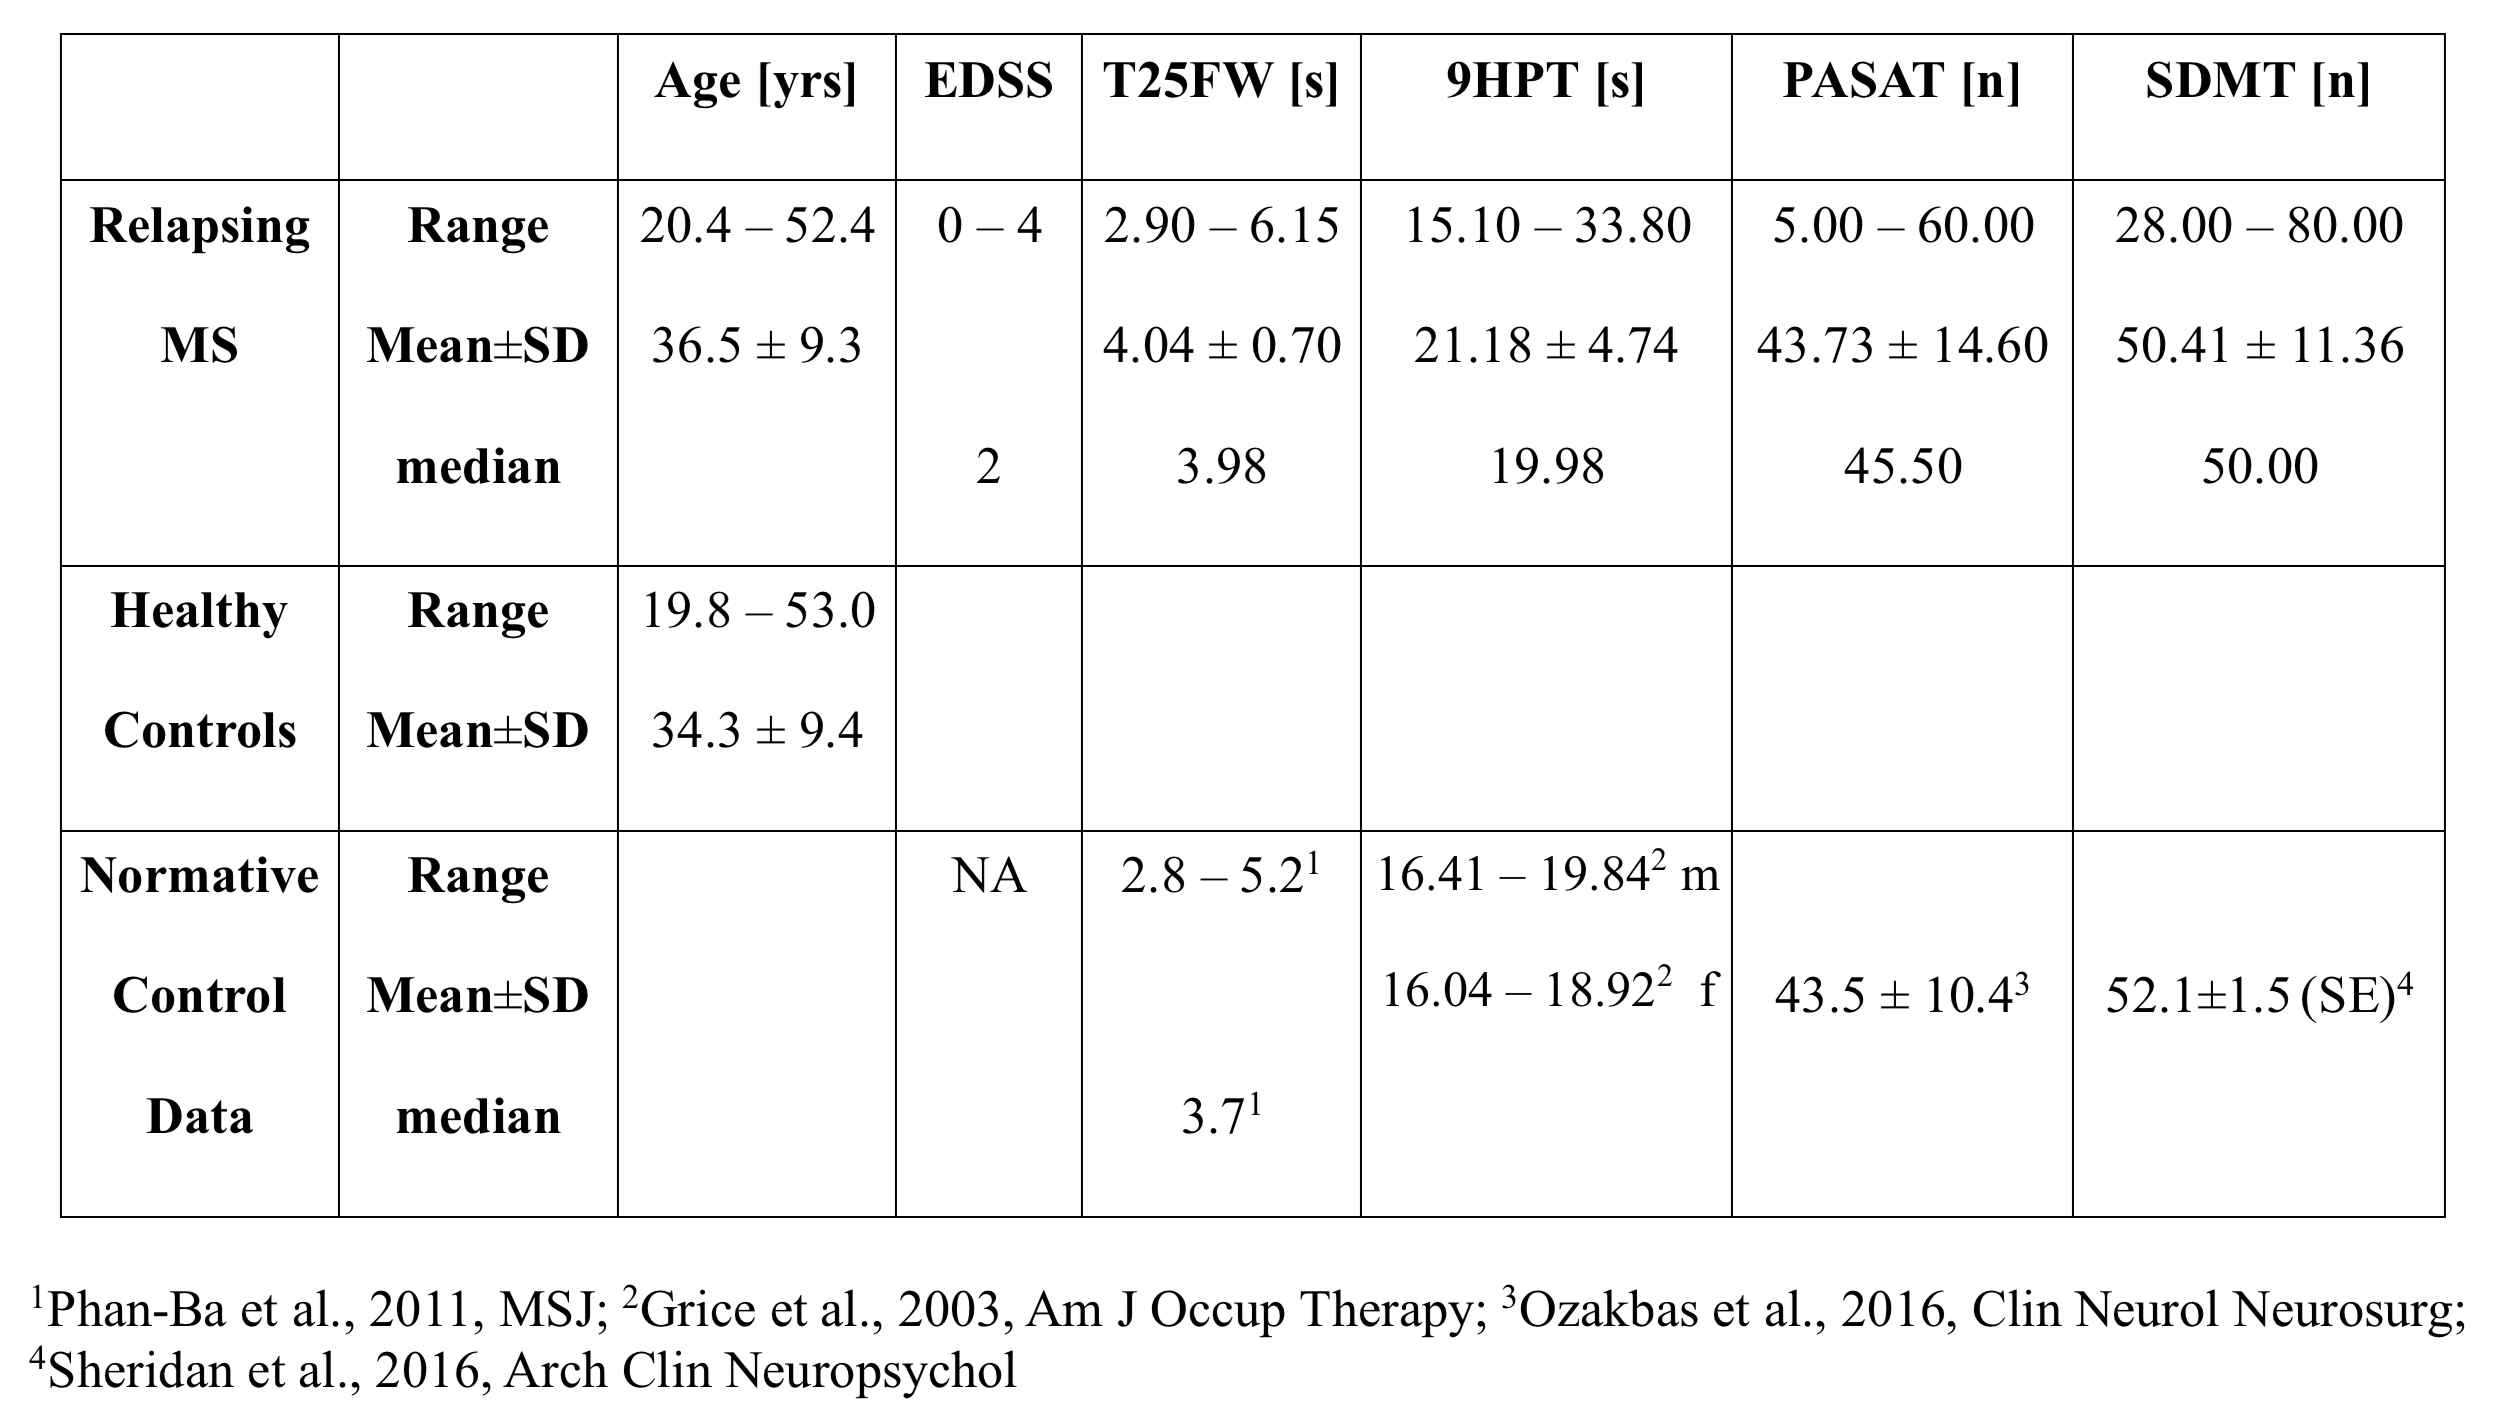
25 relapsing MS patients were scanned at 3T at baseline as part of a substudy of a phase III randomized double-blind placebo-controlled clinical trial (NCT01412333). All patients were assessed with the expanded disability status scale (EDSS) and participated in the timed 25 foot-walk (T25FW), the 9-hole peg test (9HPT), 3s paced auditory serial addition test (PASAT) and symbol digit modalities test (SDMT). Table 1 summarizes demographic and clinical information. MRI data from 40 age-matched healthy controls were collected for comparison. MRI included a T1-weighted image, acquired at 1x1x3mm3 with TR/TE=28/4ms, and a 3D gradient-echo for R2* and QSM, using 6 echoes with TR/TE/∆TE of 38/4/4.5ms, acquired and reconstructed voxel sizes 0.5x0.75x2mm3 and 0.49x0.49x1mm3, respectively. After upsampling to isotropic resolution, each echo of the phase data was Laplacian unwrapped, V-SHARP background field removed and dipole inverted10. QSM values were computed from echoes two to six and normalized to CSF. Six regions-of-interest (ROIs) were extracted from the JHU-DTI-ICBM labels and Harvard Oxford atlas in MNI space: the thalamus, putamen, genu and splenium of the corpus callosum, the anterior and posterior internal capsules (IC) and the superior longitudinal fasciculus (SLF). Image co-registration was performed using FSL16,17 through the subject 3D pre-contrast FFE T1 image space. MS lesions, which had been semi-automatically identified18, were excluded from the ROIs. Median regional R2* and QSM values were obtained in subject space. Group differences were assessed using a Wilcoxon rank sum test, adjusted by Holm-Sidak. A linear regression model predicted the relative importance19 of the MR values to the clinical metrics.Results
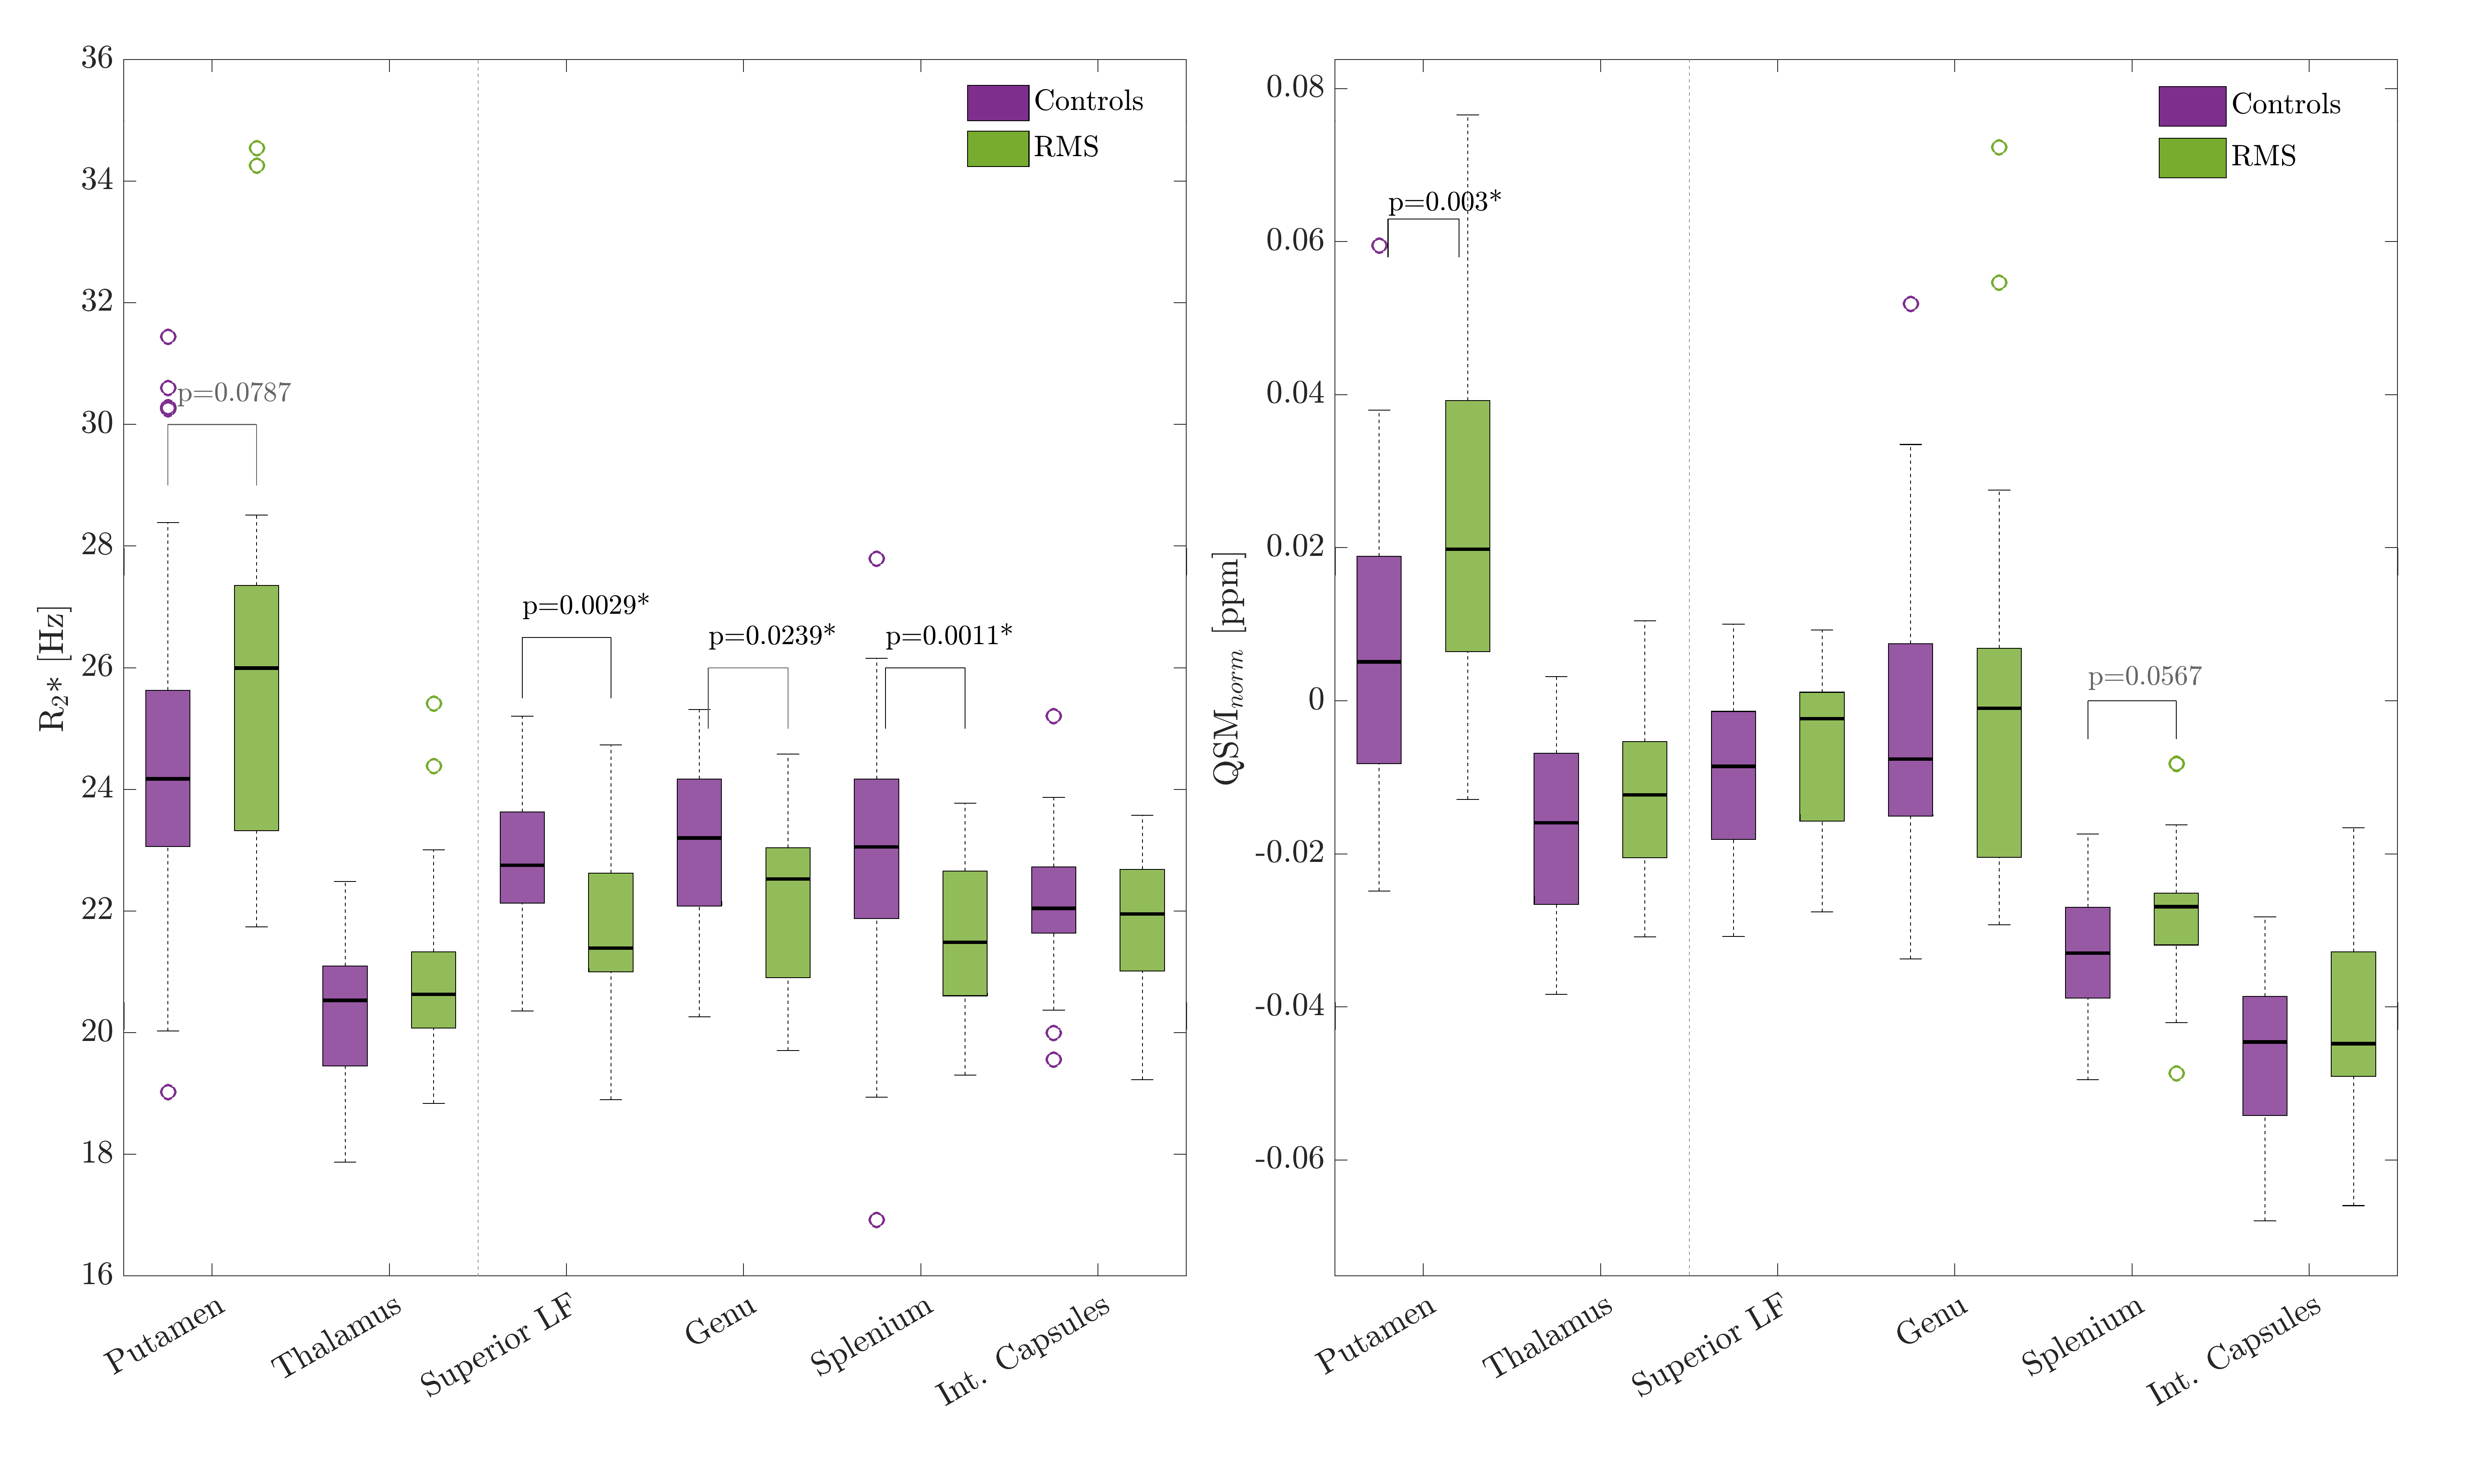
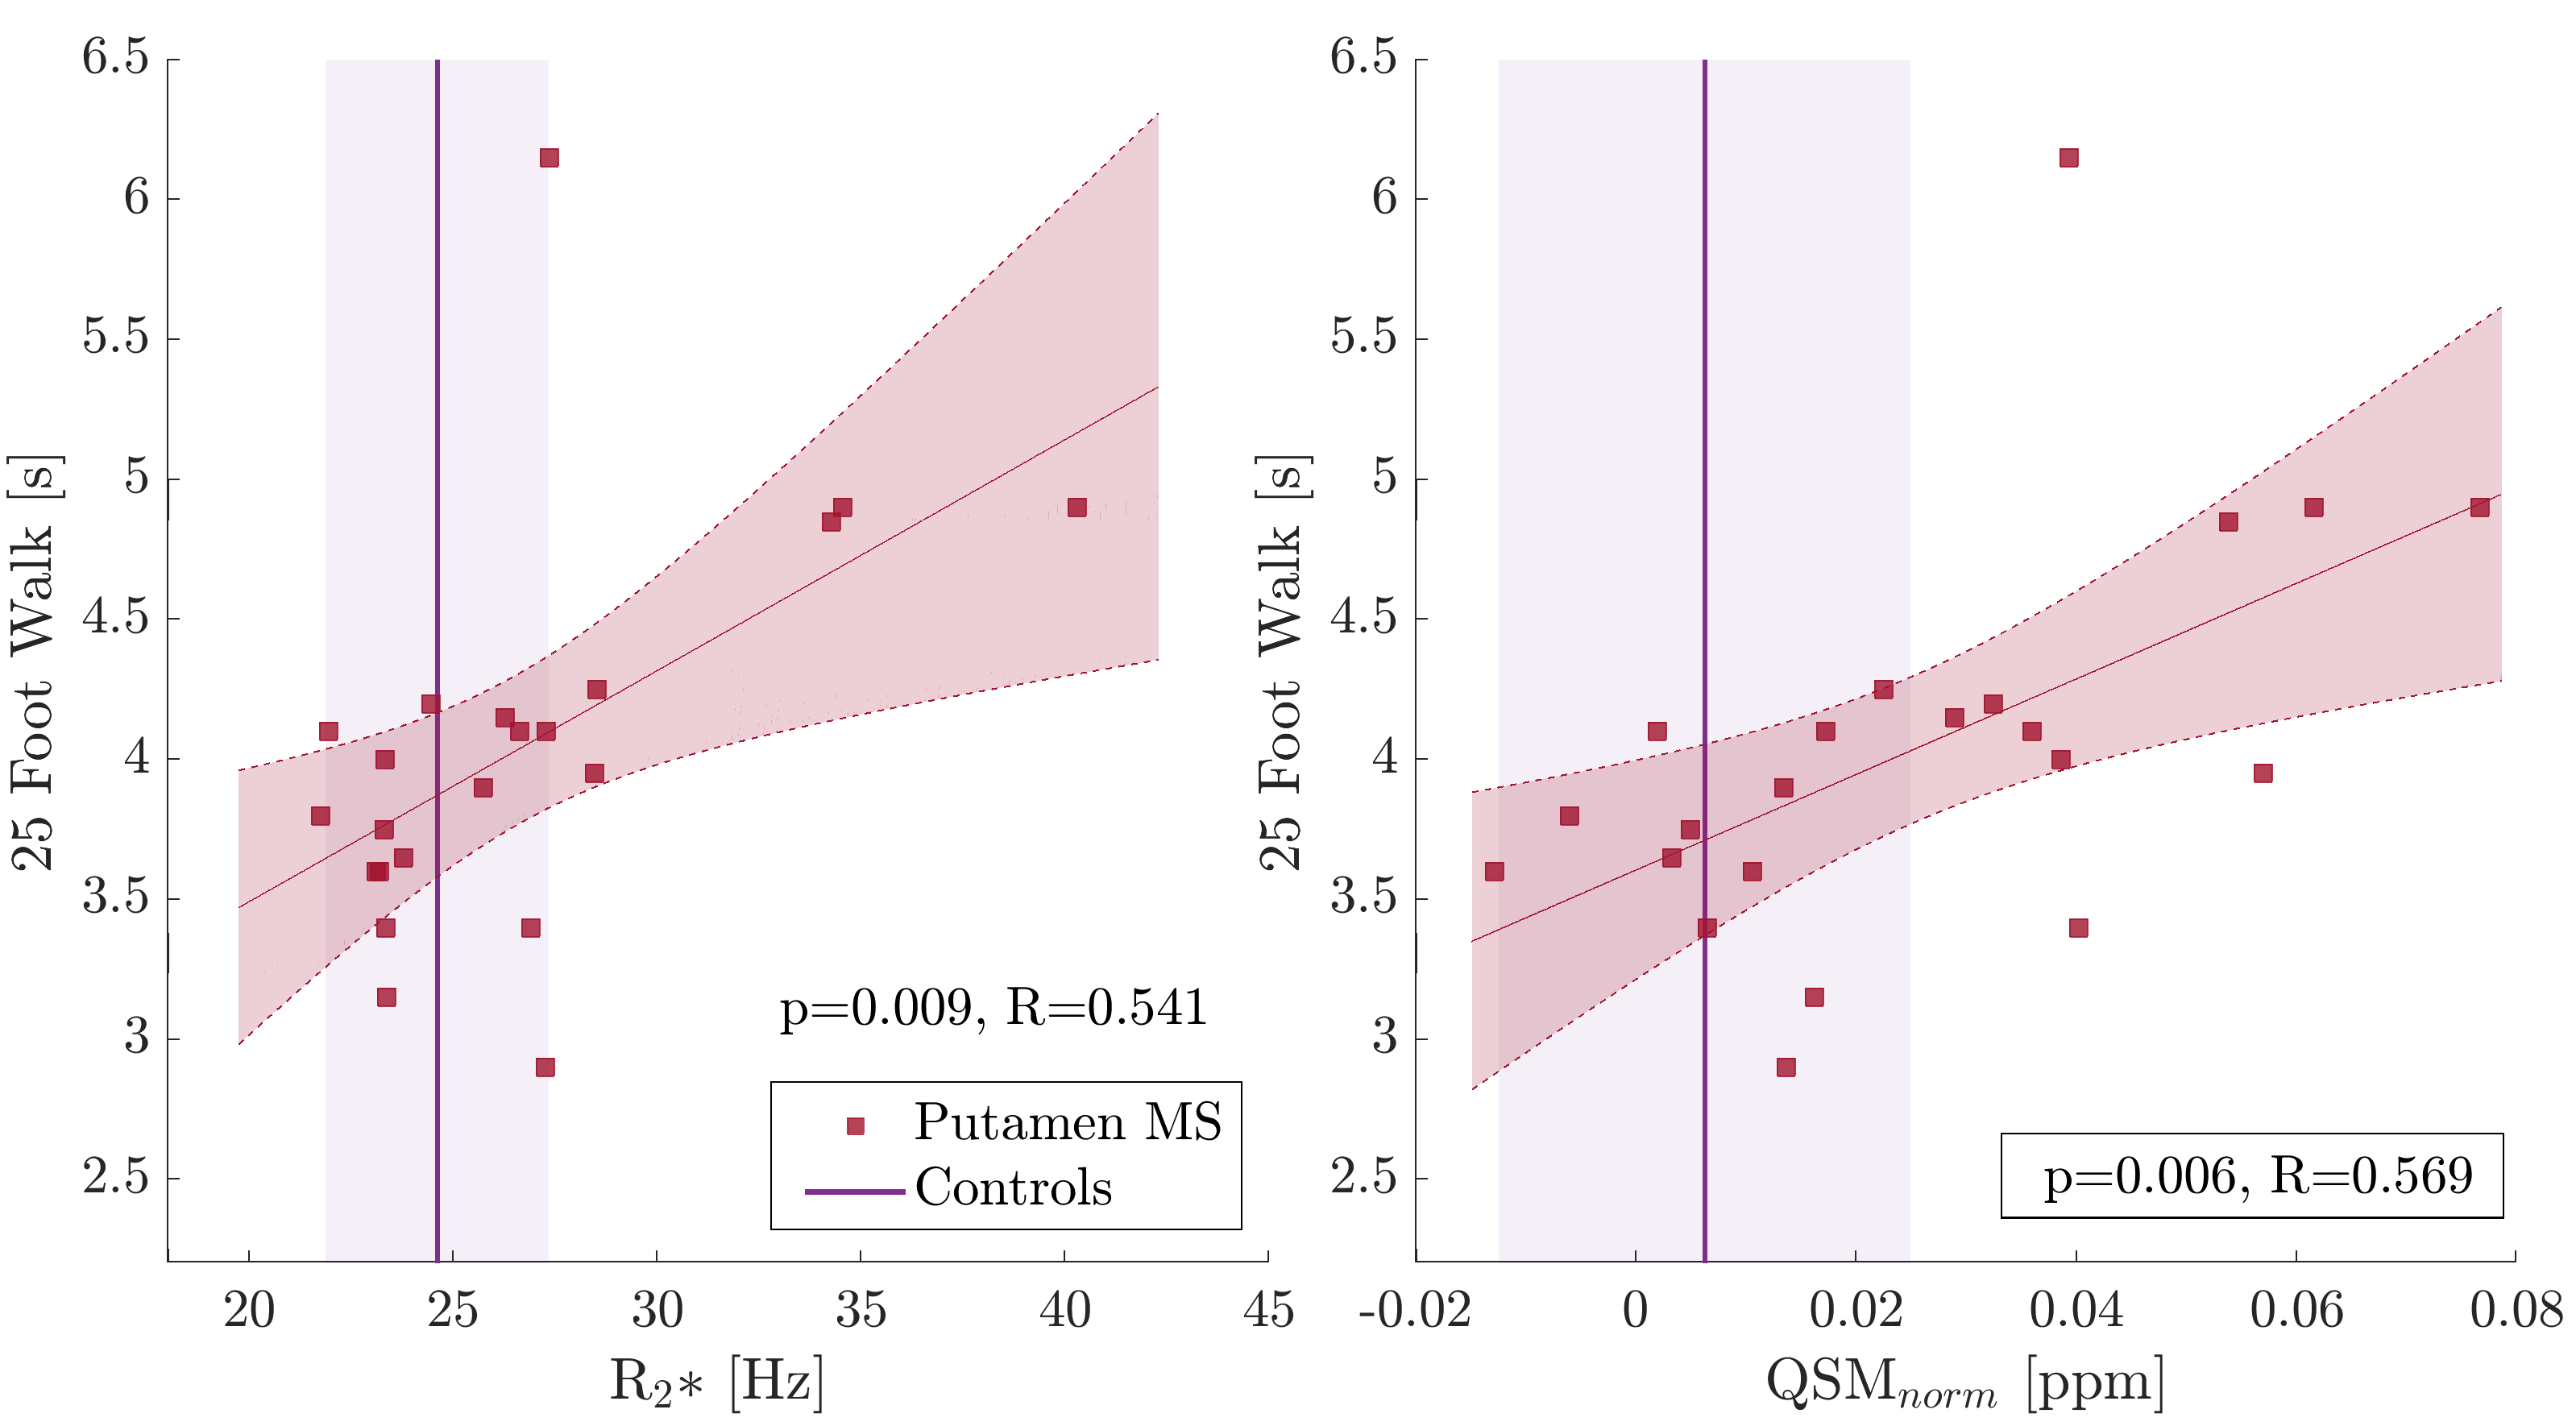
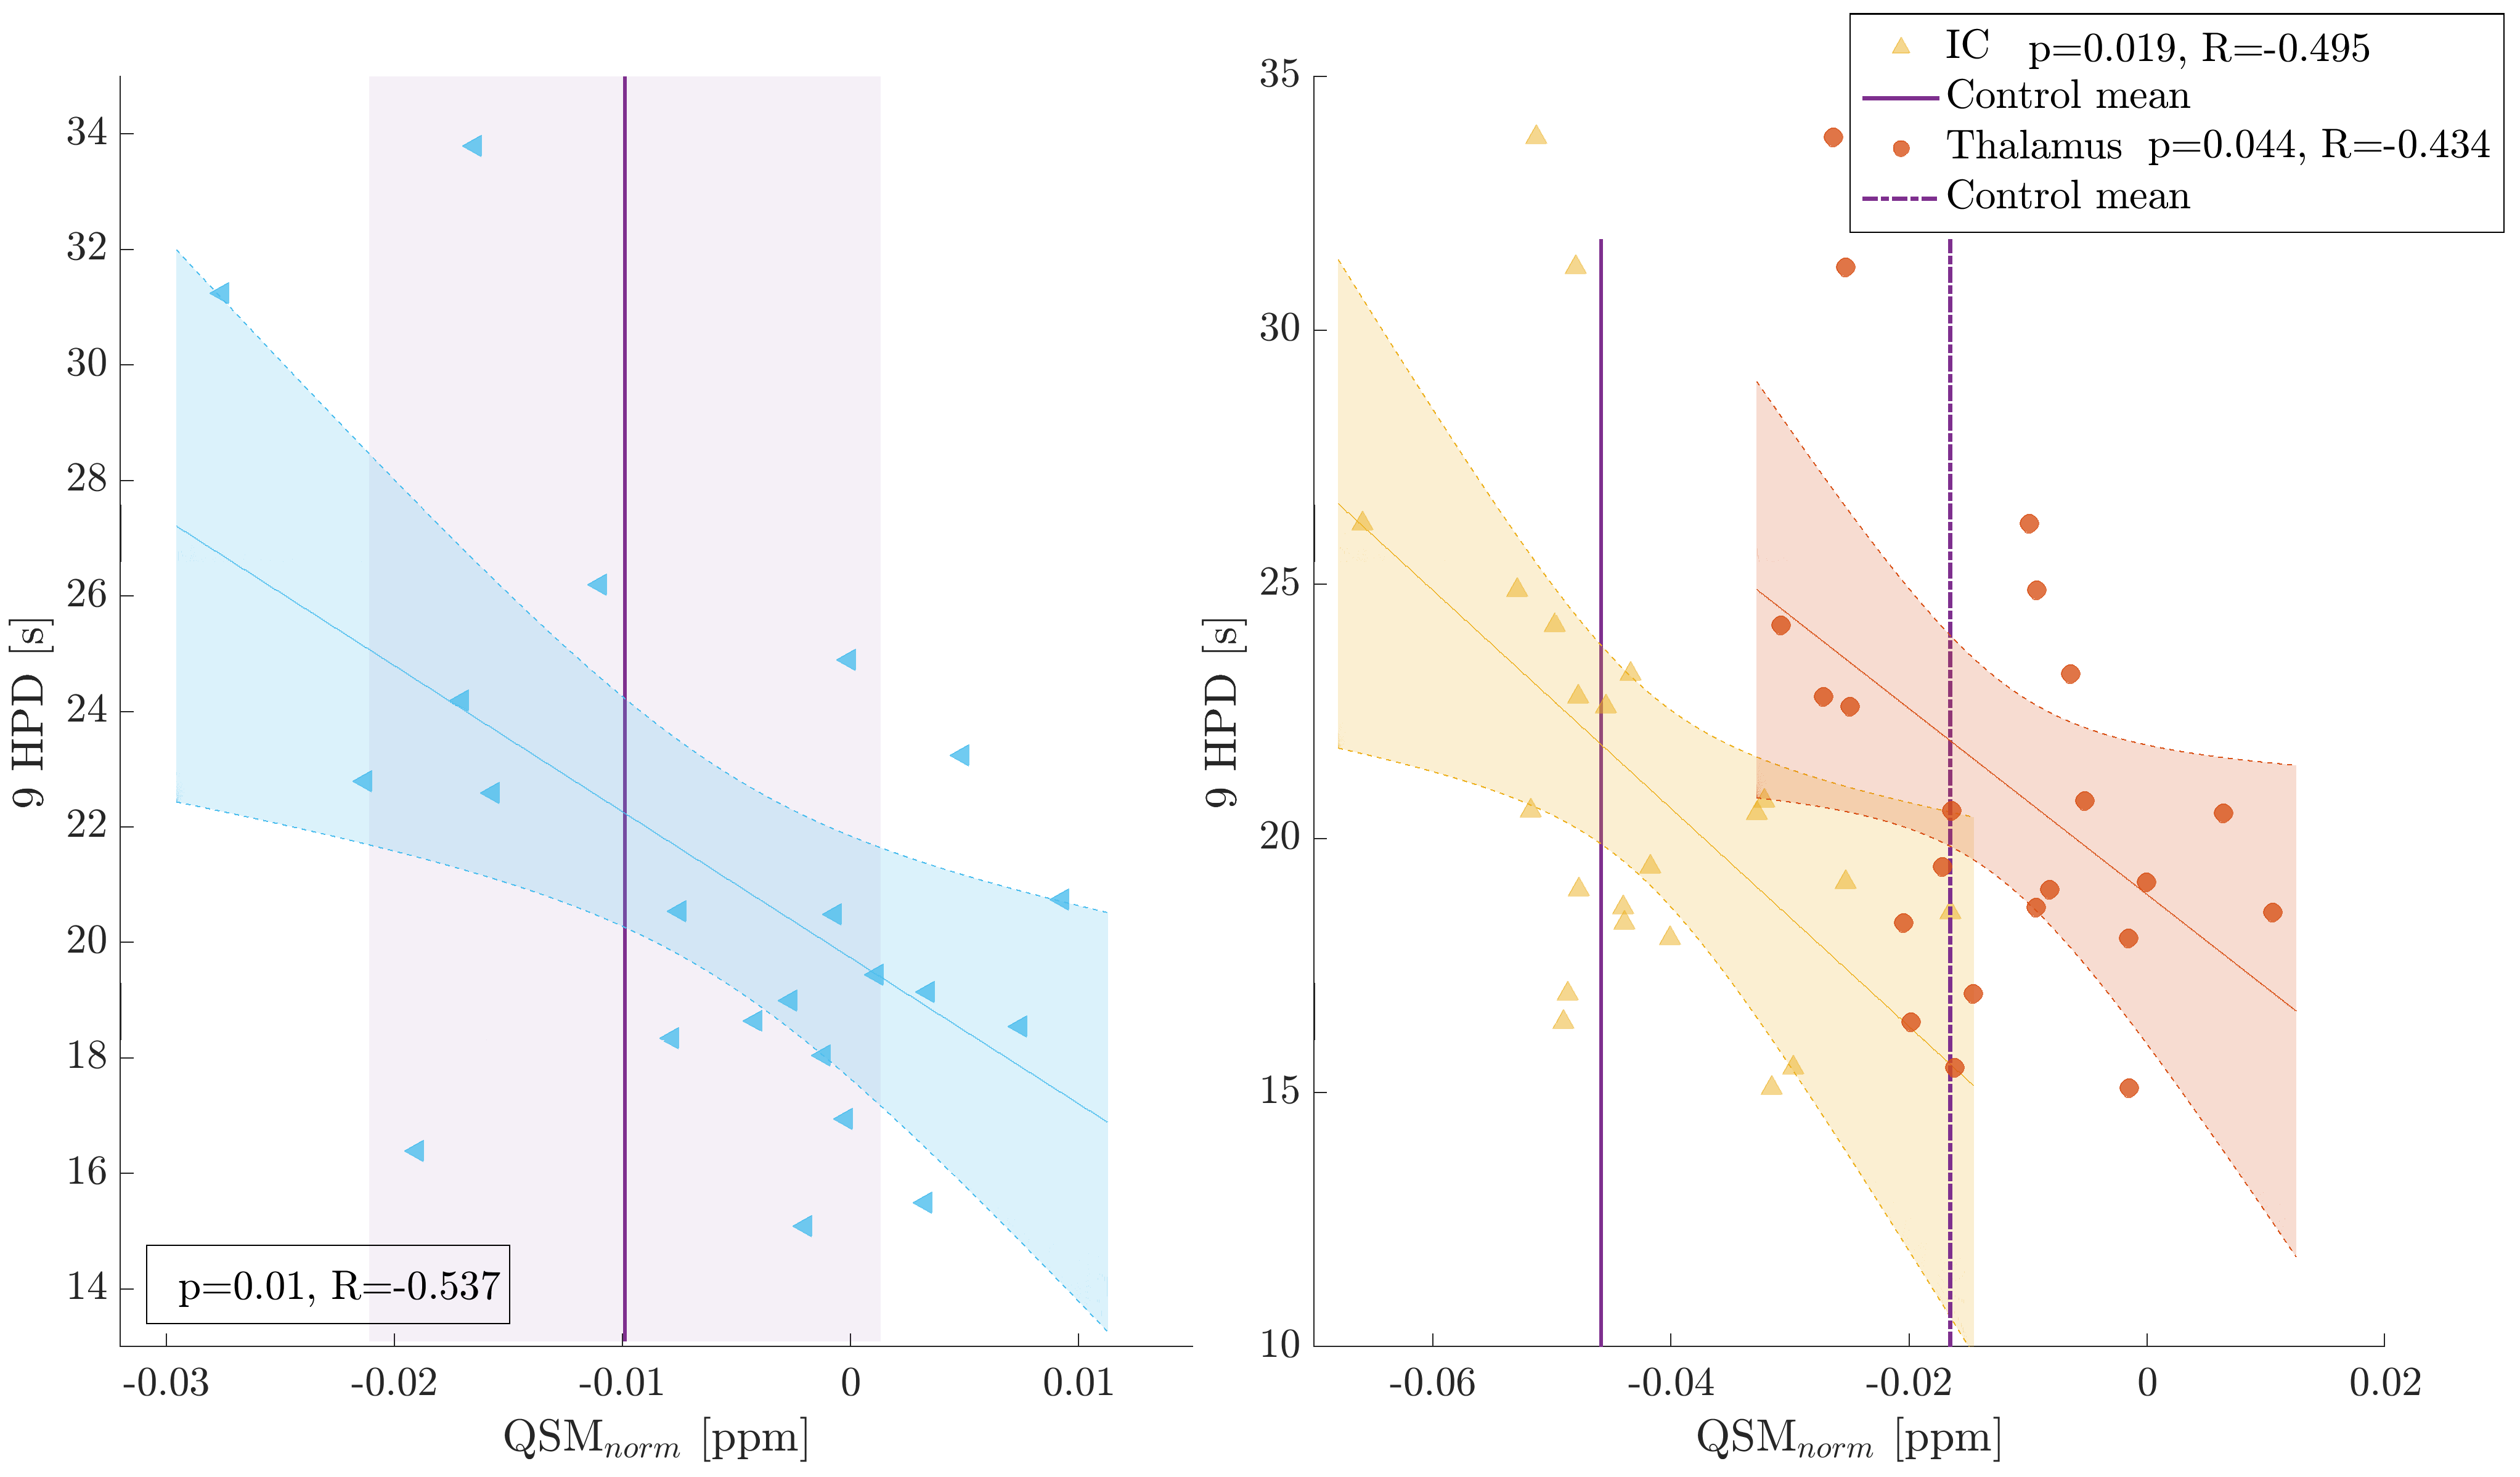
On a group level, MS patients showed higher R2* in the deep gray matter and significantly lower R2* in WM structures than observed in controls (Fig. 1, left). QSM values were significantly higher only in the putamen in MS compared to controls. WM structures showed a trend to increased QSM values in MS compared to controls (Fig. 1, right). Within the MS group, higher R2* and QSM in the putamen and splenium related to slower walking speed on the T25FW (Fig. 2). Other significant relationships included negative associations between QSM values in the SLF, thalamus and IC with 9HPT scores (Fig. 3). Finally, a positive association was observed between QSM values in the IC and SDMT scores. All significant correlations were confirmed to be relevant predictors of the clinical scores in the linear regression analysis. Including age, sex and regional volume as covariates, putaminal R2* and QSM had a relative importance (RI) of 47.5 and 51.8% in predicting T25FW outcomes. In the splenium, RI of R2* and QSM was around 40% each, behind age at 50%. RI of QSM for predicting 9HPT times were between 65-75% in the different regions. The IC was the only region in which QSM was the primary predictor of SDMT scores (RI 58.5%). No significant relationships were observed between EDSS or PASAT with MRI measures in any region.Discussion
We demonstrated that both R2* and QSM distinguished early MS patients from healthy controls on a group basis. QSM reflected and predicted clinical outcomes, more so than age, sex and regional volumes. The positive relationship between putaminal and splenial R2* and QSM with T25FW is consistent with atrophy20-24, albeit demyelination may contribute to these findings. In contrast, the negative relationship between SLF-QSM and 9HPT suggests iron loss. Iron loss in white matter correlates with disease duration in MS25, and iron deficiency is known to contribute to impaired development and cognitive function26,27. Correlations in the IC and thalamus with 9HPT scores are in good agreement with their known involvement in motor functions and central connections. Finally, the SDMT correlation with QSM-IC may be a combined reflection of cognitive as well as motor impairment.Conclusion
Both, R2* and QSM demonstrated significant sensitivity in distinguishing patients from controls and changes in these metrics correlated with clinical measures of physical and cognitive performance. While R2* provided a better group-wise distinction, as it gives an overall picture of the damage due to MS, QSM appeared to be an excellent reflection of clinically meaningful differences between patients in functionally relevant ROIs.Acknowledgements
This study was sponsored by F. Hoffman-La Roche AG. Genentech (owned by F. Hoffman-La Roche) sponsored the collection of the data used in this study. VW was supported by a graduate studentship award from the MS Society of Canada. SHK is supported by the Michael Smith Foundation. AR is supported by Canada Research Chairs.References
[1] McDonald et al., Recommended diagnostic criteria for multiple sclerosis: guidelines from the International Panel on the diagnosis of multiple sclerosis. Annals of Neurol 2001;50(1):121-127. \
[2] Thompson et al., Diagnosis of multiple sclerosis: 2017 revision of the McDonald criteria. Lancet Neurol 2018;17(2):162-173.
[3] Lucchinetti et al., Distinct patterns of multiple sclerosis pathology indicates heterogeneity in pathogenesis. Brain Pathol 1996;6(3):259-274.
[4] Barkhof F. The clinico-radiological paradox in multiple sclerosis revisited. Curr Opion Neurol 2002;15(3):239-245.
[5] Kermode et al., Breakdown of the blood-brain barrier precedes symptoms and other MRI signs of new lesions in multiple sclerosis: pathogenetic and clinical implications. Brain 1990;113:1477-1489.
[6] Montalban et al., Ocrelizumab versus placebo in primary progressive multiple sclerosis. N Engl J Med 2017;376(3):209-220.
[7] Brex et al., A longitudinal study of abnormalities on MRI and disability from multiple sclerosis. N Engl J Med 2002;346:158-164.
[8] Sedlacik et al., Reversible, irreversible and effective transverse relaxation rates in normal aging brain at 3T. NeuroImage 2014;84:1032-1041.
[9] Li et al., Quantitative susceptibility mapping of human brain reflects spatial variation in tissue composition. NeuroImage 2011;55(4):1645-1656.
[10] Kames et al., Rapid two-step dipole inversion for susceptibility mapping with sparsity priors. NeuroImage 2018;167:276-283.
[11] Sati et al., In vivo quantitative evaluation of brain tissue damage in multiple sclerosis using gradient echo plural contrast imaging technique. NeuroImage 2010;51(3):1089-1097.
[12] Zhang et al., Quantitative susceptibility mapping and R2* measured changes during white matter lesion development in multiple sclerosis: myelin breakdown, myelin debris degradation and removal, and iron accumulation. AJNR 2016;37(9):1629-1635.
[13] Langkammer et al., Quantitative MR imaging of brain iron: a postmortem validation study. Radiology 2010;257(2):455-462.
[14] Langkammer et al., Quantitative susceptibility mapping (QSM) as a means to measure brain iron? A post mortem validation study. NeuroImage 2012;62(3):1593-1599.
[15] Todorich et al., Oligodendrocytes and myelination: the role of iron. Glia 2009;57(5):467-478.
[16] Jenkinson et al., FSL. NeuroImage 2012;62:782-790.
[17] Jenkinson and Smith. Improved optimization for the robust and accurate linear registration and motion correction of brain images. Med Imag Anal 2001;5(2):143-156.
[18] McAusland et al., Optimizing the use of radiologist seed points for improved multiple sclerosis lesion segmentation. IEEE Trans Biomed Eng 2010;11:2689-2698.
[19] Grömping U. Relative importance for linear regression in R: the package relaimpo. J Stat Software 2006,17(1):1-27.
[20] Hernández-Torres et al., Increased mean R2* in the deep gray matter of multiple sclerosis patients: Have we been measuring atrophy? J Magn Reson Imaging 2019;50(1):201-208.
[21] Péran et al., Volume and iron content in basal ganglia and thalamus. HBM 2009;30(8):2667-2675.
[22] Niemann et al., Exercise-induced changes in basal ganglia volume and cognition in older adults. Neuroscience 2014;281:147-163.
[23] Motl et al., Thalamus volume and ambulation in multiple sclerosis: a cross-sectional study. Neurodegener Dis Manag 2016;6:23-29.
[24] Pelletier et al., A longitudinal study of callosal atrophy and interhemispheric dysfunction in relapsing-remitting multiple sclerosis. Arch Neurol 2001;58:105-111.
[25] Hametner et al., Iron and neurodegeneration in the multiple sclerosis brain. Ann Neurol 2013;74(6):848-861.
[26] Matak et al., Disrupted iron homeostasis causes dopaminergic neurodegeneration in mice. PNAS 2016;113(13):3428-3435.
[27] Pollitt E., Iron deficiency and cognitive function. Annu Rev Nutr 1993;13(1):521-537.
Figures