1382
Unraveling atrophy, iron and myelin changes in the deep gray matter of multiple sclerosis patients
Giuseppe Pontillo1, Sirio Cocozza1, Serena Monti2, Maria Petracca3, Roberta Lanzillo3, Vincenzo Brescia Morra3, Arturo Brunetti1, and Giuseppe Palma2
1Department of Advances Biomedical Sciences, University of Naples "Federico II", Naples, Italy, 2Institute of Biostructures and Bioimaging, National Research Council, Napoli, Italy, 3Department of Neurosciences and Reproductive and Odontostomatological Sciences, University of Naples "Federico II", Naples, Italy
1Department of Advances Biomedical Sciences, University of Naples "Federico II", Naples, Italy, 2Institute of Biostructures and Bioimaging, National Research Council, Napoli, Italy, 3Department of Neurosciences and Reproductive and Odontostomatological Sciences, University of Naples "Federico II", Naples, Italy
Synopsis
Alterations of magnetic susceptibility are known to occur in the deep gray matter (DGM) of multiple sclerosis (MS) patients, reflecting a mixture of atrophy, iron and myelin changes. We combined the analysis of quantitative susceptibility mapping (QSM) and R1 relaxometry contrasts in order to obtain iron- and myelin-specific maps, from which we estimated mean iron and myelin concentrations as well as total iron and myelin contents for each DGM structure. We found increased mean iron in the basal ganglia of MS patients compared to healthy controls, probably reflecting atrophy-related concentration, along with actual atrophy-independent iron depletion phenomena in the thalamus.
Introduction
Multifaceted Deep Gray Matter (DGM) involvement is a consistent and clinically relevant feature in Multiple Sclerosis1 (MS). Indeed, along with DGM atrophy, which is recognized as one of the main drivers of clinical disability in this condition, a wide range of pathologic changes affecting subcortical GM of MS patients has been also demonstrated using different advanced MR techniques2. Among them, MR relaxometry and Quantitative Susceptibility Mapping (QSM) have emerged as valuable tools to characterize brain damage in vivo by measuring physical parameters intrinsically related to tissue microstructure. Among these, iron concentration is known to have an important role in demyelination, neuroinflammation and neurodegeneration phenomena occurring in MS. Actually, consistent susceptibility changes of thalamus and basal ganglia have been demonstrated in MS patients3,4, allegedly reflecting iron accumulation/depletion and correlating with clinical disability5. Nevertheless, magnetic susceptibility of tissues is influenced by other, not iron-related, biological molecules, including diamagnetic components (primarily myelin), whose spatial distribution is known to significantly overlap with iron patterns in many brain regions, such as DGM6,7. Furthermore, the observed susceptibility changes may reflect an increased iron concentration resulting from DGM atrophy rather than actual total iron variations8. Given this background, we performed a combined QSM and R1 relaxometry investigation of DGM to disentangle the contribution of atrophy, iron and myelin changes to subcortical GM damage in MS patients.Methods
SubjectsIn this observational cross-sectional study, from December 2013 to April 2015 we enrolled 91 MS patients (71 Relapsing Remitting [RRMS], 20 Progressive [PMS]; [38±11] years; M/F=37/54) diagnosed according to 2010 McDonald criteria9 along with a group of 55 age- and sex-comparable healthy controls (HCs – [42±14] years; M/F=28/27). Exclusion criteria included age<18 years and presence of other relevant neurological, psychiatric or systemic conditions that could affect the central nervous system (CNS).
MRI data acquisition and analysis
All MRI exams were performed on the same 3-T scanner (Trio, Siemens Medical Systems, Erlangen, Germany), with an acquisition protocol including an MPRAGE sequence (TR=2500 ms; TE=2.8 ms; TI=900 ms; Flip Angle=9°; resolution =1x1x1 mm3, 176 sagittal slices) and two double-echo FLASH sequences (TR=28 ms; TE1=7.63 ms; TE2=22.14 ms; FAs=2°-20°; voxel size=0.7x0.7x1.3 mm3; 128 axial slices). DGM segmentation was achieved on structural MPRAGE images using the FIRST routine (http://fsl.fmrib.ox.ac.uk/fsl/fslwiki/FIRST) implemented in FSL (version 6.0). QSM and R1 maps were derived from FLASH sequences10. Iron- and myelin-concentration maps were derived by QSM- and R1-maps by inverting an external affine model estimated in a previous ex-vivo MRI-pathology correlation study at 7-T6: $$\textrm{QSM (ppm)}=1.43\cdot10^{-4}\cdot\textrm{Iron (mg/kg[DW])}-6.85\cdot10^{-2}\cdot\textrm{Myelin (MVF[DW])}-2.5\cdot10^{-2}$$ $$R_1\textrm{ (s}^{-1}\textrm{)}=2.23\cdot10^{-4}\cdot\textrm{Iron (mg/kg[DW])}+1.066\cdot\textrm{Myelin (MVF[DW])}-1.132$$ (MVF = Myelin Volume Fraction; DW = Dry Weight).
The R1-map estimated at 3-T was converted into an expected map at 7-T11; susceptibility values were considered independent on magnetic field strength. Iron- and myelin-specific maps for each subject were then shifted by subtracting the corresponding mean CSF values averaged across all subjects (Figure 1).
For each subject, R1 map was coregistered to the MPRAGE image via affine registration, and the corresponding deformation was applied to iron and myelin maps. Segmentation masks were then used to obtain volume and mean iron and myelin values for each DGM structure (Figure 2). In addition, similarly to previous studies8, we computed Iron mass and Myelin mass as measures of total iron and myelin content, respectively, by integrating the concentration maps over each DGM structure and referring the result to a standard intracranial volume.
Statistical analysis
All statistical analyses were carried out using the Statistical Package for Social Science (SPSS v25.0, IBM corp., Armonk, NY), with a significance threshold for test p-values of 0.05. Differences between MS patients and HC in terms of each DGM-structure volume, mean iron and myelin concentrations and total iron and myelin contents were assessed with ANCOVA analyses, correcting for age and sex.
Results
MS patients showed significant atrophy of all DGM structures (p<0.001), with increased iron concentration values in the basal ganglia (p<0.02) and reduced thalamic mean iron (p<0.001). When looking at total iron content, no significant Iron mass difference emerged for any of the basal ganglia structures, while an actual iron depletion was found in the thalamus (p<0.001).Regarding myelin, no significant between-group differences emerged in terms of either mean concentration or global content.
Detailed results of the between-group analyses are reported in Table.
Discussion
In this study, we found in MS patients a higher mean iron concentration in all basal ganglia structures, most likely reflecting atrophy-related concentration increase rather than an actual absolute iron accumulation, which could, in turn, generate a vicious circle contributing to neurodegeneration through iron-related toxicity mechanisms.Conversely, we found a marked reduction of thalamic iron reflecting actual iron depletion phenomena. Indeed, the thalamus has a peculiar morpho-functional architecture, with more abundant WM fibers and a greater iron-rich oligodendrocyte density compared to basal ganglia. Thus, chronic microglial activation occurring in MS may induce thalamic oligodendroglial damage or death, with subsequent iron depletion, reducing axonal protection and neuronal repair and eventually leading to neurodegeneration.
Conclusion
Diffuse alterations of iron metabolism occur in the DGM of MS patients, with an atrophy-related iron concentration in the basal ganglia and active iron depletion phenomena in the thalamus, which may theoretically prove useful as an atrophy-independent disease activity marker.Acknowledgements
No acknowledgement found.References
- Pirko I, Lucchinetti CF, Sriram S, Bakshi R. Gray matter involvement in multiple sclerosis. Neurology 2007;68:634-642.
- Pontillo G, Cocozza S, Lanzillo R, et al. Determinants of Deep Gray Matter Atrophy in Multiple Sclerosis: A Multimodal MRI Study. AJNR Am J Neuroradiol 2019;40:99-106.
- Langkammer C, Schweser F, Krebs N, et al. Quantitative susceptibility mapping (QSM) as a means to measure brain iron? A post mortem validation study. Neuroimage 2012;62:1593-1599.
- Schweser F, Raffaini Duarte Martins AL, Hagemeier J, et al. Mapping of thalamic magnetic susceptibility in multiple sclerosis indicates decreasing iron with disease duration: A proposed mechanistic relationship between inflammation and oligodendrocyte vitality. Neuroimage 2018;167:438-452.
- Zivadinov R, Tavazzi E, Bergsland N, et al. Brain Iron at Quantitative MRI Is Associated with Disability in Multiple Sclerosis. Radiology 2018;289:487-496.
- Stuber C, Morawski M, Schafer A, et al. Myelin and iron concentration in the human brain: a quantitative study of MRI contrast. Neuroimage 2014;93 Pt 1:95-106.
- Moller HE, Bossoni L, Connor JR, et al. Iron, Myelin, and the Brain: Neuroimaging Meets Neurobiology. Trends Neurosci 2019;42:384-401.
- Hernandez-Torres E, Wiggermann V, Machan L, et al. Increased mean R2* in the deep gray matter of multiple sclerosis patients: Have we been measuring atrophy? J Magn Reson Imaging 2019;50:201-208.
- Polman CH, Reingold SC, Banwell B, et al. Diagnostic criteria for multiple sclerosis: 2010 revisions to the McDonald criteria. Ann Neurol 2011;69:292-302.
- Palma G, Tedeschi E, Borrelli P, et al. A Novel Multiparametric Approach to 3D Quantitative MRI of the Brain. PLoS One 2015;10:e0134963.
- Rooney WD, Johnson G, Li X, et al. Magnetic field and tissue dependencies of human brain longitudinal 1H2O relaxation in vivo. Magn Reson Med 2007;57:308-318.
Figures
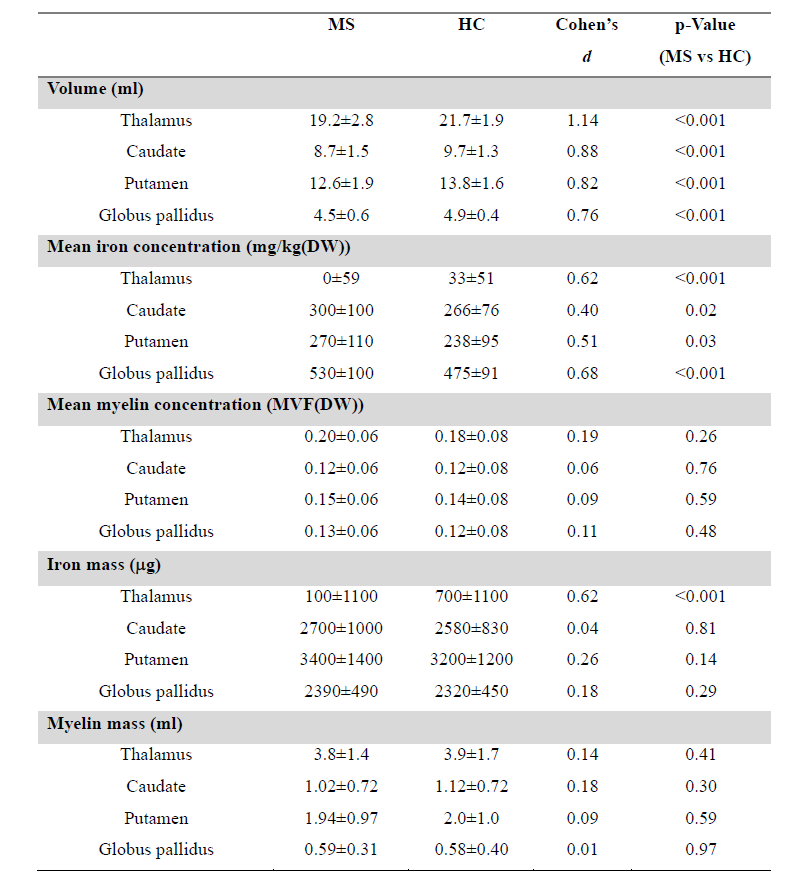
Table. Results of the ANCOVA
analyses for the between-group comparisons.
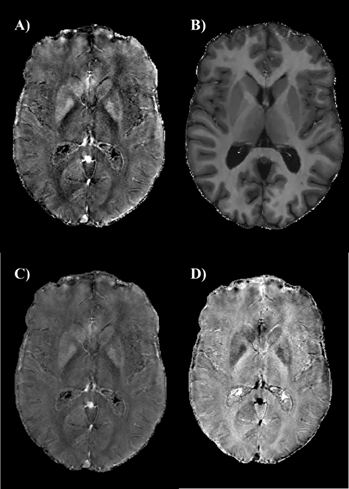
Figure
1. Axial
QSM (A), R1 (B), iron (C) and myelin (D) maps of a 50 years old healthy
subject.
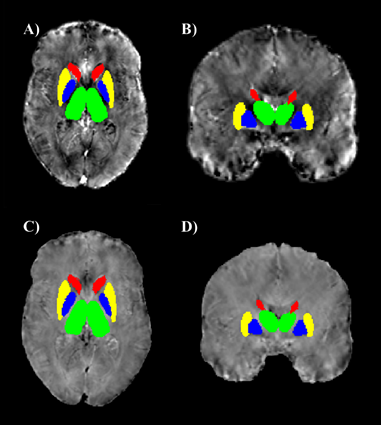
Figure
2. ROIs obtained from the
automatic segmentation of thalamus (green), caudate (red), putamen
(yellow) and pallidum (blue), superimposed on single-subject iron
(A, B) and myelin (C, D) images in the native space.