1381
3T Surface-based quantitative susceptibility mapping and T1 relaxometry in relapsing-remitting and progressive multiple sclerosis patients1Department of Biomedical Engineering, University of Basel, Basel, Switzerland, 2National Institute of Neurological Disordes and Stroke, Bethesda, MD, United States, 3Cornell University, Ithaca, NY, United States
Synopsis
We assessed the presence and extent of cortical abnormalities in patients with relapsing remitting and progressive multiple sclerosis by using surface-based quantitative susceptibility mapping and T1 relaxometry analysis. Our results showed that QSM and T1 maps acquired at 3T MRI are sensitive to cortical damage in MS patients and reveal more extensive areas of alterations in progressive than in relapsing-remitting MS. Changes in cortical QSM and T1 suggest chronic demyelination and possibly iron accumulation.
Introduction
Multiple sclerosis (MS) is a chronic disease of the central nervous system characterized by multifocal and diffuse inflammation and degeneration in both cortical grey and white matter [1-3]. Focal and diffuse cortical damage has been shown in both neuropathological [4] and clinical [5-6] studies. However, there is currently limited knowledge about the extent and distribution of diffuse cortical damage across different MS subtypes. In this work, we investigated whether patients with relapsing remitting MS and progressive MS show different QSM/T1 relaxometry characteristics of the cortical surface, compared to a group of healthy controls. Quantitative susceptibility mapping (QSM) provides maps that are sensitive to iron deposition [7-8] and demyelination [9-10], which are two major and common pathologic features in MS. T1 relaxometry provides an assessment of tissue microstructural integrity [11] and it has shown to be highly sensitive to diffuse white matter pathology in MS patients [12-13]. We hypothesized that the combination of QSM and T1 relaxometry may help the assessment and understanding of cortical pathology in MS patients.Methods
We studied 59 MS patients (43 active-relapsing remitting (-RRMS) and 16 non-active progressive MS-(PMS) patients: Age: RRMS 49 ± 12 and PMS 56 ± 5) and 62 healthy controls (HC), (Age: 37 ± 18). Activity was determined as the presence of 1 relapse or 1 new T2 or Gd+ lesion during the year prior to the study [14]. All subjects underwent multi-parametric 3T magnetic resonance imaging (MRI) (Prisma, Siemens Healthcare, Germany) using a 64-channel head coil. The MRI protocol included: (i) MP2RAGE (TR/TI1/ TI2=5000/700/2500 ms) with 1 mm3 isotropic spatial resolution and 3D EPI (TR/TE/resolution= 64 ms/ 35 ms/0.67*0.67*0.67). T1 relaxometry maps were obtained through the MP2RAGE sequence. QSM maps were obtained as in [15]. Surface mapping of QSM and T1 maps were performed using Freesurfer. Between-groups comparison (RRMS vs HC and PMS vs HC for T1 and QSM cortical maps) was performed using a surface based generalized linear model (GLM) with age as covariate. P< 0.05 were considered as significant. Regions showing significant group differences were identified using the Freesurfer cortical labeling atlas.Results
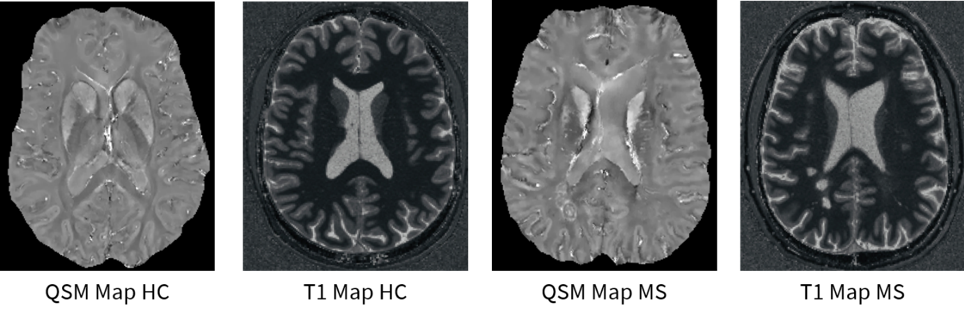
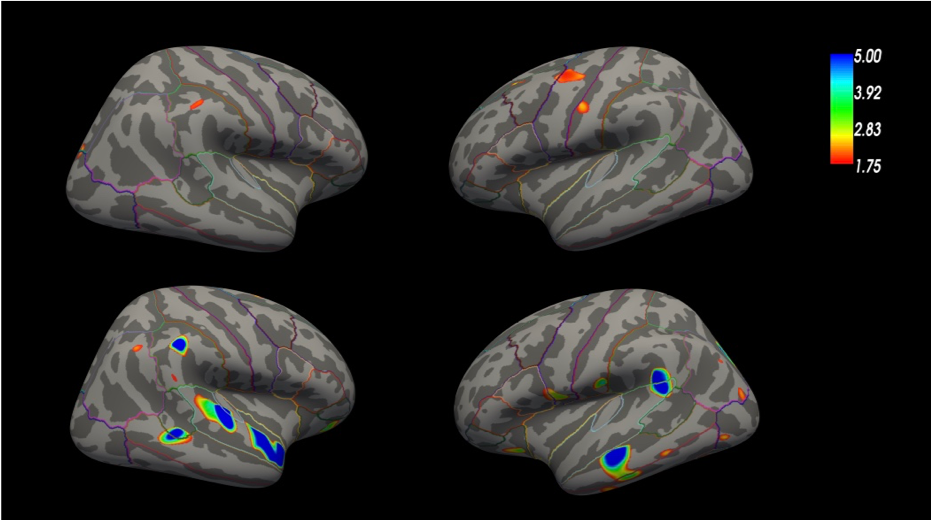
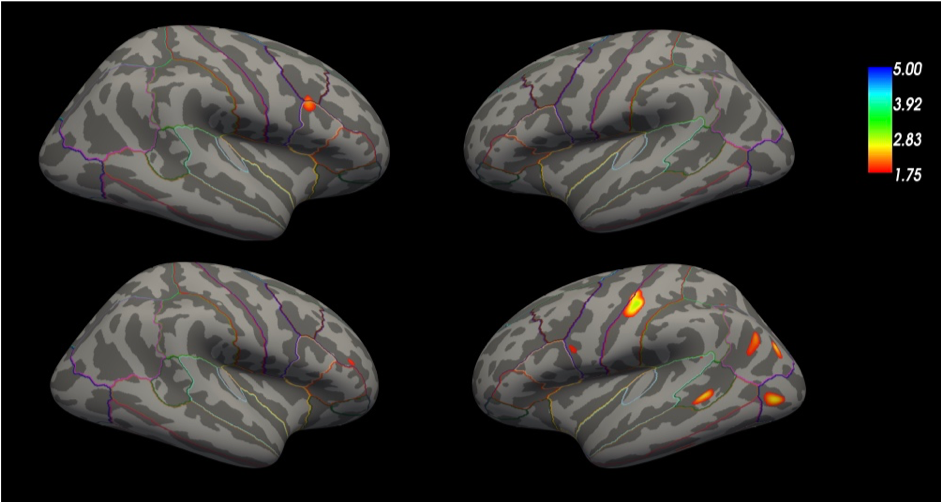
Figure 1 shows an exemplary QSM and T1 relaxometry map in a healthy subject and in a RRMS patient. Figure 2 summarizes the results of the GLM comparison between QSM cortical surface maps in RRMS vs HC and PMS vs HC: QSM values were increased in the motor and sensory cortex of RRMS patient vs HC and in broad areas of the temporal and parietal lobe in PMS vs HC. Figure 3 summarizes the results of the GLM comparison between T1 cortical surface maps in RRMS vs HC and PMS vs HC: T1 relaxation times were slightly increased in the inferior frontal lobe of RRMS patients and showed a more significant increase in the somatosensory area as well as in the occipito-parietal and temporal cortex of PMS patients vs controlsDiscussion
We showed that QSM and T1 maps acquired at 3T MRI are sensitive to cortical damage in MS patients and reveal more extensive areas of alterations in progressive than in relapsing-remitting MS. Both QSM and T1 relaxation times are increased in the cortex of MS patients: this points at an accumulation of damage (i.e. demyelination), which has been previously shown in postmortem studies at advanced disease stages [4] and at ultra-high field MRI in small patient cohorts [16]. The extent of areas of QSM increase is larger than the one measured for T1 increases in both RRMS and PMS patients: this suggests either a higher sensitivity to QSM to cortical damage (i.e. chronic myelin breakdown [17]) in MS or the sensitivity of QSM to other phenomena than demyelination, such as iron accumulation. Iron accumulation in the cortex of MS patients has not been described histo-pathologically to date. But diffuse and focal microglia activation – as measured by C-PBR28 MR-PET – has been reported, which is predominant in progressive MS patients compared to RRMS [18]. Thus, iron accumulation may reflect the presence of activated microglia in the both cortical lesions and normal-appearing grey matter tissue.Conclusion
QSM and T1 relaxometry surface mapping at 3T show patterns compatible with cortical demyelination and – possibly – iron accumulation, which predominate in PMS to RRMS patients.Acknowledgements
This work was funded by the Swiss National Funds PZ00P3_154508, PZ00P3_131914 and PP00P3_176984.
Intramural Research Program of NINDS (USA)
References
References
[1] Lucchinetti C, Brück W, Parisi J, Scheithauer B, Rodriguez M, Lassmann H. Heterogeneity of multiple sclerosis lesions: implications for the pathogenesis of demyelination. Ann Neurol 2000; 47:707-717.
[2] Noseworthy JH, Lucchinetti C, Rodriguez M, Weinshenker BG. Multiple sclerosis. N Engl J Med 2000; 343:938-952.
[3] Lucchinetti CF, Bruck W, Rodriguez M, Lassmann H. Distinct patterns of multiple sclerosis pathology indicates heterogeneity on pathogenesis. Brain Pathol 1996; 6:259-274.
[4] Kutzelnigg A, Lucchinetti CF, Stadelmann C, Brück W, Rauschka H, Bergmann M, et al. Cortical demyelination and diffuse white matter injury in multiple sclerosis. Brain. 2005 Nov;128(Pt 11):2705–12.
[5] Calabrese M, Magliozzi R, Ciccarelli O, Geurts JJG, Reynolds R, Martin R. Exploring the origins of grey matter damage in multiple sclerosis. Nat Rev Neurosci. 2015 Mar;16(3):147–58.
[6] Calabrese M, Filippi M, Gallo P. Cortical lesions in multiple sclerosis. Nat Rev Neurol. 2010 Aug;6(8):438–44.
[7] Bagnato F, Hametner S, Yao B, van Gelderen P, Merkle H, Cantor FK, et al. Tracking iron in multiple sclerosis: a combined imaging and histopathological study at 7 Tesla. Brain. 2011 Dec;134(Pt 12):3602–15.
[8] Walsh AJ, Lebel RM, Eissa A, Blevins G, Catz I, Lu J-Q, et al. Multiple sclerosis: validation of MR imaging for quantification and detection of iron. Radiology. 2013 May;267(2):531–42.
[9] Yablonskiy DA, Luo J, Sukstanskii AL, Iyer A, Cross AH. Biophysical mechanisms of MRI signal frequency contrast in multiple sclerosis. Proc Natl Acad Sci USA. 2012 Aug 28;109(35):14212–7.
[10] Chen W, Gauthier SA, Gupta A, Comunale J, Liu T, Wang S, et al. Quantitative Susceptibility Mapping of Multiple Sclerosis Lesions at Various Ages. Radiology [Internet]. 2014 Apr [cited 2019 Nov 6];271(1):183–92. Available from: https://www.ncbi.nlm.nih.gov/pmc/articles/PMC4263629/
[11] Deoni SCL. Quantitative relaxometry of the brain. Top Magn Reson Imaging. 2010 Apr;21(2):101–13. [12] Bonnier G, Fischi-Gomez E, Roche A, Hilbert T, Kober T, Krueger G, et al. Personalized pathology maps to quantify diffuse and focal brain damage. Neuroimage Clin. 2019;21:101607.
[13] Piredda GF, Hilbert T, Granziera C, Bonnier G, Meuli R, Molinari F, et al. Quantitative brain relaxation atlases for personalized detection and characterization of brain pathology. Magn Reson Med. 2020 Jan;83(1):337–51.
[14] Lublin FD, Reingold SC, Cohen JA, Cutter GR, Sørensen PS, Thompson AJ, et al. Defining the clinical course of multiple sclerosis: the 2013 revisions. Neurology. 2014 Jul 15;83(3):278–86.
[15] Spincemaille P, Liu Z, Zhang S, Kovanlikaya I, Ippoliti M, Makowski M, et al. Clinical Integration of Automated Processing for Brain Quantitative Susceptibility Mapping: Multi-Site Reproducibility and Single-Site Robustness. Journal of Neuroimaging [Internet]. 2019 [cited 2019 Nov 6];29(6):689–98. Available from: https://onlinelibrary.wiley.com/doi/abs/10.1111/jon.12658
[16] Mainero C, Louapre C, Govindarajan ST, Giannì C, Nielsen AS, Cohen-Adad J, et al. A gradient in cortical pathology in multiple sclerosis by in vivo quantitative 7 T imaging. Brain. 2015 Apr;138(Pt 4):932–45.
[17] Zhang Y, Gauthier SA, Gupta A, Chen W, Comunale J, Chiang GC-Y, et al. QSM and R2* measured changes during white matter lesion development in multiple sclerosis: myelin breaking down, myelin debris degradation and removal, and iron accumulation. AJNR Am J Neuroradiol [Internet]. 2016 Sep [cited 2019 Nov 6];37(9):1629–35. Available from: https://www.ncbi.nlm.nih.gov/pmc/articles/PMC5018433/
[18] Herranz E, Giannì C, Louapre C, Treaba CA, Govindarajan ST, Ouellette R, et al. Neuroinflammatory component of gray matter pathology in multiple sclerosis. Ann Neurol. 2016 Nov;80(5):776–90.
Figures