1380
Direct and inverse relations in default mode network detected by functional and structural substrate of cognition in mild Relapsing Remitting MS.1Institut für Neuroimmunologie und Multiple Sklerose (INIMS), Universitätsklinikum Hamburg-Eppendorf, Hamburg, Germany, 2Klinik und Poliklinik für Neurologie, Universitätsklinikum Hamburg-Eppendorf, Hamburg, Germany, 3Klinik für Neurologie, Heinrich Heine Universität Düsseldorf, Düsseldorf, Germany, 4Zentrum für Angewandte Neurokognition und Neuropsychologische Forschung, Heinrich-Heine-Universität Düsseldorf, Düsseldorf, Germany, 5Institut für Neurophysiologie und Pathophysiologie, Universitätsklinikum Hamburg-Eppendorf, Hamburg, Germany, 6Charité - Universitätsmedizin Berlin, Freie Universität Berlin, Humboldt Universität zu Berlin, and Berlin Institute of Health (BIH), Klinik für Psychiatrie & Psychotherapie und Medizinische Klinik m.S. Psychosomatik, Campus Benjamin Franklin (CBF), Berlin, Germany, 7CRMBM AMU-CNRS , Marseille, France, Marseille, France, 8CEMEREM, APHM, CHU Timone, Marseille France, Marseille, France
Synopsis
We utilized an approach combining DTI, RS-fMRI and graph-theory to characterize the relation between cognitive profiles and global and local network features in RRMS patients with mild to moderate disability. Closer association of structural network metrics with cognitive abilities were seen compared to standard-MRI outcomes and an interesting pattern of associations with a slight predominance of nodes located in the default mode network (DMN). While structural connectivity always showed a positive correlation with performance, the number of functional connections of nodes was mostly negatively correlated. DMN had inverse and direct relationships with memory, possible indicating adaptive and maladaptive mechanisms.
Purpose
Multiple Sclerosis (MS), which is a chronic inflammatory and neurodegenerative disease of the central nervous system (CNS), can lead to severe cognitive impairment over time1. To track MS pathophysiology and its relation with clinical disability, magnetic resonance imaging (MRI) is one of the best biomarker2. However, it is limited to detect direct associations between symptoms and their underlying CNS substrates by conventional MRI. In this study, we aimed to provide a comprehensive exploration of the association between neuropsychological (NP) performance and both structural and functional networks within global and nodal levels using graph theory in mildly disabled relapsing remitting MS (RRMS) patients compared to healthy controls (HC).Method
IRB was taken and all participants gave signed informed consent form.A comprehensive NP test battery that included 20 different cognition tests was administered in mildly disabled RRMS [n=33, F/M=20/13, age=40.9±9.7, median [Expanded Disability Status Scale] (EDSS) = 2, range=0-4] and compared to closely matched (age, sex and education level) HC [n=29, F/M=19/10, age=41.0±8.5] (p>0.05).
MRI Protocol: Diffusion tensor imaging (DTI) (single shell, 32 independent direction, b=1000s/mm2, TR/TE=7200ms/90ms; voxel size=1.9×1.9×2.0 mm, FOV=240mm, matrix=128x128, 54 axial sections, no gap) and resting state (RS) functional MRI (fMRI) [T2*-weighted (W) BOLD-sensitized echo planer imaging sequence (TR/TE=2500ms/25ms; TI=900ms; 40 slices, voxel size=2.7×2.7×3.0 mm, no gap, matrix=256x256, FOV=250mm, FA=90°, measurements=250) were applied to all subjects on a 3T MRI (Siemens/Prisma). 3D T1W-MPRAGE (TR/TE=2500ms/2.12ms; TI=1100ms; 256 slices, voxel size=0.8×0.8×0.9 mm, no gap, matrix=288x288, FOV = 240mm) and T2-W (TR/TE = 2800ms/90ms; 43 slices, voxel size 0.5×0.5×3.0 mm, no gap, matrix=256x256, FOV = 240mm) sequences were also obtained. Neurological assessments [EDSS3, the 9-Hole Peg Test (NHPT)4,5, and the Timed-25 food walk (T25FW)] and NP test battery were applied in the same week with MRI assessment.
Data Processing and Analysis: MRITRIX36 was used to extract structural connectivity based on probabilistic tractography as described in Beeson et al7. Individual functional networks were constructed based on wavelet correlation from resting state time series as described8. To avoid the possible segmentation errors hypo-intense lesion were filled on T1W images. Then, an automated procedure for the volume and thickness measurement was performed for each subject using Freesurfer9. Segmentation correction was done manually, and volumes were normalized by intracranial brain volume for each subject. Finally, gray-matter parcellation of 80 regions (total=160) for each hemisphere was specified based on the Destrieux atlas (2009)10 to perform the structural and functional connectivity analysis. The location of each node in one of seven functional networks (Yeo atlas) was determined on the FreeSurfer fsaverage11. As, graph metrics, we computed nodal strength (i.e. the sum of edge weights in each node) for structural connectivity and nodal degree (i.e. the sum of connections per node in each node) for functional connectivity. The analyses were performed with statistics in R 3.2.3, including the igraph12 and tnet13 packages. To investigate hub disruption based on the continuum of network hierarchy14, group (RRMS and HC) level statistical analysis of hub disruption were performed using linear mixed effects regression (LMER)15. The false discovery rate adjustment (FDR) was applied.
Results
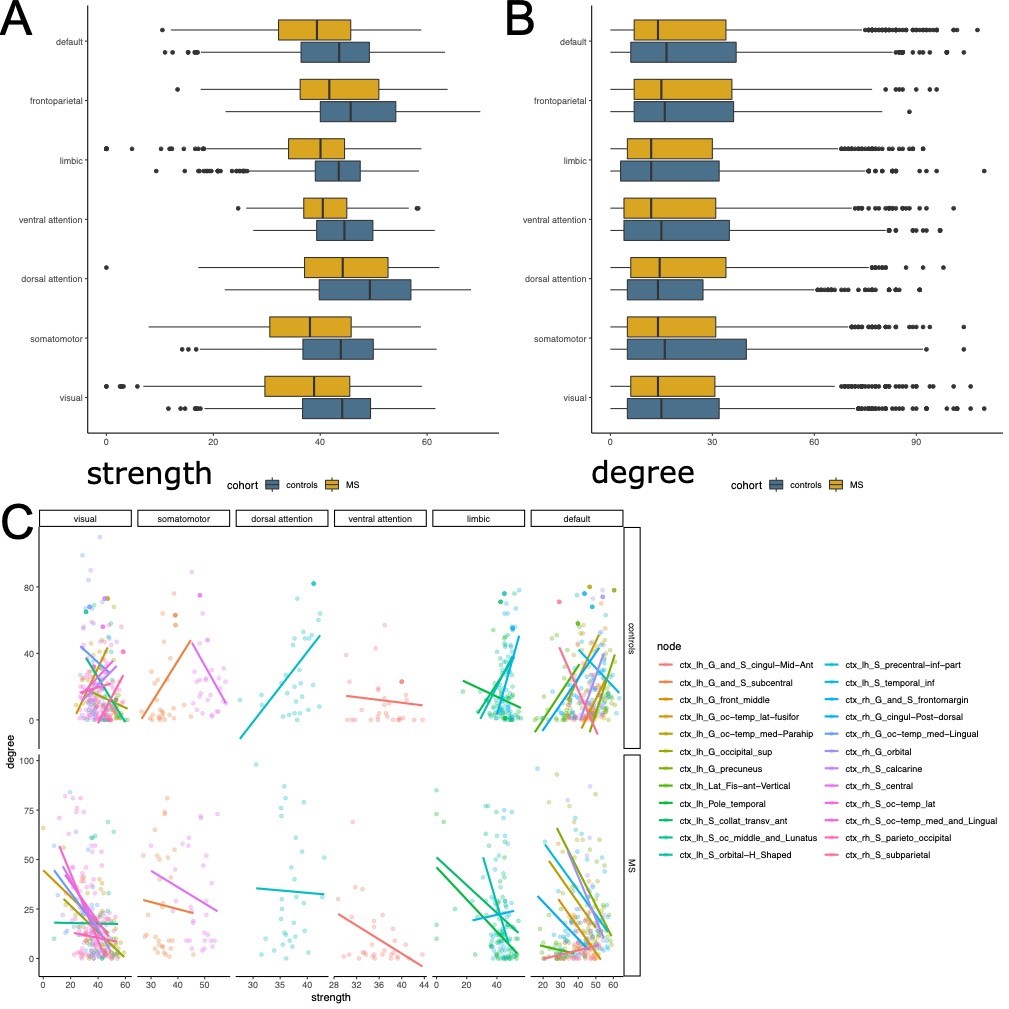
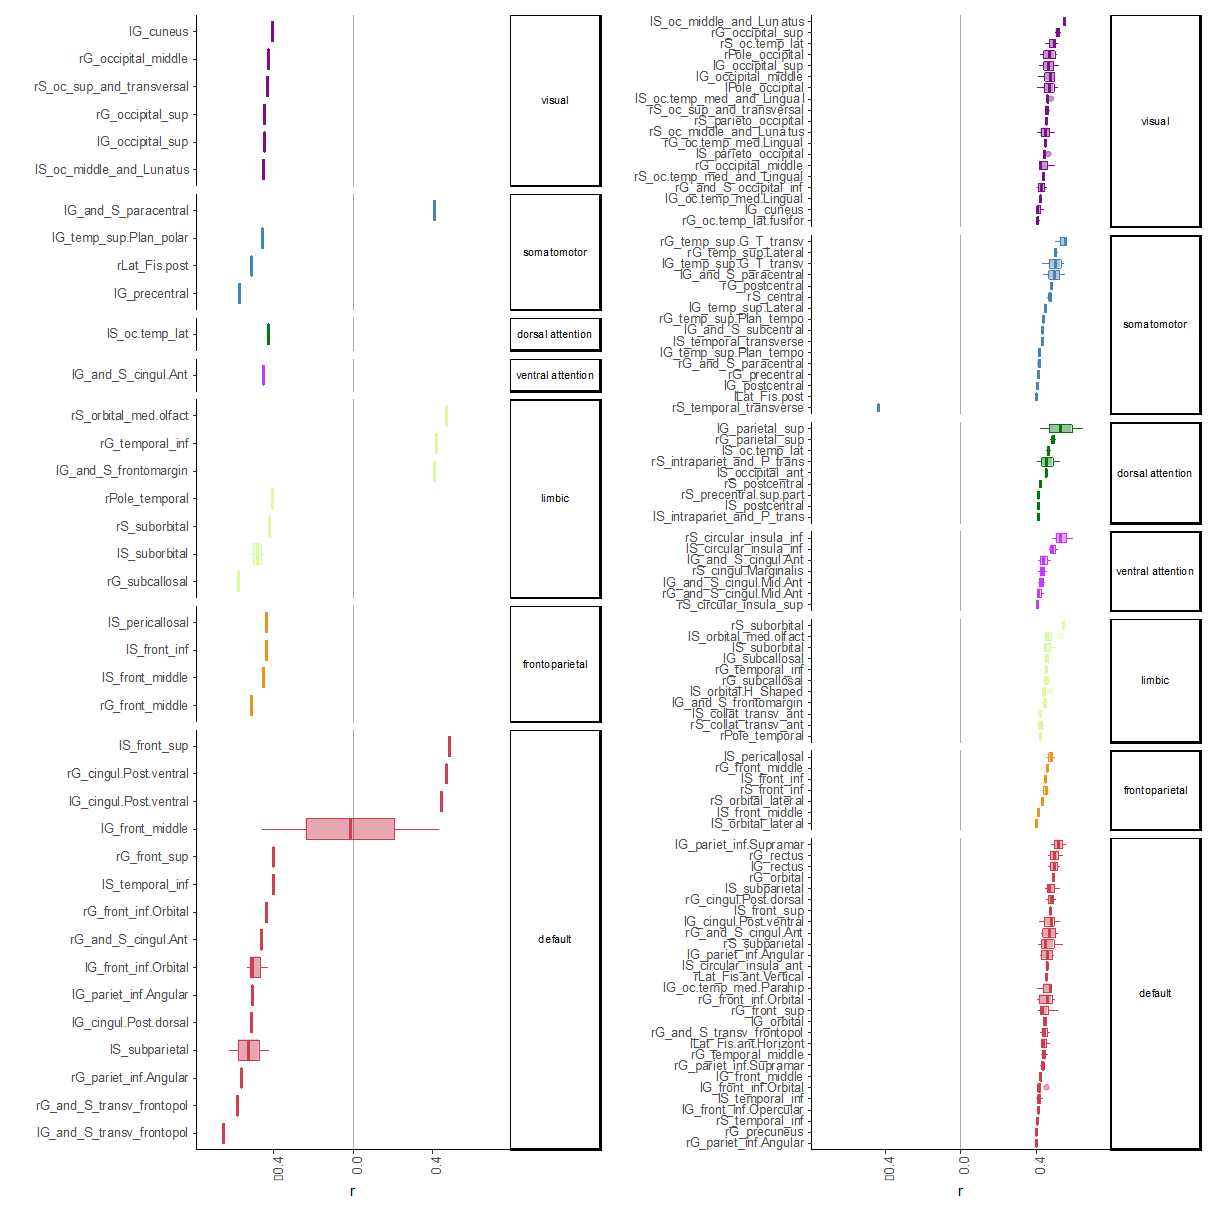
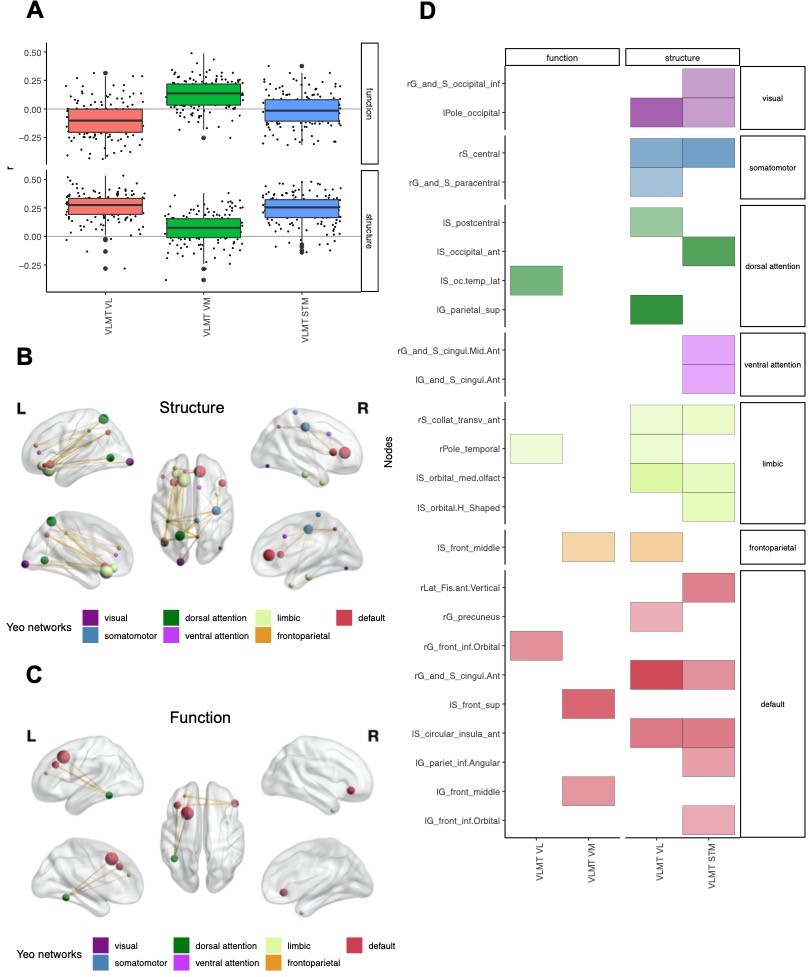
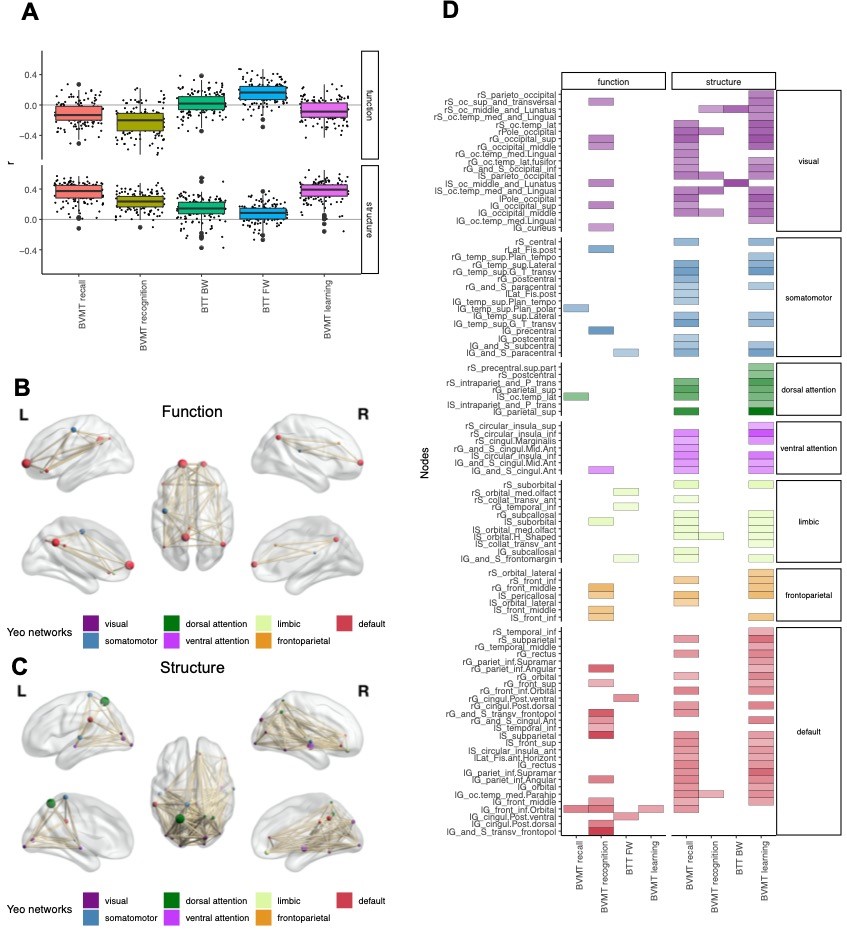
Global graph strength was decreased in RRMS compared to HC (p<0.001, FDR corrected); however, there was no changed in global degree. The NP battery was comprised as attention, processing speed, verbal and spatial learning and memory, and executive function. While standard MRI metrics (e.g. brain parenchymal fraction or lesion load) showed correlations with disease duration (p=0.001), neurological exams (pEDSS = 0.003, pT25FW <0.001), and TAP Alertness test (p = 0.04), structural network showed broader associations with cognition (Table 1) on global level. Decreased global graph strength was related with spatial memory specified by BVMT [Sum 1-3] and BVMT [Recall], and with the processing speed specified by SDMT (p<0.05, FDR corrected), while there was no association between these scores and functional connectivity (Table 1). Nodal structural connectivity was decreased in all subnetworks based on Yeo atlas in patients compared to HC (p<0.001) (Figure 1A); however, there was no difference in nodal level of functional connectivity between the groups (Figure 1B). In addition, nodal structural and functional connectivity had inverse relationship mainly in visual and default mode network (DMN)s in patients, while it was positive in controls (Figure 1C). Interestingly, poorer cognitive performance was mostly correlated with higher functional connectivity but lower structural connectivity in patients (Figure 2). Notable, higher functional connectivity in DMN had both positive as well as negative associations with memory (Figure 3) and spatial memory (Figure 4).Discussion and Conclusion
Cognitive performance in early RRMS is related to a widespread disruption of structural connectivity. In contrast, functional connectivity shows overall a putative maladaptive profile such as higher connectivity indicated poorer performance. However, the coexistence of positive and negative associations with memory and spatial memory in DMN indicates a more complex and heterogenous pattern of adaptive and maladaptive mechanisms. A longitudinal study with a wide spectrum of clinical disabilities assessed by weighted networks would be more useful to see the pattern of cognition within the long term of the same cohort, and as well as the transition of MS cohorts. In particular, assessment of dynamic change might give new insights in the mechanisms behind the imbalanced associations in the DMN.Acknowledgements
This research received funding from the NEUCONN grant which is supported by German Federal Ministry of Education and Research (grant number 161A130).References
1. Filippi M, Bar-Or A, Piehl F, et al. Multiple sclerosis. Nat Rev Dis Prim. 2018;4(1):43. doi:10.1038/s41572-018-0041-4
2. Fox MD. Mapping Symptoms to Brain Networks with the Human Connectome. N Engl J Med. 2018;379(23):2237-2245. doi:10.1056/NEJMra1706158
3. Kurtzke JF. Rating neurologic impairment in multiple sclerosis: an expanded disability status scale (EDSS). Neurology. 1983;33(11):1444-1452. http://www.ncbi.nlm.nih.gov/pubmed/6685237. Accessed November 13, 2018.
4. Backman C, Cork S, Gibson D, Parsons J. full-text. Can J Occup Ther. 1992;59(4):208-213.
5. Chan T. An Investigation of Finger and Manual Dexterity. Percept Mot Skills. 2000;90(2):537-542. doi:10.2466/pms.2000.90.2.537
6. Tournier J-D, Smith R, Raffelt D, et al. MRtrix3: A fast, flexible and open software framework for medical image processing and visualisation. Neuroimage. 2019;202:116137. doi:10.1016/J.NEUROIMAGE.2019.116137
7. Besson P, Dinkelacker V, Valabregue R, et al. Structural connectivity differences in left and right temporal lobe epilepsy. Neuroimage. 2014;100:135-144. doi:10.1016/j.neuroimage.2014.04.071
8. Wirsich J, Perry A, Ridley B, et al. Whole-brain analytic measures of network communication reveal increased structure-function correlation in right temporal lobe epilepsy. NeuroImage Clin. 2016;11:707-718. doi:10.1016/J.NICL.2016.05.010
9. Fischl B, Salat DH, Busa E, et al. Whole brain segmentation: automated labeling of neuroanatomical structures in the human brain. Neuron. 2002;33(3):341-355. http://www.ncbi.nlm.nih.gov/pubmed/11832223. Accessed November 13, 2018.
10. Destrieux C, Fischl B, Dale A, Halgren E. Automatic parcellation of human cortical gyri and sulci using standard anatomical nomenclature. Neuroimage. 2010;53(1):1-15. doi:10.1016/j.neuroimage.2010.06.010
11. Thomas Yeo BT, Krienen FM, Sepulcre J, et al. The organization of the human cerebral cortex estimated by intrinsic functional connectivity. J Neurophysiol. 2011;106(3):1125-1165. doi:10.1152/jn.00338.2011
12. Csárdi G, Nepusz T. The Igraph Software Package for Complex Network Research. https://pdfs.semanticscholar.org/1d27/44b83519657f5f2610698a8ddd177ced4f5c.pdf. Accessed June 19, 2019.
13. Opsahl T. Structure and Evolution of Weighted Networks. 2009. https://ethos.bl.uk/OrderDetails.do;jsessionid=652A420A33195813CEE0717B838DAA3A?uin=uk.bl.ethos.507253. Accessed November 13, 2018.
14. Achard S, Delon-Martin C, Vértes PE, et al. Hubs of brain functional networks are radically reorganized in comatose patients. Proc Natl Acad Sci U S A. 2012;109(50):20608-20613. doi:10.1073/pnas.1208933109
15. Bates D, Mächler M, Bolker B, Walker S. Fitting Linear Mixed-Effects Models Using lme4. J Stat Softw. 2015;67(1):1-48. doi:10.18637/jss.v067.i01
Figures
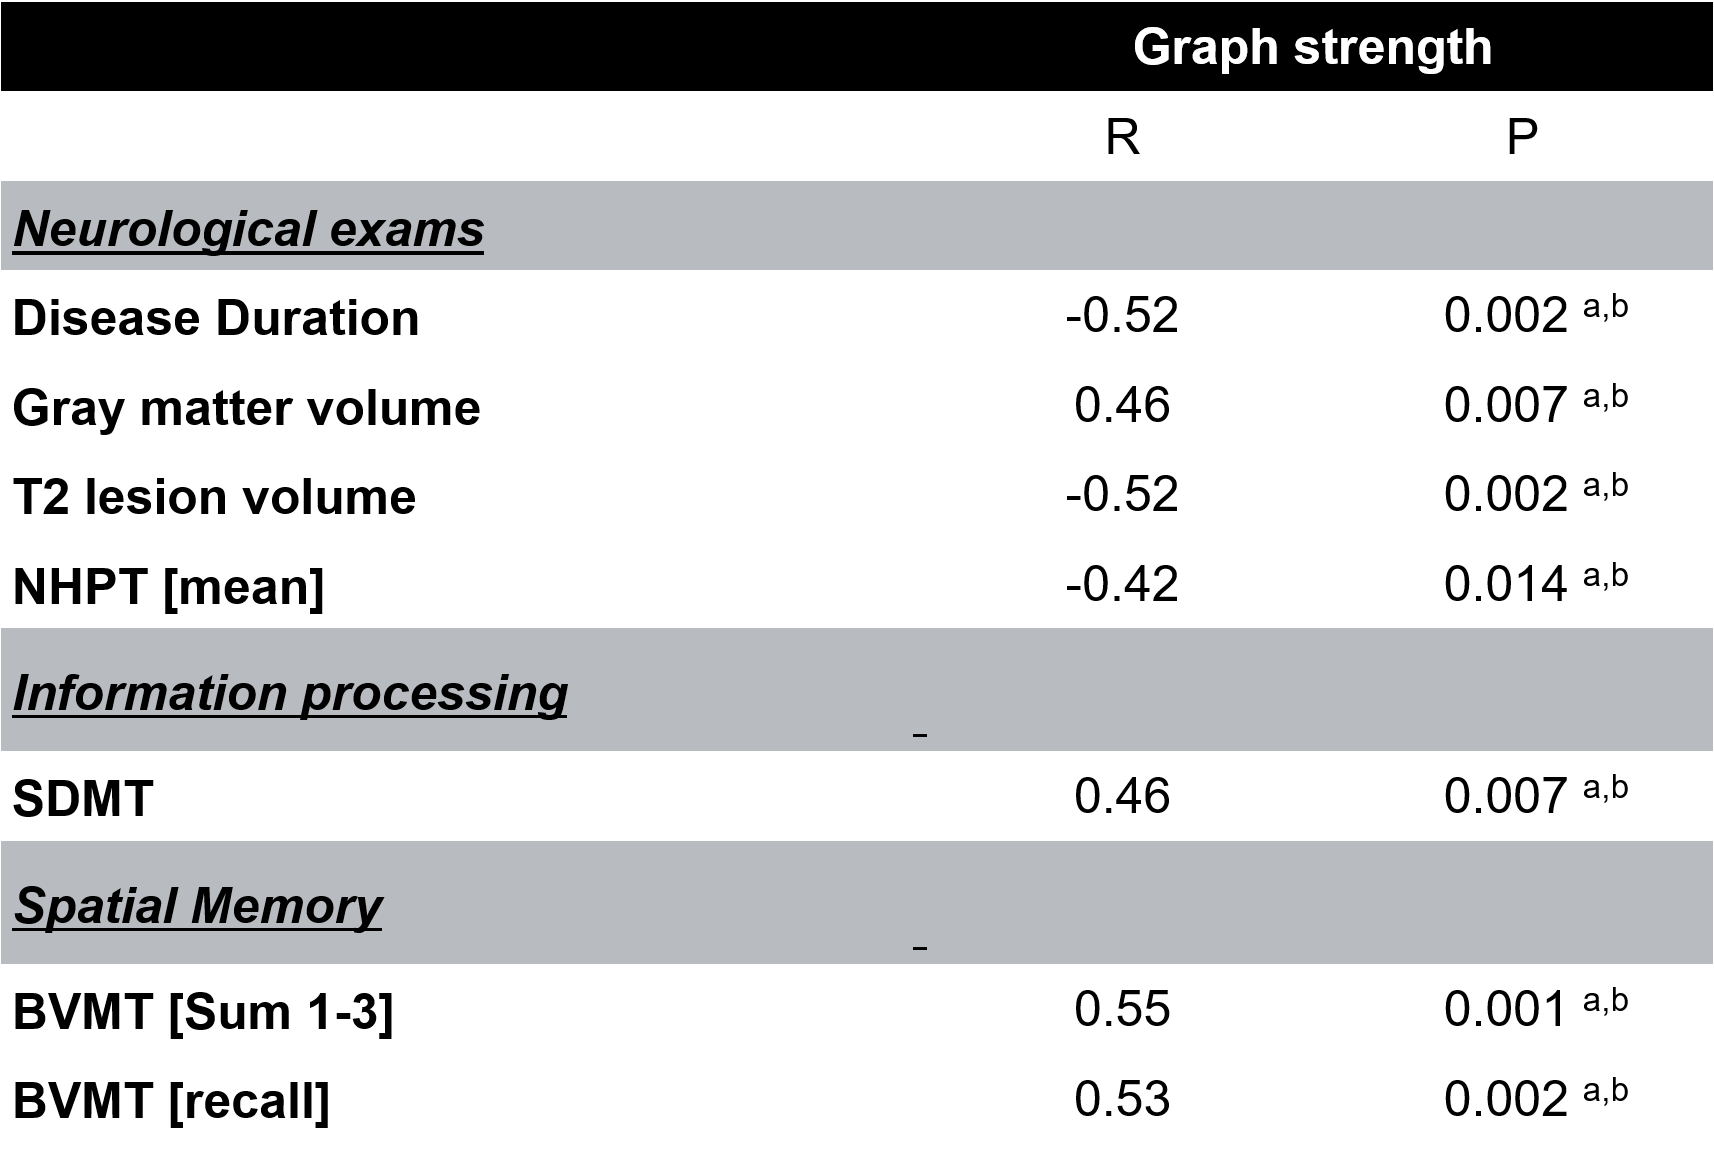
Table 1. Correlations between structural global graph strength and MRI volumes, neurological ratings data and neuropsychological tests in patients (only significant correlations are demonstrated).
a p Values below 0.05.b False discovery rate–corrected p values below 0.05.