1379
Characterizing dynamic functional connectivity in the main clinical phenotypes of multiple sclerosis
Paola Valsasina1, Milagros Hidalgo de la Cruz1, Francesca Sangalli2, Federica Esposito2, Massimo Filippi1,2,3, and Maria A. Rocca1,2
1Neuroimaging Research Unit, Institute of Experimental Neurology, Division of Neuroscience, IRCCS San Raffaele Scientific Institute, Milan, Italy, 2Neurology Unit, IRCCS San Raffaele Scientific Institute, Milan, Italy, 3Vita-Salute San Raffaele University, Milan, Italy
1Neuroimaging Research Unit, Institute of Experimental Neurology, Division of Neuroscience, IRCCS San Raffaele Scientific Institute, Milan, Italy, 2Neurology Unit, IRCCS San Raffaele Scientific Institute, Milan, Italy, 3Vita-Salute San Raffaele University, Milan, Italy
Synopsis
In this study, we used dynamic functional connectivity (dFC) to characterize time-varying connectivity abnormalities in patients with multiple sclerosis (MS) with the main disease phenotypes. Compared to controls, MS patients presented overall dFC reduction in all networks, along with increased dFC in sensorimotor, default-mode and frontal/attention networks. While progressive MS showed additional dFC decrease vs relapsing-remitting (RR) MS, in benign MS the overall reduction of dFC was accompanied by significantly increased dFC in the sensorimotor, default-mode and frontal/attention networks. Reduced dFC correlated with more severe clinical disability and worse cognitive performance.
Introduction
Dynamic functional connectivity (dFC) is a novel analysis technique that measures temporal resting state (RS) functional connectivity (FC) fluctuations occurring during the course of functional MRI (fMRI) acquisition [1]. To date, RS dFC has been widely applied to neurodegenerative and psychiatric conditions [2], but a comprehensive description of RS dFC abnormalities across the different stages of multiple sclerosis (MS) has not been performed. Aim of this study was to investigate RS dFC abnormalities in the main clinical phenotypes of MS.Methods
RS fMRI data were acquired from 128 MS patients (53 relapsing remitting [RR] MS, 16 benign [B] MS, 34 secondary progressive [SP] MS, 25 primary progressive [PP] MS), and 40 healthy controls (HC). Forty-two relevant independent components were identified and assigned to sensorimotor, default-mode, frontal/attention, salience, executive, visual, temporal/auditory, and cerebellar networks (Figure 1). dFC properties were assessed using sliding windows correlations and grouping FC matrices into recurrent states (hard-clustering analysis) [3]. Between-group dFC differences and correlations between dFC abnormalities and motor and cognitive performances were assessed.Results
Hard-clustering analysis revealed 3 dFC states in HC and MS patients: State 1 (frequency=57%, low dFC strength), State 2 (frequency=19%, middle-high dFC strength), and State 3 (frequency=24%, high dFC strength within sensorimotor and visual networks) (Figure 2). MS patients showed overall dFC reduction in all States vs HC, along with increased dFC in sensorimotor and default-mode networks in State 2, and increased dFC in the frontal/attention network in State 3 (Figure 3). Similar findings were detected when comparing PPMS and RRMS patients vs HC, and SPMS vs RRMS patients (Figure 4). In BMS vs RRMS patients, the overall reduction of dFC was accompanied by significantly increased dFC in the sensorimotor, default-mode and frontal/attention networks in State 1 (Figure 5). In MS patients, reduced dFC in State 1 and increased dFC in States 2 and 3 of sensorimotor, default-mode and frontal/attention networks correlated with more severe motor disability and worse cognitive impairment (r=range 0.19-0.31, p=range <0.001-0.05).Discussion
In this study, we described the existence of RS dFC abnormalities that helped to characterize the different clinical phenotypes of MS, while helping to explain more severe clinical disability, and worse motor and cognitive performances. RS dFC approach may contribute to identify brain areas in which neuroprotection/neurorehabilitation therapies might be applied, mainly in the progressive phase of the disease.Conclusions
Significant dFC abnormalities, mainly in sensorimotor and cognitive networks, contributed to explain MS phenotypic heterogeneity, clinical disability and cognitive impairment, suggesting the presence of maladaptive responses in progressive MS patients and compensatory mechanisms in BMS.Acknowledgements
Partially supported by Fondazione Italiana Sclerosi Multipla (FISM2018/S/3).References
[1] Calhoun VD et al,. Neuron 2014; 84: 262-74. [2] Damaraju E et al,. Neuroimage: clinical 2014;24: 298-308. [3] Allen E et al,. Cereb Cortex 2014;24: 663-676.Figures
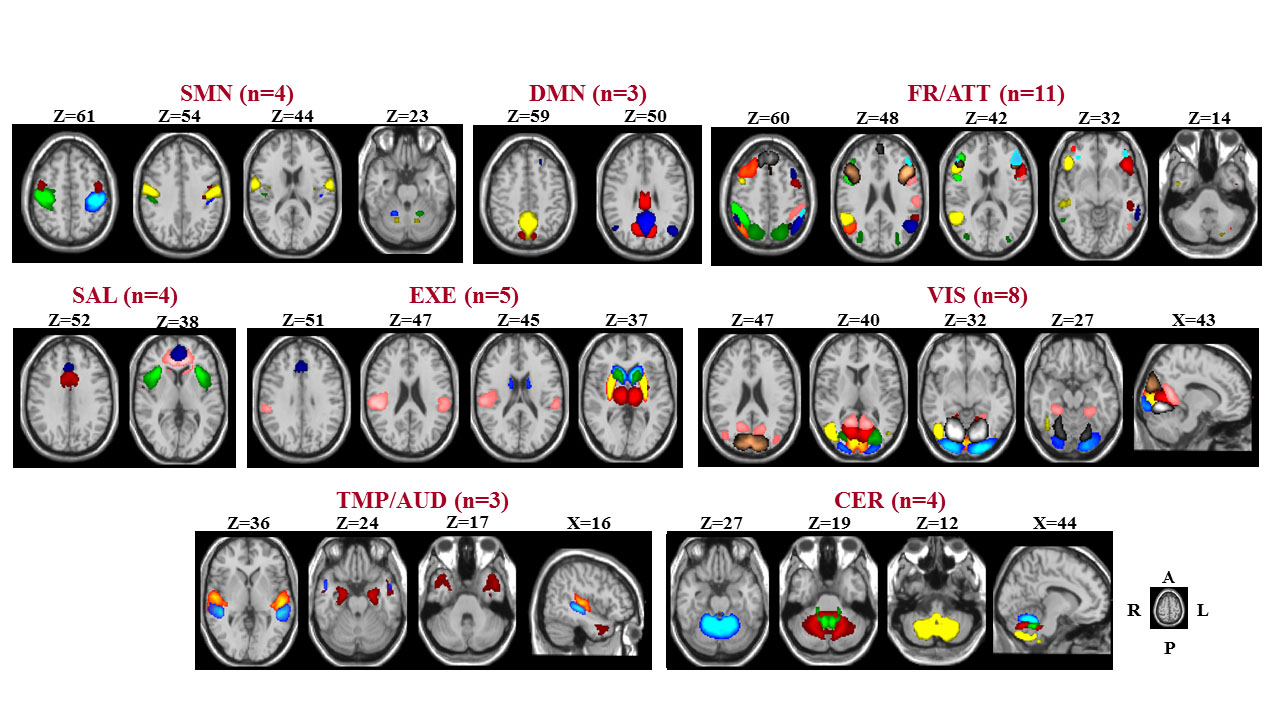
Figure 1. Composite map of the
42 relevant independent component of interest after the selection procedure.
SMN=sensorimotor network; DMN=default mode network; FR/ATT=frontal/attention
network; EXE=executive control network; VIS=visual network;
TMP/AUD=temporal/auditory network; CER=cerebellar network.
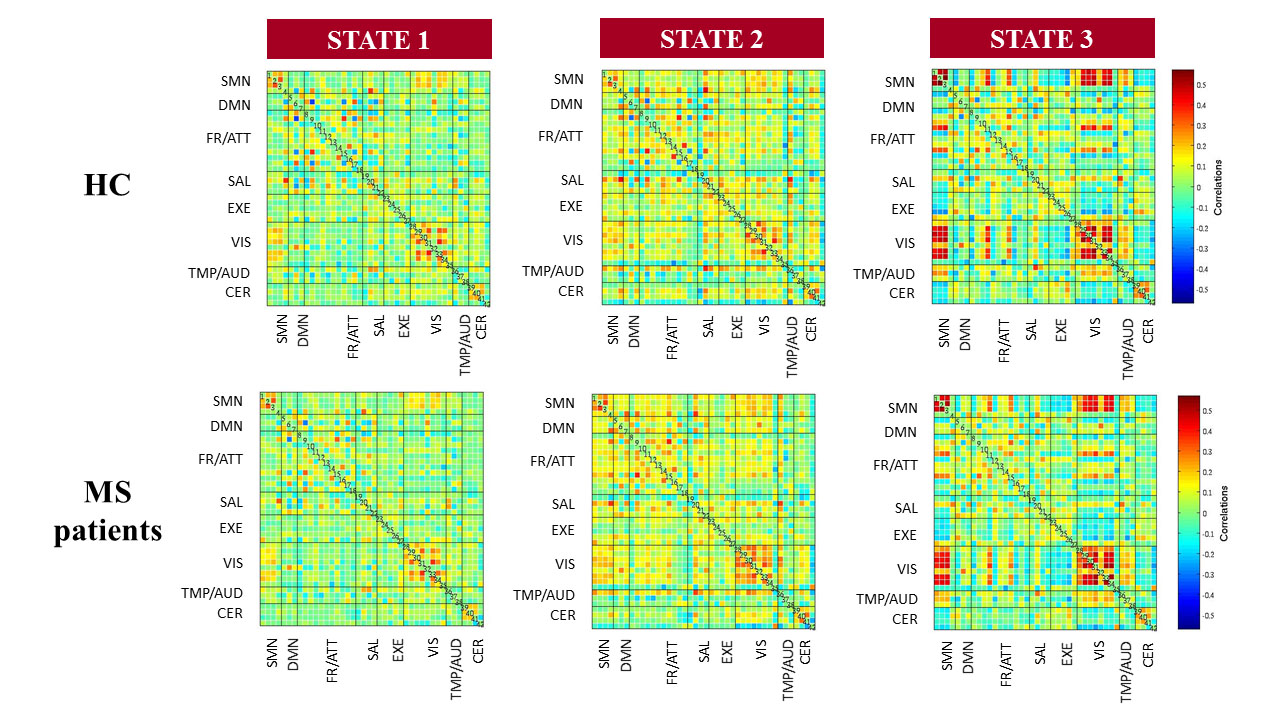
Figure 2. Connectivity matrices
of the three dynamic functional connectivity recurring States detected in
healthy controls (HC) and patients with multiple sclerosis (MS).

Figure 3. Comparison of
element-wise dynamic functional connectivity (dFC) strength between healthy
controls (HC) and patients with multiple sclerosis (MS). Blue boxes=decreased
dFC in MS vs HC; red boxes=increased
dFC in MS vs HC.
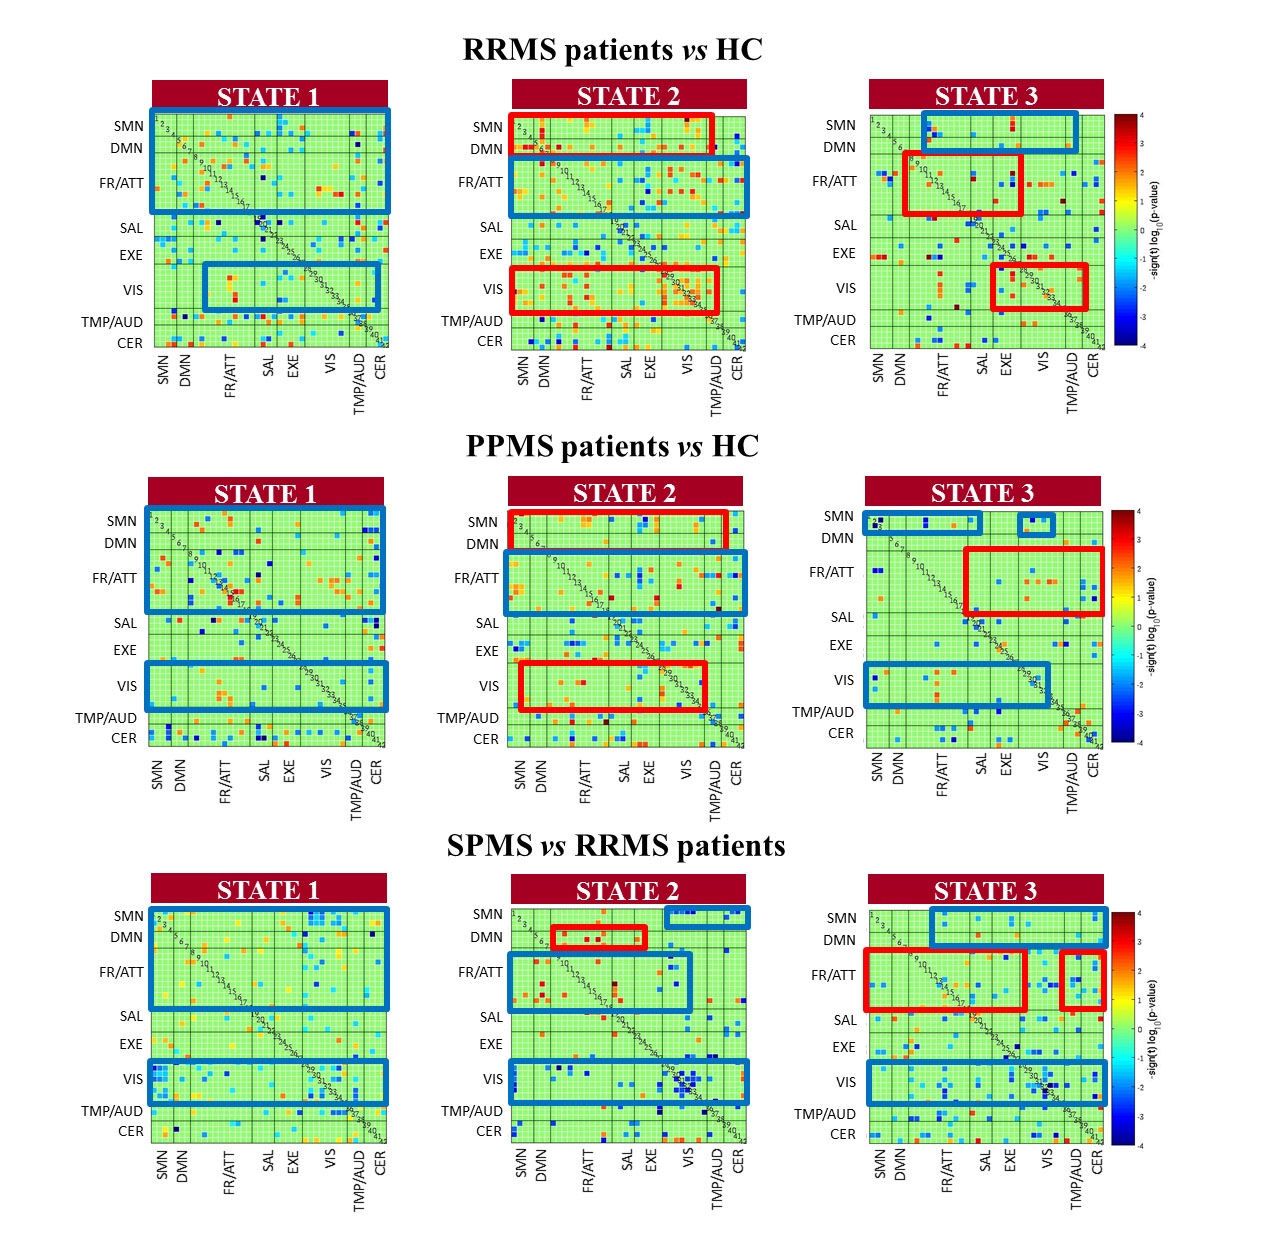
Figure 4. Comparison of
element-wise dynamic functional connectivity (dFC) strength among healthy
controls (HC) and patients with multiple sclerosis (MS) and different
phenotypes. RRMS=relapsing-remitting multiple sclerosis; SPMS=secondary
progressive multiple sclerosis. Blue boxes=decreased dFC; red boxes=increased
dFC.
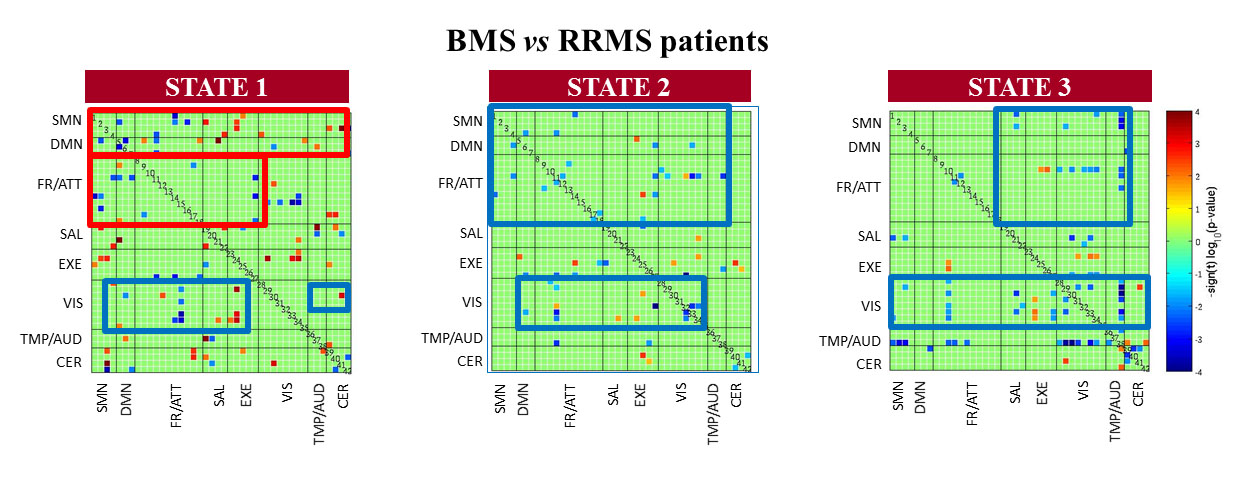
Figure 5. Comparison of
element-wise dynamic functional connectivity (dFC) between benign (B) and
relapsing-remitting (RR) patients with multiple sclerosis (MS). Blue
boxes=decreased dFC in BMS vs RRMS; red
boxes=increased dFC in BMS vs RRMS.