1375
Gray Matter Alterations in Multiple Sclerosis and Neuromyelitis Optica Spectrum Disorders Evaluated Using Multimodal Neuroimaging Techniques1Department of Radiology, Juntendo University Graduate School of Medicine, Tokyo, Japan, 2Department of Radiology, David Geffen School of Medicine at UCLA, Los Angeles, CA, United States, 3Department of Radiology, Graduate School of Medicine, The University of Tokyo, Tokyo, Japan, 4Department of Neurology, Juntendo University School of Medicine, Tokyo, Japan, 5Department of Radiological Sciences, Graduate School of Human Health Sciences, Tokyo Metropolitan University, Tokyo, Japan, 6Department of Radiology, Toho University Omori Medical Center, Tokyo, Japan
Synopsis
Multiple sclerosis (MS) shares similar clinical and imaging characteristics with neuromyelitis optica spectrum disorders (NMOSD), but a correct diagnosis is essential as treatment options differ considerably. We applied diffusion tensor imaging, neurite orientation dispersion and density imaging, and synthetic quantitative MRI to assess the gray matter (GM) of relapsing-remitting MS (RRMS) and NMOSD patients. Our results demonstrated that multimodal neuroimaging techniques of the GM might be useful for differentiating NMOSD from RRMS, where NMOSD spares most of the GM. In contrast, RRMS group demonstrated extensive demyelination, circumscribed axonal loss predominantly in the limbic areas, and broad neuroinflammation in the cerebellum.
INTRODUCTION
Multiple sclerosis (MS) shares similar clinical and imaging characteristics with neuromyelitis optica spectrum disorders (NMOSD), but a correct diagnosis is essential for managing patients as treatment options differ considerably. Currently, renewed interest in the pathology of gray matter (GM) is emerging in MS and NMOSD. GM pathology in MS and NMOSD may differ in the degree of demyelination, axonal degeneration, and neuroinflammation in the brain;1 thus further investigations are warranted. This study aimed to evaluate the GM alterations in relapsing-remitting MS (RRMS) and NMOSD using diffusion tensor imaging (DTI), neurite orientation dispersion and density imaging (NODDI), and synthetic quantitative MRI (qMRI). The use of NODDI (intracellular volume fraction [ICVF], orientation dispersion index [ODI], and isotropic volume fraction [ISO]) parameters and synthetic myelin volume fraction [MVF] have been shown to overcome the non-specificity of DTI by quantifying neurites density and geometric complexity, extracellular free-water, and myelin contents, respectively.2, 3METHODS
Forty RRMS patients, 17 NMOSD patients (all anti-aquaporin-4 antibody-positive), and 21 healthy controls (HC) were enrolled (Table 1). Each participant underwent 2-shell diffusion MRI, 2D axial qMRI, and 3D T1-WI) on a 3T scanner (Discovery MR750w; GE Healthcare, Milwaukee, Wisconsin, USA) with a 19-channel head coil. Table 2 shows the acquisition parameters. Fractional anisotropy (FA) and mean diffusivity (MD) maps were computed using diffusion data with b-values of 0 and 1000 s/mm2 by fitting a tensor model. A NODDI model3 was applied to the whole 2-shell diffusion data to produce ICVF, ODI, and ISO maps. The qMRI data were processed by SyMRI software version 11.0.7 (SyntheticMR, Sweden) to produce MVF map.4 GM-based spatial statistics (GBSS)5 analysis in FSL was applied to evaluate the effect of group (HC vs. RRMS vs. NMOSD) and disease duration or clinical scores-MRI metrics interaction on each group. The anatomic locations of regions with significant group differences were identified from the Desikan-Killiany atlas. The measurements of cerebral cortical thickness and subcortical and cerebellar cortex volumes were performed with FreeSurfer pipeline by using 3D T1-WI. Then, the group differences were assessed using Kruskal-Wallis test followed by false discovery rate (FDR) correction and Mann-Whitney U tests to detect significant main effects on any area with significant FDR-corrected P-values. The threshold of statistical significance for all analyses was set at P < 0.05.RESULTS
RRMS patients had significantly (P < 0.05, family wise error-corrected) lower FA, ICVF, and MVF and higher MD, ODI, and ISO compared with HC and lower FA and MVF and higher MD and ISO compared with NMOSD patients (Fig. 1, Table 3). The changes of MVF and ICVF were seen predominantly in the limbic and para-limbic regions with clear sparing of cerebellum; the differences were more pronounced in MVF compared to ICVF. In contrast, the changes of FA, ODI, and ISO were largely demonstrated in the cerebellum and the changes of MD were shown predominantly in the limbic and para-limbic regions and cerebellum. NMOSD patients showed lower ICVF and higher MD and ISO in very limited areas of the GM (limbic and para-limbic and middle orbitofrontal, respectively; Fig. 1, Table 3). Positive correlations were demonstrated between ODI and ISO mainly in the cerebellum of RRMS patients (Fig. 2). There were no significant differences of cortical thickness and subcortical and cerebellar cortex volumes between groups.DISCUSSION
In RRMS patients, demyelination and axonal loss (indicated by decrease in MVF and ICVF, respectively) were predominantly demonstrated in the limbic and para-limbic areas. As reported in previous histopathological and neuroimaging studies, the limbic system seems to be more susceptible than other GM regions in MS.6, 7 Unlike the widespread MVF changes, the changes of ICVF were identified in more limited GM areas. Apart from demyelination, axonal damage was found to be subtle in the GM and progressed slower during disease evolution.8, 9 Interestingly, as shown in this study, the topological patterns of demyelination/axonal loss and neuroinflammation in the GM of RRMS patients were different. Increased ODI and ISO, which reflect increased microglia density10 and extracellular free-water,3 respectively, were observed mainly in the cerebellum. Altogether, these findings might suggest neuroinflammation in the cerebellum.10, 11 This hypothesis is reinforced by the fact that ODI and ISO positively correlated with disease duration. Indeed, a widespread neuroinflammation of the cerebellum in MS patients is evidenced in recent PET study.12 Also, a previous study did not observe any association between meningeal inflammation and cortical demyelinated lesions.13 Brain atrophy increases the possibility of partial volume effect from the CSF that consequently increases the ISO. However, the cerebellar cortex volume was not different between groups. In contrast to RRMS, NMOSD patients demonstrated only minimal GM changes (axonal loss in the cingulate and neuroinflammation in the frontal areas) when compared with HC. The brain is widely recognized to be relatively spared in NMOSD. The absence of GM abnormalities has also been reported in NMOSD.14-17CONCLUSION
Multimodal neuroimaging techniques of the GM might be useful for differentiating patients with NMOSD from RRMS, where NMOSD spares most of the GM. Our findings also demonstrated different topology of pathologies in RRMS; extensive demyelination and circumscribed axonal loss predominantly in the limbic and para-limbic areas with clear sparing of cerebellum, and broad neuroinflammation in the cerebellum.Acknowledgements
All authors report no conflict of interest.References
- Kawachi I, Nishizawa M. Significance of gray matter brain lesions in multiple sclerosis and neuromyelitis optica. Neuropathology 2015;35:481-6
- Warntjes JBM, Persson A, Berge J, et al. Myelin Detection Using Rapid Quantitative MR Imaging Correlated to Macroscopically Registered Luxol Fast Blue-Stained Brain Specimens. AJNR Am J Neuroradiol 2017;38(6):1096-1102
- Zhang H, Schneider T, Wheeler-Kingshott CA, et al. NODDI: practical in vivo neurite orientation dispersion and density imaging of the human brain. Neuroimage 2012;61:1000-16
- Daducci A, Canales-Rodriguez EJ, Zhang H, et al. Accelerated Microstructure Imaging via Convex Optimization (AMICO) from diffusion MRI data. Neuroimage 2015;105:32-44
- Smith SM, Jenkinson M, Johansen-Berg H, et al. Tract-based spatial statistics: voxelwise analysis of multi-subject diffusion data. Neuroimage 2006;31:1487-505
- Bo L, Vedeler CA, Nyland HI, et al. Subpial demyelination in the cerebral cortex of multiple sclerosis patients. J Neuropathol Exp Neurol 2003;62:723-32
- Andica C, Hagiwara A, Kamagata K, et al. Gray Matter Alterations in Early and Late Relapsing-Remitting Multiple Sclerosis Evaluated with Synthetic Quantitative Magnetic Resonance Imaging. Sci Rep 2019;9:8147
- Klaver R, De Vries HE, Schenk GJ, et al. Grey matter damage in multiple sclerosis: a pathology perspective. Prion 2013;7:66-75
- Stadelmann C, Wegner C, Bruck W. Inflammation, demyelination, and degeneration - recent insights from MS pathology. Biochim Biophys Acta 2011;1812:275-82
- Yi SY, Barnett BR, Torres-Velazquez M, et al. Detecting Microglial Density With Quantitative Multi-Compartment Diffusion MRI. Front Neurosci 2019;13:81
- Wang N, Zhang J, Cofer G, et al. Neurite orientation dispersion and density imaging of mouse brain microstructure. Brain Struct Funct 2019
- Barletta VT, Herranz E, Treaba CA, et al. Evidence of diffuse cerebellar neuroinflammation in multiple sclerosis by (11)C-PBR28 MR-PET. Mult Scler 2019:1352458519843048
- Kooi EJ, Geurts JJ, van Horssen J, et al. Meningeal inflammation is not associated with cortical demyelination in chronic multiple sclerosis. J Neuropathol Exp Neurol 2009;68:1021-8
- Calabrese M, Oh MS, Favaretto A, et al. No MRI evidence of cortical lesions in neuromyelitis optica. Neurology 2012;79:1671-6
- Finke C, Heine J, Pache F, et al. Normal volumes and microstructural integrity of deep gray matter structures in AQP4+ NMOSD. Neurol Neuroimmunol Neuroinflamm 2016;3:e229
- Matthews L, Kolind S, Brazier A, et al. Imaging Surrogates of Disease Activity in Neuromyelitis Optica Allow Distinction from Multiple Sclerosis. PLoS One 2015;10:e0137715
- Sinnecker T, Dorr J, Pfueller CF, et al. Distinct lesion morphology at 7-T MRI differentiates neuromyelitis optica from multiple sclerosis. Neurology 2012;79:708-14
Figures
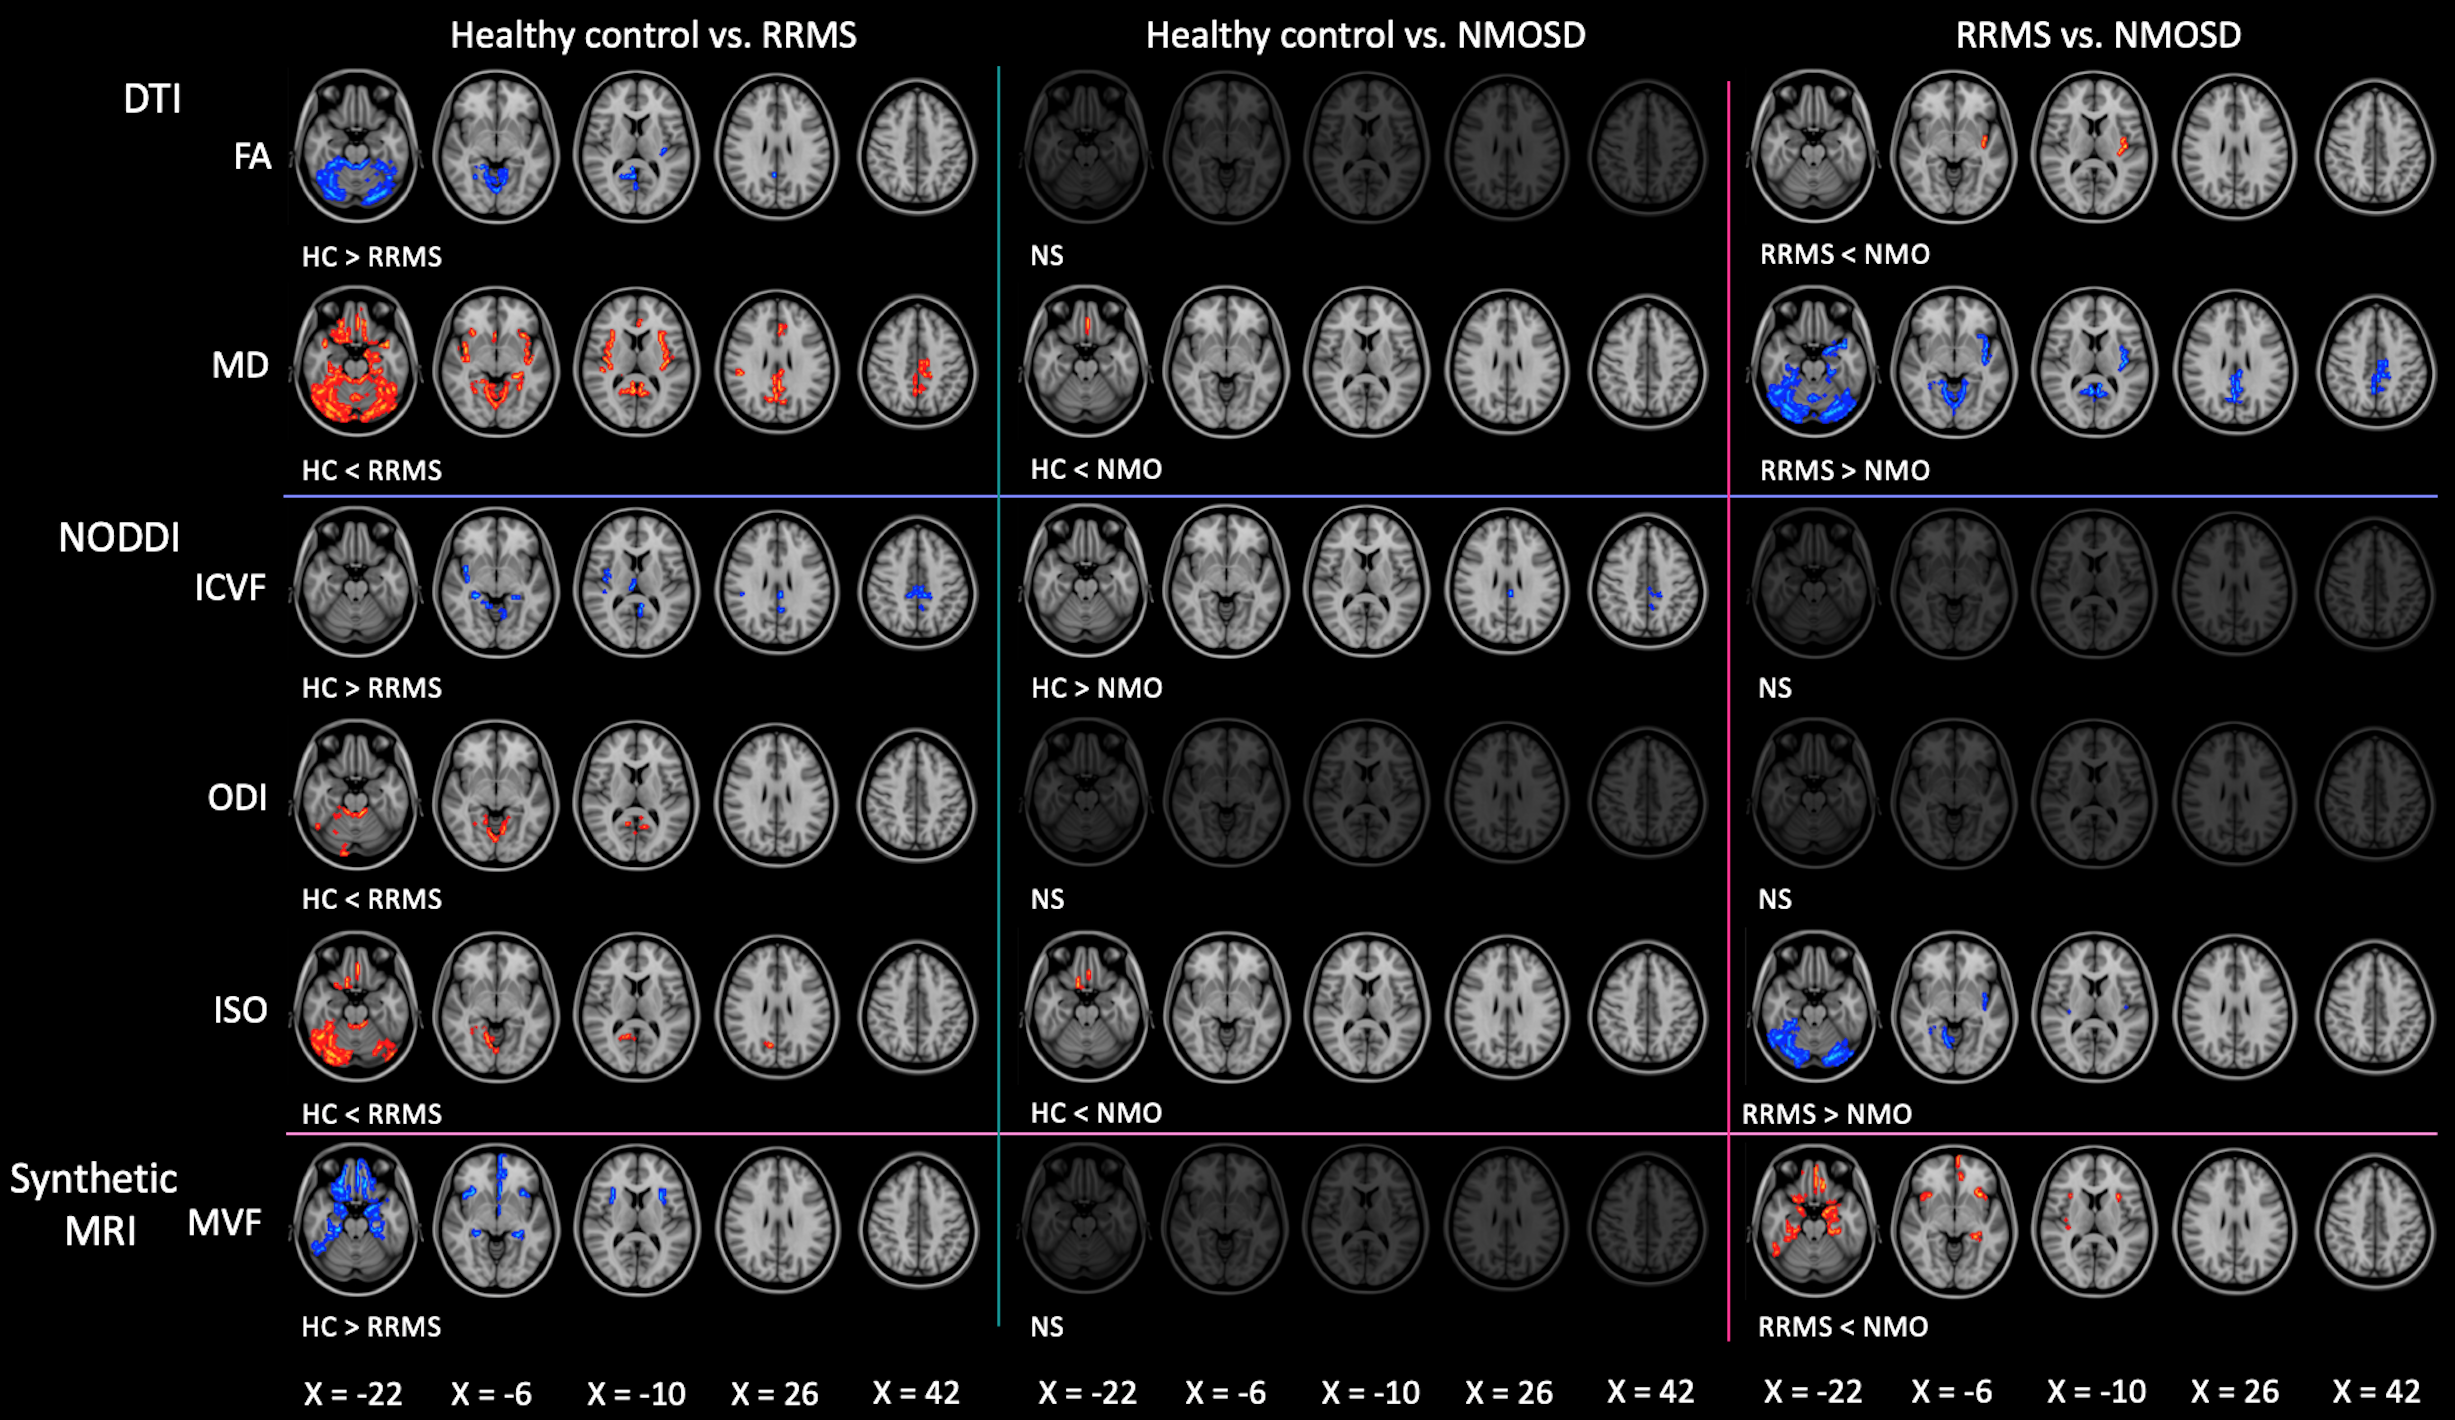
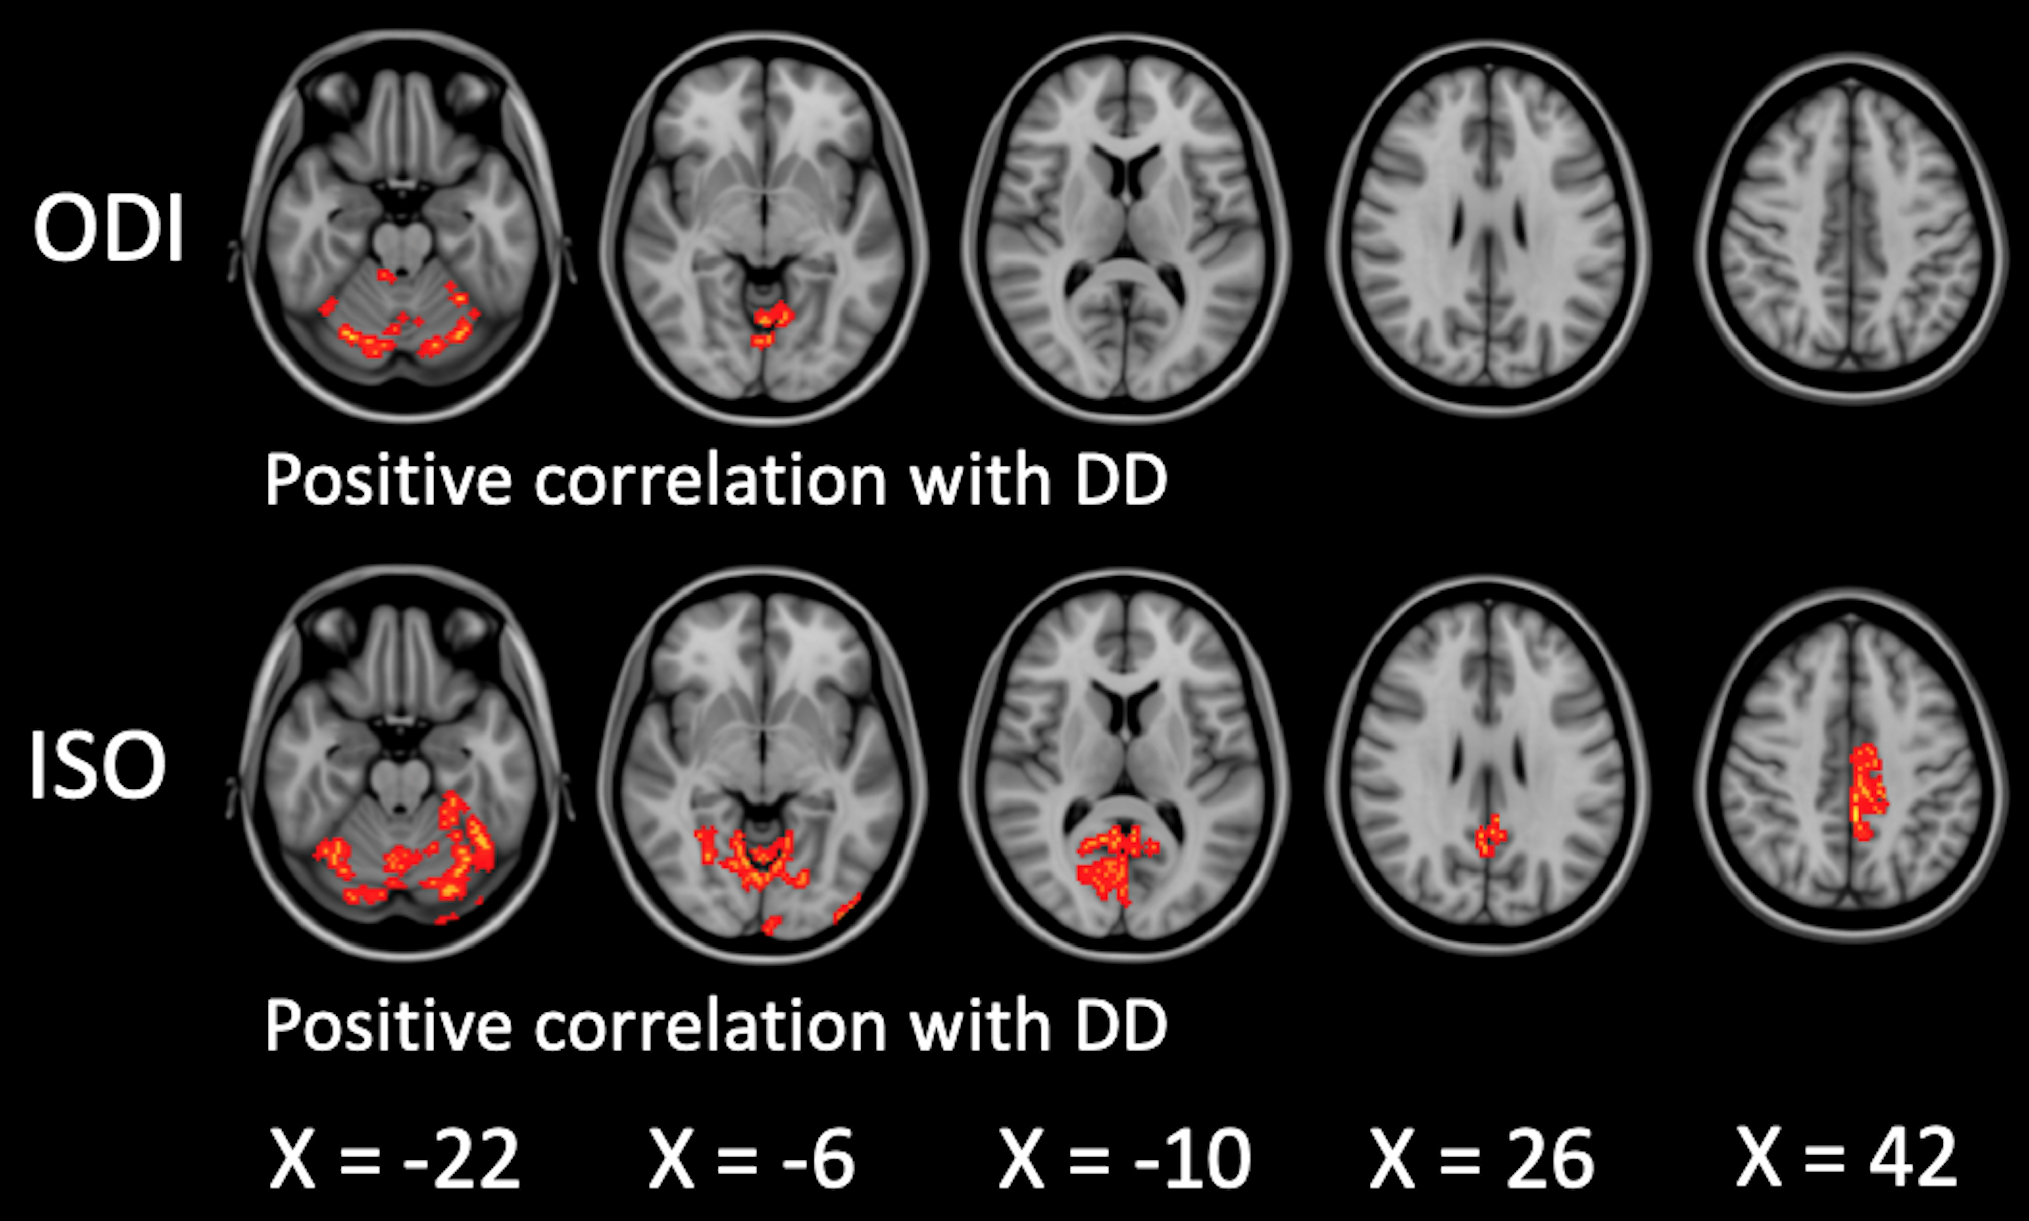
Figure 2. Correlation between ODI and ISO and disease duration in RRMS patients. Disease duration-MRI metrics interaction analysis was performed with age and sex as covariates using a general linear model in the FSL randomise tool with 5,000 permutations and statistical inference by applying threshold-free cluster enhancement. To aid visualization, the results (family-wise error corrected P < 0.05) are thickened using the fill script implemented in the FMRIB software library.
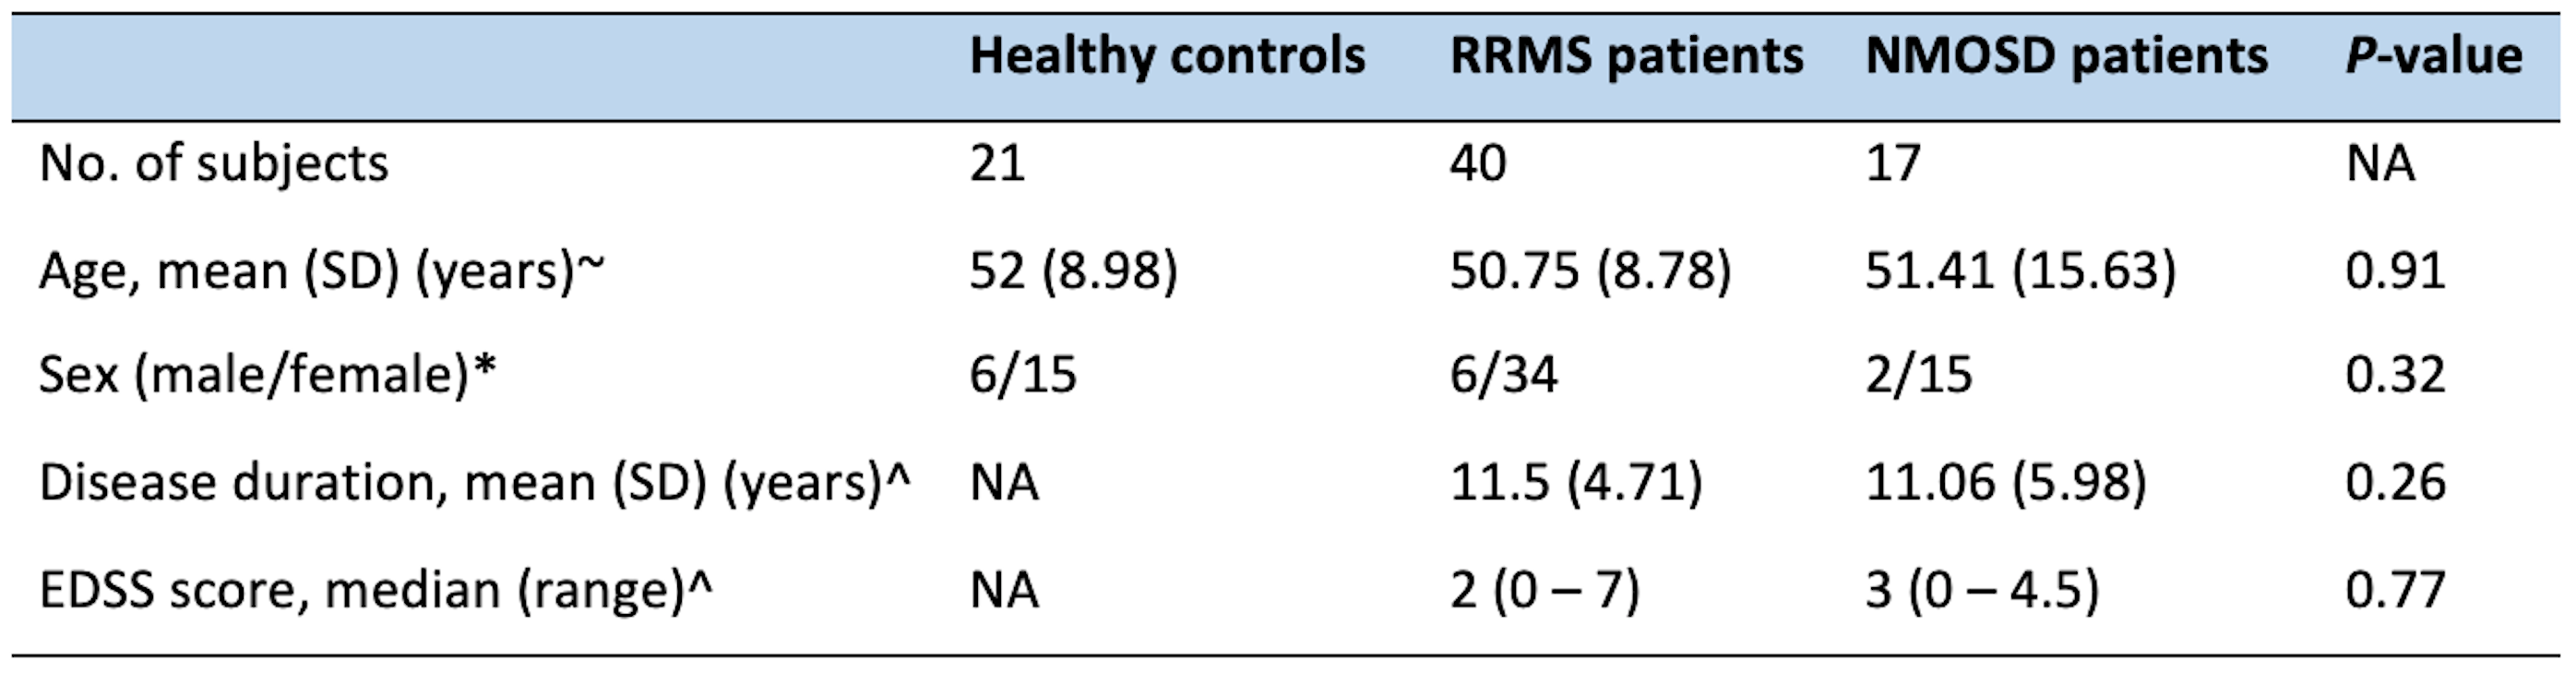
Table 1. Demographic characteristics of the participants
Abbreviations: EDSS, expanded disability status scale; SD, standard deviation. Note: the statistical analyses were performed with one-way analysis of variance (ANOVA)~, χ2test*, and unpaired t-test^.
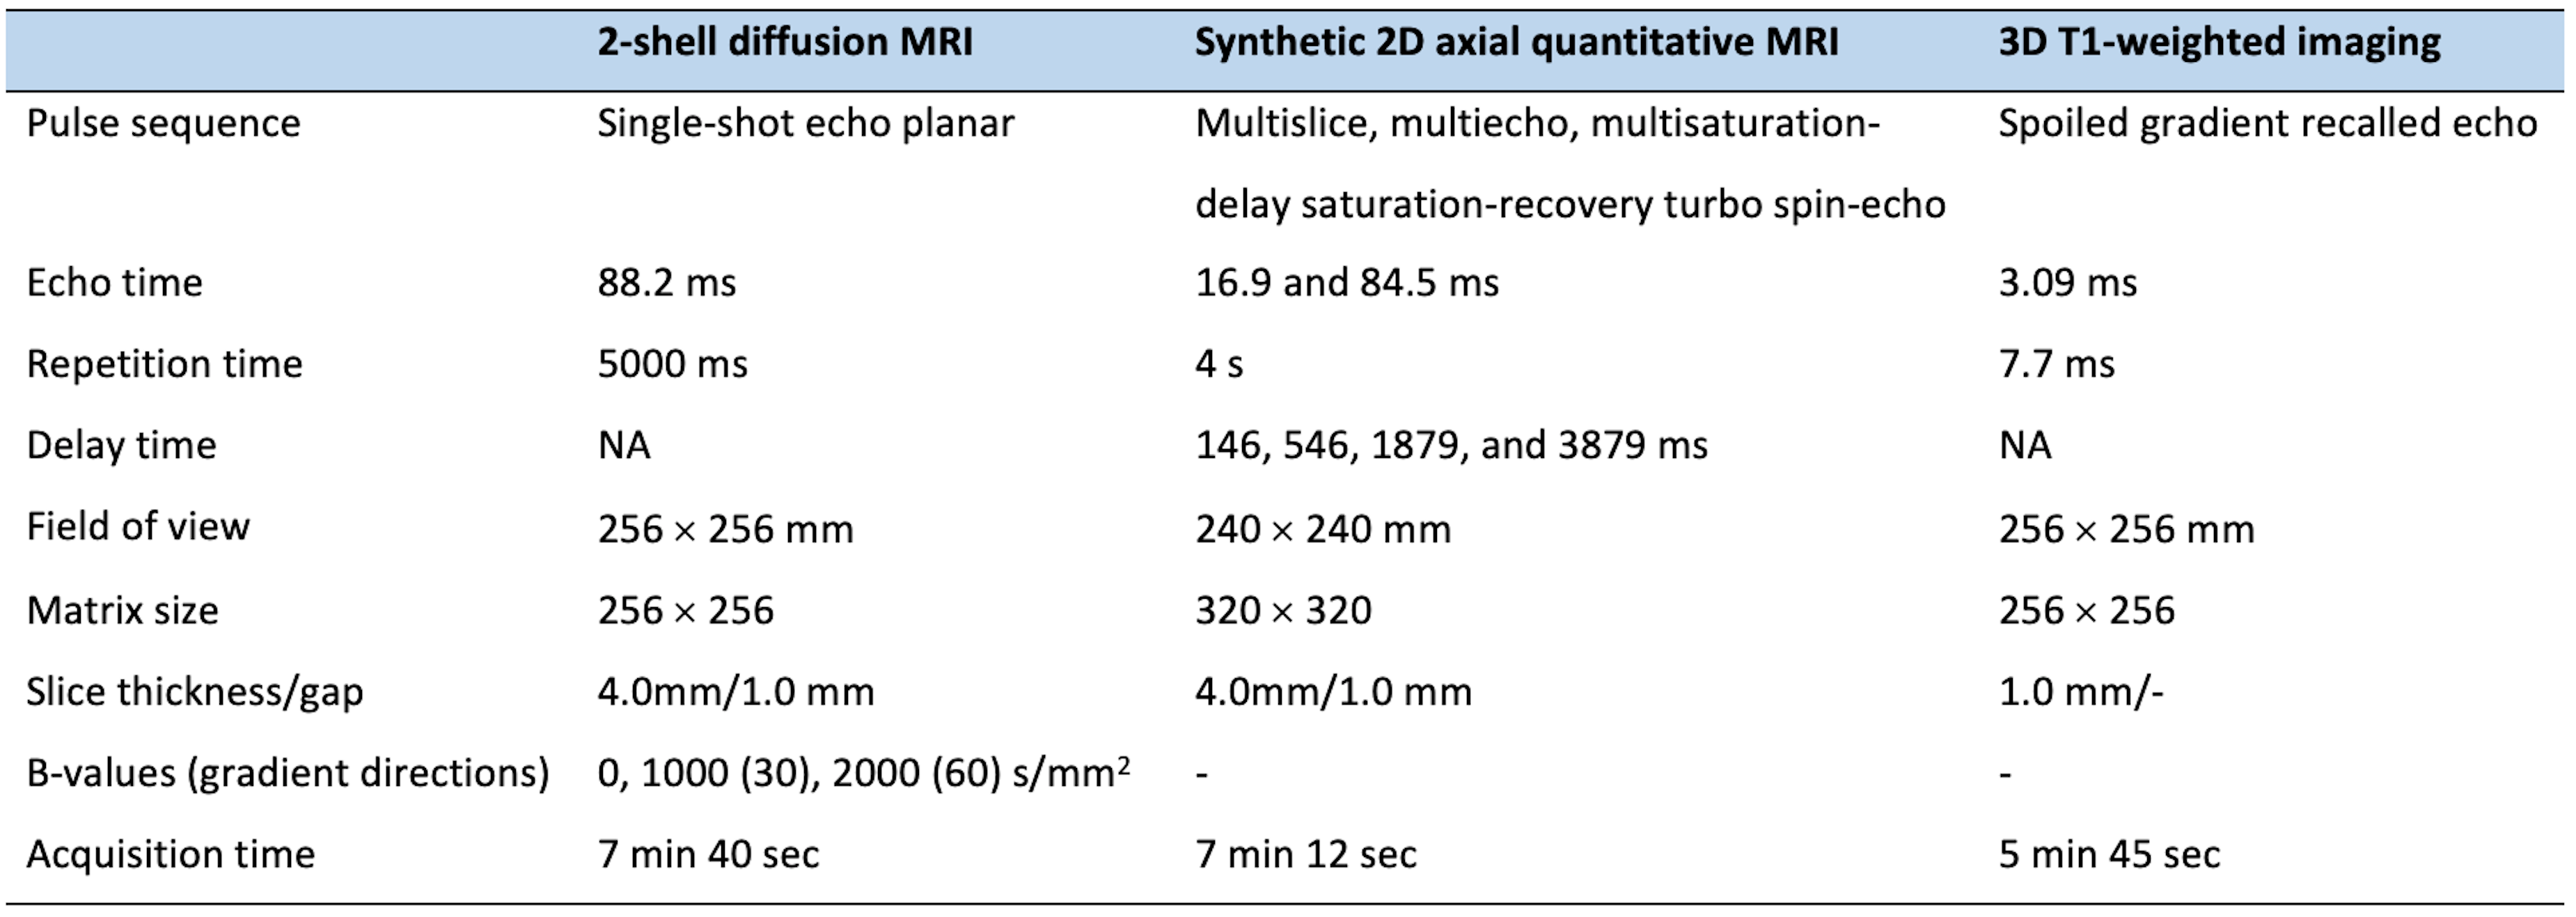
Table 2. Acquisition parameters of 2-shell diffusion MRI, 2D axial synthetic quantitative MRI, and 3D T1-weighted imaging

Table 3. GBSS analysis of MVF, ICVF, ODI, and ISO in RRMS patients compared to healthy controls and NMOSD patients and in NMOSD patients compared to healthy controls
Abbreviations: Lt, Left; Rt, Right; LOF, Lateral Orbitofrontal; MOF, Medio Orbitofrontal; RAC, Rostral Anterior Cingulate; ROF, Rostral Middle Frontal.