1374
Structural and functional characteristics in neuromyelitis optica spectrum disorders and multiple sclerosis1Department of Radiology, Beijing Tiantan Hospital, Beijing, China, 2Department of Neurology, Tianjin Medical University General Hospital, Tianjin, China, 3Department of Neurology, Beijing Tiantan Hospital, Beijing, China, 4Department of Radiology, the First Affiliated Hospital of Chongqing Medical University, Chongqing, China, 5Department of Radiology, The First Affiliated Hospital of Nanchang University, Nanchang, China, 6Center for Studies of Psychological Application, South China Normal University, Guangzhou, China, 7Clinical Application, Philips Healthcare, Beijing, China, 8Clinical Science, Philips Healthcare, Guangzhou, China, 9China National Clinical Research Center for Neurological Diseases, Beijing, China
Synopsis
We
investigated structural and functional alterations in neuromyelitis optica
spectrum disorders (NMOSD) and multiple sclerosis (MS) and examine their
clinical relevance using multimodal MRI techniques.
Introduction
Neuromyelitis optica spectrum disorder (NMOSD) and multiple sclerosis (MS) are the two major inflammatory demyelinating diseases of the central nervous system. Clinically differentiating these two diseases and identifying different objective imaging biomarkers for differential diagnosis and clinical trials for NMOSD and MS are essential since they have distinct pathological basis, treatment strategy and prognosis. A large multicenter study with multimodality MRI were required to discover and validate clinical useful MRI biomarkers for NMOSD and MS. The objective of this retrospective multi-center study is to investigate structural and functional alterations in neuromyelitis optica spectrum disorders (NMOSD) and multiple sclerosis (MS) and examine their clinical relevance using multimodal MRI techniques.Methods
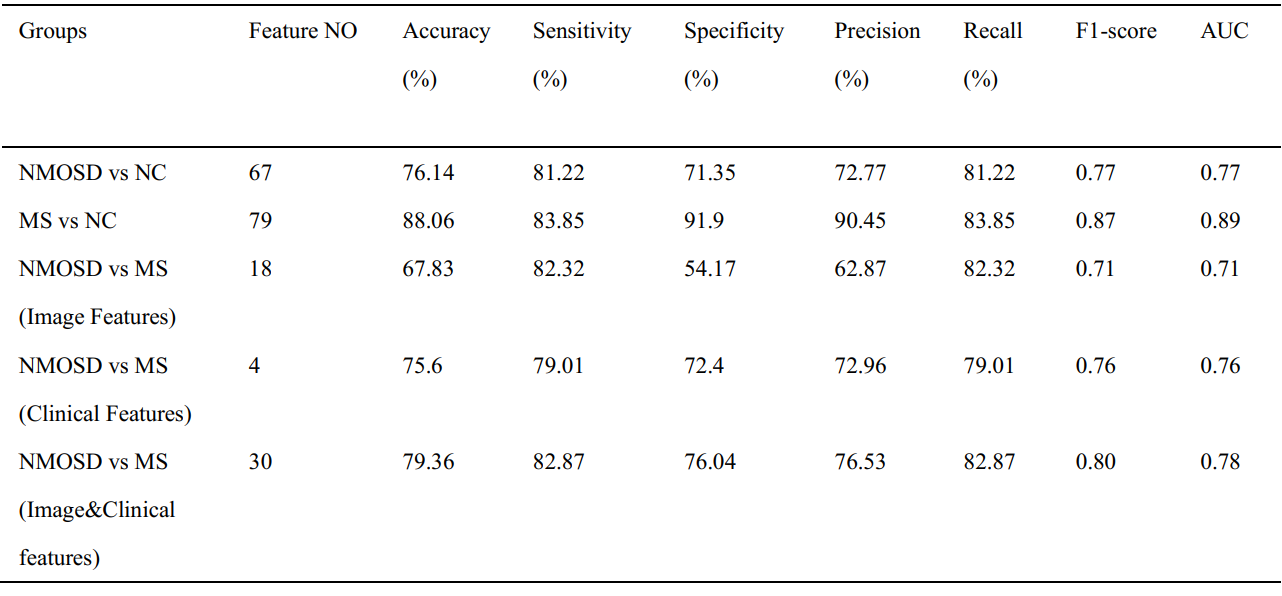
236 NMOSD, 236 MS and 280 normal controls (NCs) were recruited in this study and scanned by structural, diffusion tensor and resting-state functional magnetic resonance imaging (MRI). Hyperintensity white matter (WM) lesions were manually outlined and WM lesion probability maps were created. WM MRI measurement contains white matter volumes, fractional anisotropy (FA), mean diffusivity (MD) and radial diffusivity (RD) at whole brain and regional level. Grey matter (GM) MRI measurements including morphological features (cortical thickness, cortical and subcortical GM volumes) and functional features (amplitude of low frequency fluctuation (ALFF), fractional ALFF (fALFF), regional homogeneity (ReHo), Degree Centrality (DC)) were obtained at whole brain and regional level. The volume of ventricles and cerebrospinal fluid (CSF) were also obtained. Between-group differences, cross-modality relationships and MRI-clinical correlations were examined. Additionally, the classification between NMOSD and MS were performed using Receiver Operative Curve (ROC) and Support Vector Machine (SVM).Results
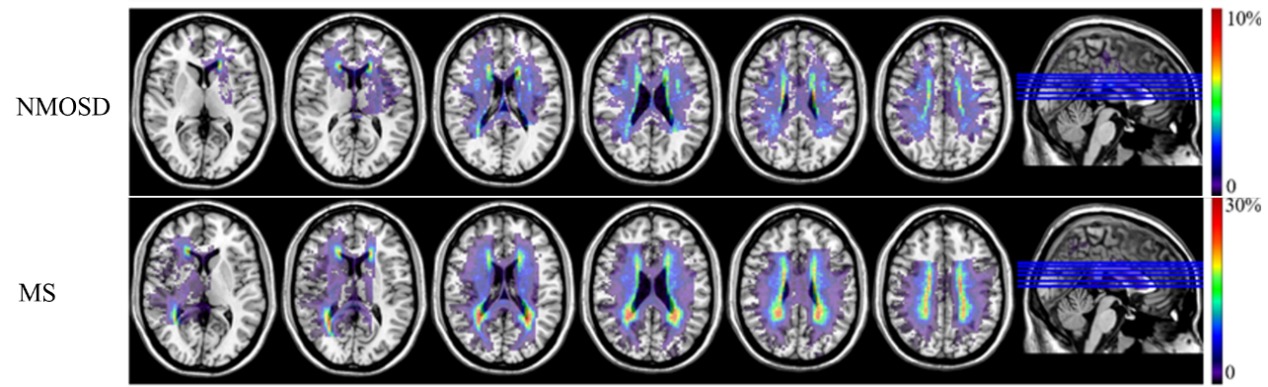
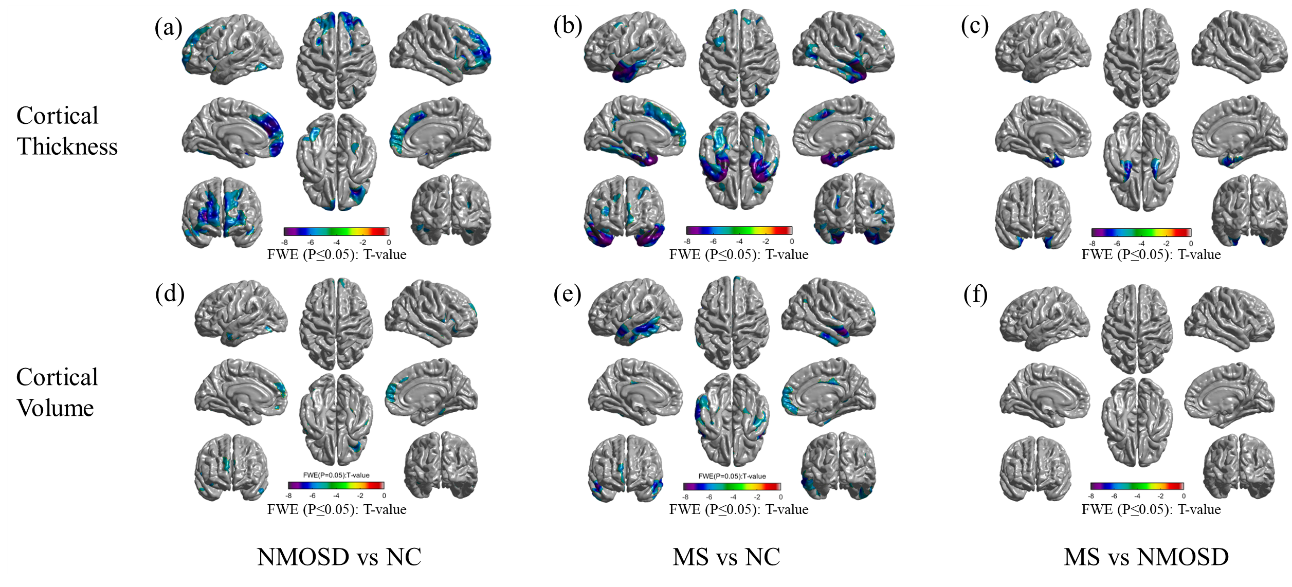
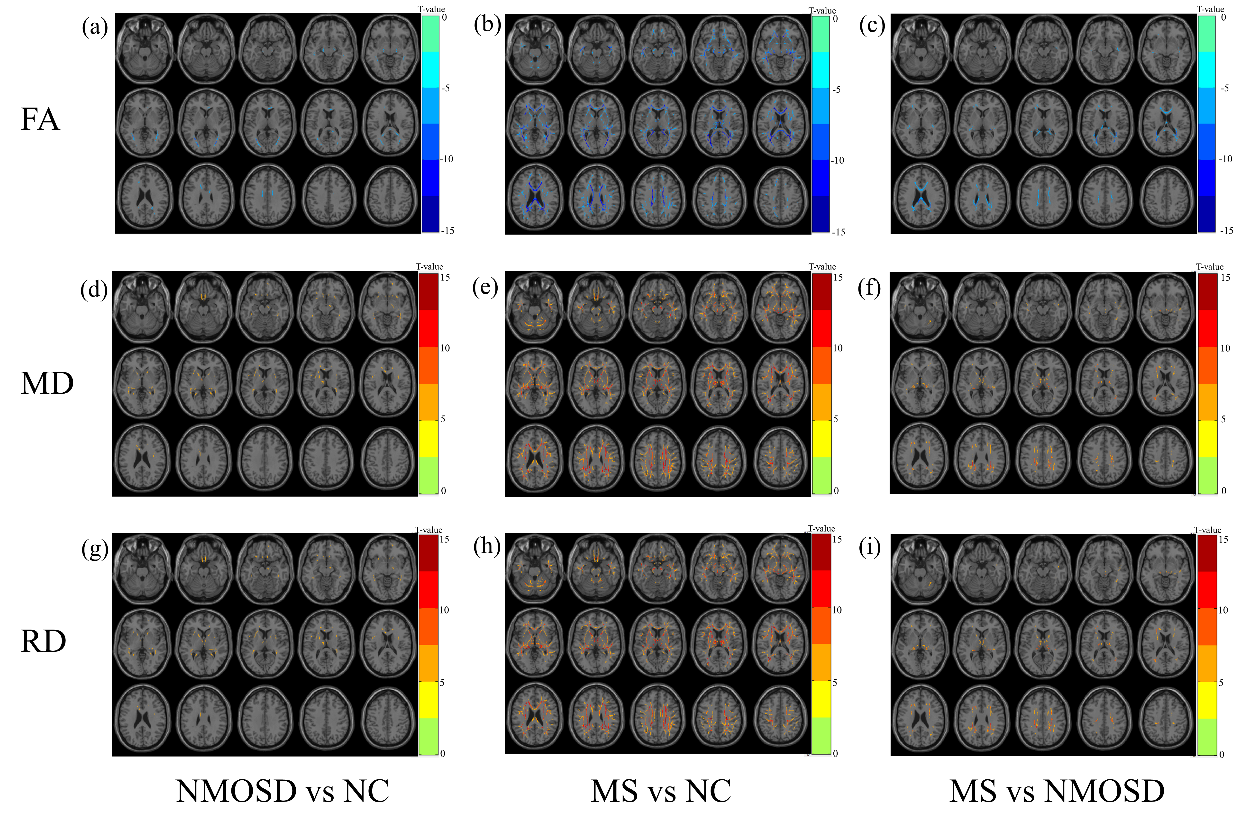
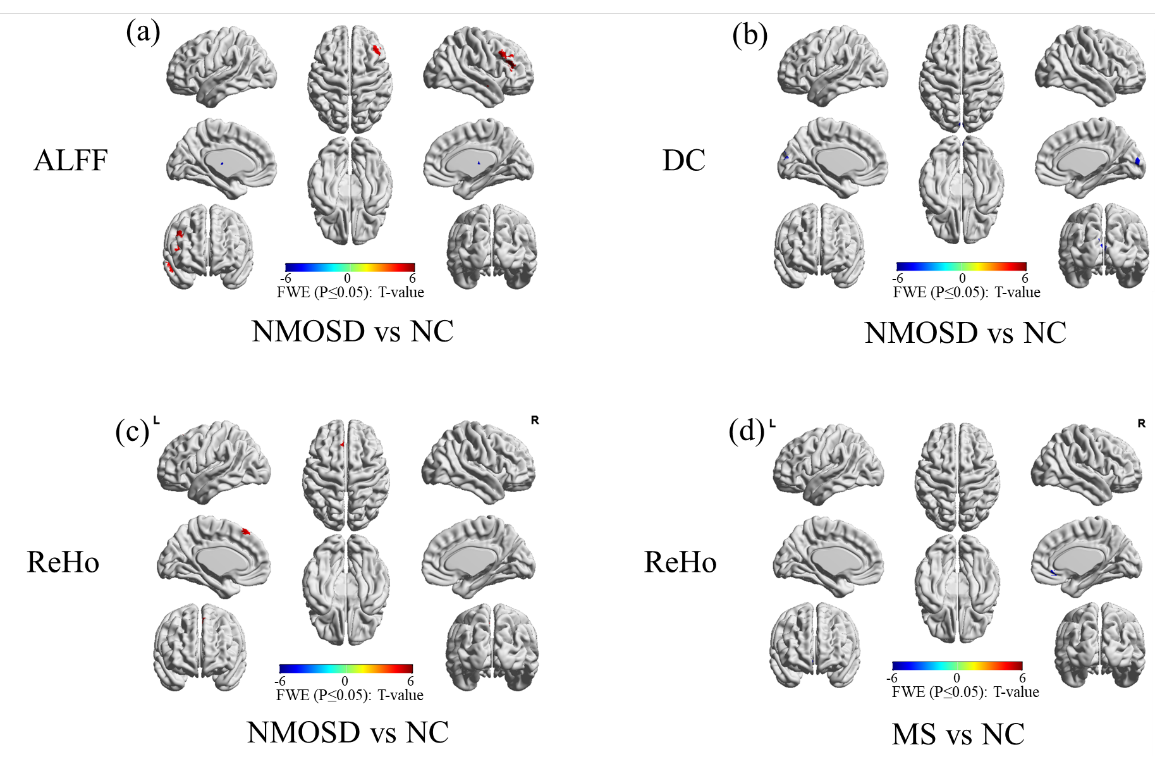
Both NMOSD and MS showed WM lesions distributing in periventricular regions. NMOSD showed WM fiber disruption located in optic radiation, corpus callosum and cerebral peduncle but showed no significant WM volume loss, while MS showed a widespread WM fiber disruption and volume loss especially locating in periventricular, deep and juxtacortical WM regions. Compared to NMOSD, MS showed severe fiber disruption in bilateral posterior thalamic radiation (including optic radiation), corpus callosum, bilateral anterior and posterior corona radiata and fornix. Both NMOSD and MS showed cortical atrophy in frontal, temporal, occipital and cingulate cortex and subcortical GM atrophy especially in thalamus. MS showed a more severe GM atrophy than NMOSD at whole brain and regional level, the major difference located in temporal lobe and subcortical GM (e.g. thalamus, hippocampus and caudate). NMOSD showed decreased ALFF in bilateral thalamus and DC in left cuneus and calcarine, but presented increased ALFF in right middle frontal and right middle temporal lobe and increased ReHo in left superior medial frontal lobe. MS showed decreased ReHoin right medial frontal orbital parts and anterior cingulate. Correlation analyses demonstrated that several structural and functional measurements showed correlations with disease duration and lesion volumes in NMOSD but a large proportion of structural and functional measurements showed significant correlations with disease duration and lesion volumes in MS. Both NMOSD and MS presented few significant correlations between the above measurements and Extended Disability Status Scale (EDSS). The ROC analyses showed moderate classification efficiency (maximum areas under the curve approximate 0.70) of the above measurements for the differential diagnosis of NMOSD and MS. The classification of NMOSD and MS based on SVM achieved an accuracy of 79.36%, sensitivity of 82.87% and specificity of 76.04% by combing the structural and functional measurements and clinical features.Discussion
The different structural and functional alterations of NMOSD and MS result from the different pathological process. MS showed more widespread WM fiber disruptions than NMOSD even in the normal appearing WM, which was due to both the direct inflammatory demyelination and alterations secondary to the axonal transection of fibers passing through the WM lesions. The MS showed more GM atrophy than NMOSD which was consistent with previous works that elucidated a serve cortical thinning in MS than NMOSD1. But the NMOSD and MS presented similar GM alteration distribution which related to the frontal, temporal, occipital, precentral and subcortical GM (e.g. thalamus). The GM alteration in these brain regions might be account for the clinical symptoms such as the visual function, emotion, executive function, motor function, and cognition impairment. The significant atrophy of temporal lobe in MS is associated with memory impairment in patients with MS2,3. Due to the different structural alterations of NMOSD and MS especially in WM. They showed different functional alterations, the NMOSD showed decreased function in the visual pathway (thalamus and left cuneus and calcarine), but the MS showed decreased function in right medial frontal orbital parts and anterior cingulate which related to the executive function, information processing speed and cognition impairment4. The associations between the MRI features with disease duration, lesion volume and EDSS indicated that these MRI features could be used as potential biomarkers for monitoring disease development and disability. The SVM classification results proved that the MRI features could contribute to clinical differential diagnosis of NMOSD and MS.Conclusion
Distinct patterns of structural and functional alterations were observed between NMOSD and MS. These patterns can be promising biomarkers for differential diagnosis, monitoring disease development and disability.Acknowledgements
References
1. Kim SH, Kwak K, Hyun JW, et al. widespread cortical thinning in patients with neuromyelitis optica spectrum disorder. European Journal of Neurology. 2016; 23: 1165-1173.
2. Benedict RH, Zivadinov R, Carone DA, et al. Regional lobar atrophy predicts memory impairment in multiple sclerosis. AJNR Am J Neuroradiol 2005; 26: 1824-1831.
3. Liu Y, Xie T, He Y, et al. Cortical thinning correlates with cognitive change in multiple sclerosis but not in neuromyelitis optica. Eur Radiol. 2014; 24: 2334-2343.
4. DeLuca GC, Yates RL, Beale H, et al. Cognitive impairment in multiple sclerosis: clinical, radiologic and pathologic insights. Brain Pathol. 2015; 25: 79–98.
Figures