1372
Differentiation of Multiple Sclerosis and Neuromyelitis Optica Spectrum Disorders by Convolutional Neural Network1Radiology, Juntendo University School of Medicine, Tokyo, Japan, 2Radiology, UCLA, Los Angeles, CA, United States, 3Milliman Inc., Tokyo, Japan, 4Radiology, Graduate School of Medicine, The University of Tokyo, Tokyo, Japan, 5Neurology, Juntendo University School of Medicine, Tokyo, Japan, 6Radiology, Toho University, Tokyo, Japan, 7Radiological Sciences, Graduate School of Human Health Sciences, Tokyo Metropolitan University, Tokyo, Japan
Synopsis
Multiple sclerosis (MS) and neuromyelitis optica spectrum disorders (NMOSD) are both neuroinflammatory diseases and have overlapping clinical manifestations. We developed a convolutional neural network that differentiates between MS and NMOSD based on multi-dynamic multi-echo sequence that measures R1 and R2 relaxation times and proton density. To avoid overfitting on a small dataset, we aimed to separate features of images into those specific to an image and those common to the group (i.e. MS or NMOSD) based on SqueezeNet. We used only common features for classification. Our model achieved a diagnostic accuracy of 80.7%.
INTRODUCTION
Multiple sclerosis (MS) and neuromyelitis optica spectrum disorders (NMOSD) are both neuroinflammatory diseases and have overlapping clinical manifestations, making these disorders difficult to distinguish.1 Distinguishing these diseases are clinically important because treatment options and prognosis differ. Quantitative MRI, such as simultaneous relaxometry of R1 and R2 relaxation rates, and proton density by multi-dynamic multi-echo (MDME) sequence,2 has the potential to objectively distinguish these diseases because previous reports using relaxometry have reported different degrees of cerebral damages in these diseases.3, 4 However, automatic analysis method of quantitative MRI been fully established. Convolutional neural network (CNN) has been developed for fully-automated image feature extraction and classification, but has not been utilized for differentiation of these diseases. Herein, we propose a CNN algorithm that differentiates between MS and NMOSD based on MDME data.METHODS
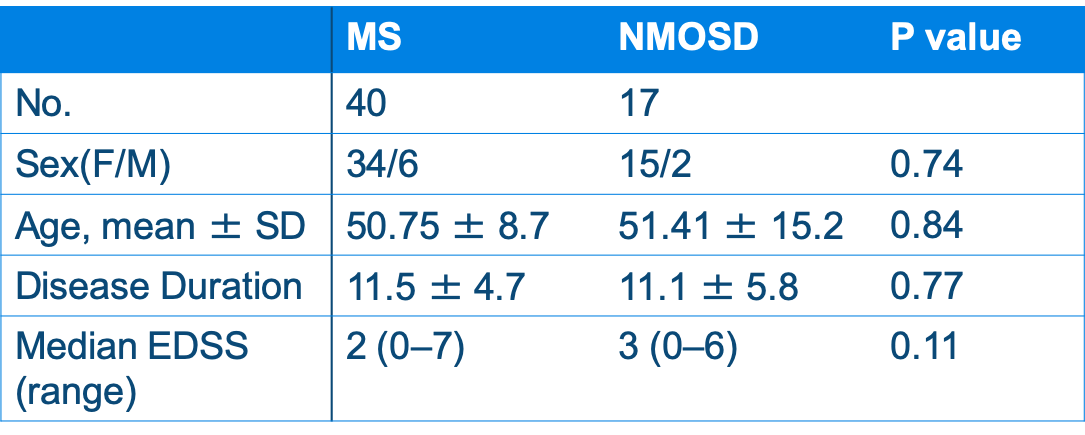
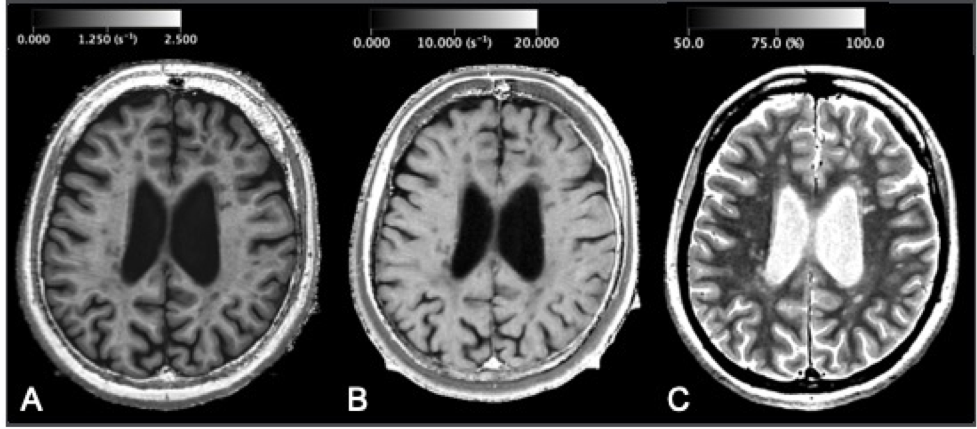
Participants and MRIForty patients with relapsing-remitting MS and 17 patients with anti-aquaporin-4 antibody positive NMOSD were included in this study. These groups were age-, sex-, and disease-duration-matched (Table 1). All the patients were scanned by a 2D axial MDME sequence5 on a 3T MR scanner (Discovery 750w, GE). MDME was performed with combinations of 2 TEs (16.9 and 84.5 ms) and 4 saturation-delay times (146, 546, 1879, and 3879 ms). The other parameters were as follows: TR = 4.0 seconds, FOV = 240 × 240 mm, matrix = 320 × 320, echo-train length = 10, bandwidth = 31.25 kHz, section thickness/gap = 4.0 mm/1.0 mm, slices = 30, and acquisition time = 7 minutes 12 seconds. The acquired data was processed by SyMRI software version 11.0.7 (SyntheticMR, Sweden) to produce R1, R2, and proton density maps (Fig 1), which were used for the following CNN training.
CNN Framework
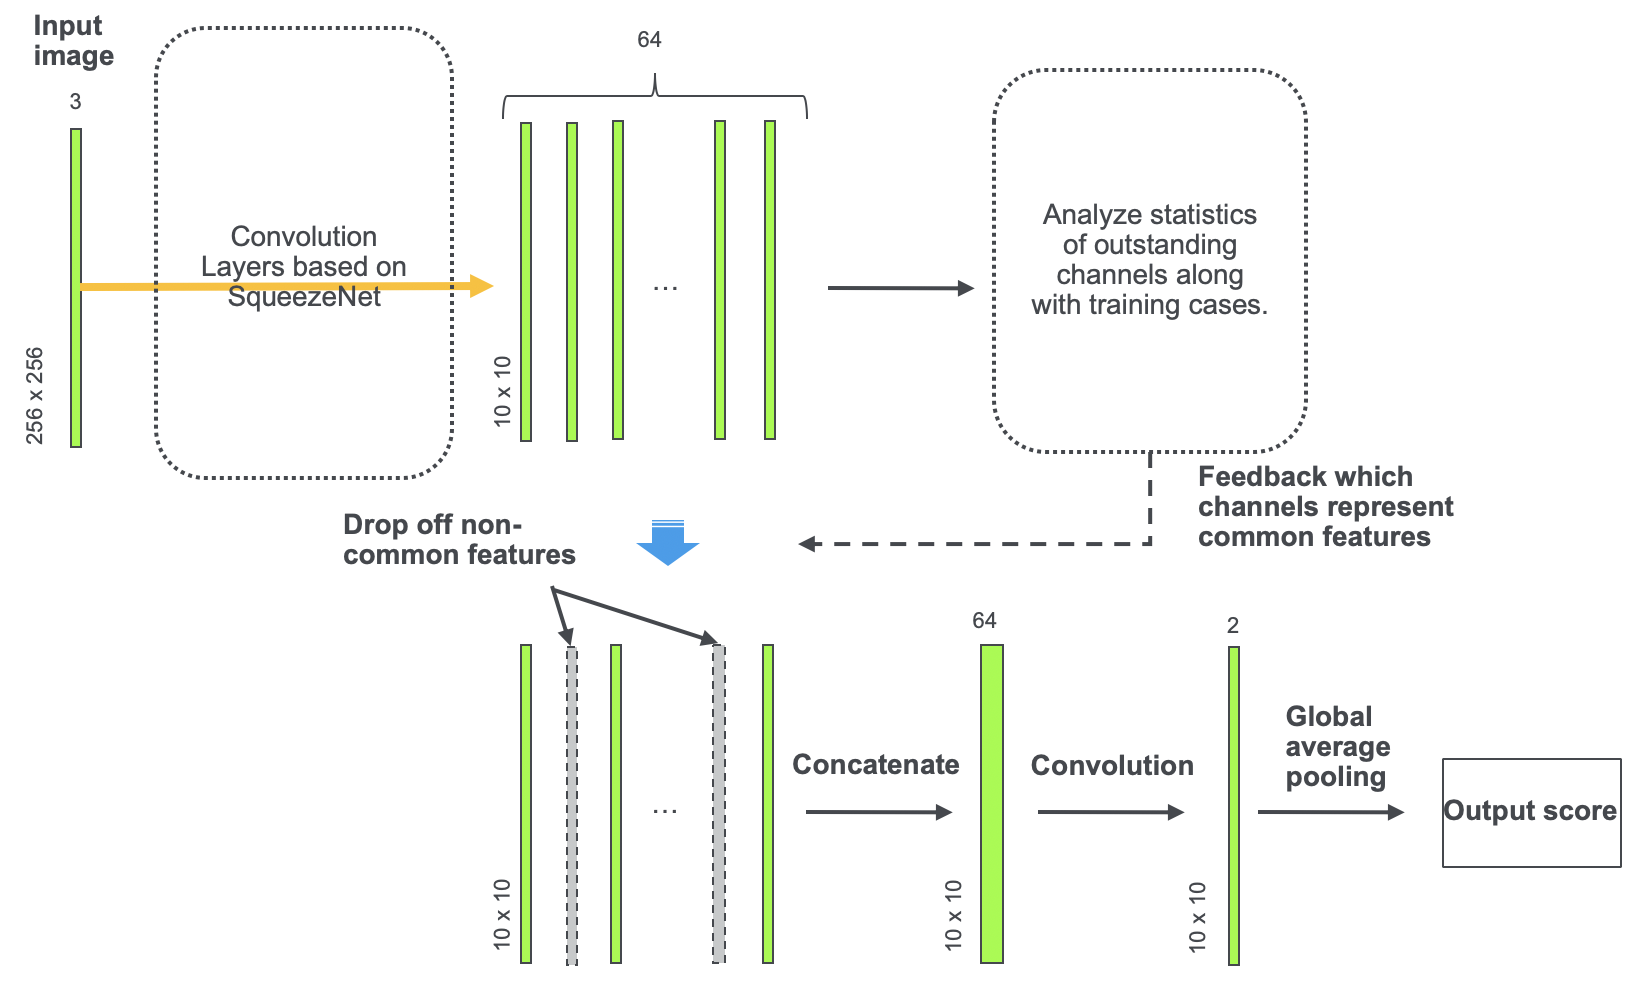
We designed a CNN framework based on SqueezeNet6 that can be performed with fewer parameters than previous CNN models for extracting features common to each labeled group to use for classification. The model design is illustrated in Fig 2. Because the training dataset was small, we designed the model to avoid overfitting. For this purpose, we aimed to separate features of images into those specific to an image and those common to the group (i.e. MS or NMOSD). The underlying idea is that fitting of a model to features specific to each image causes overfitting. We assumed that channels of the last convolutional layer represent features of the image, and the outstanding channels through the stack of images were considered as features of the patient. An outstanding channel was defined as a channel whose maximum exceeds 2 standard deviations of the maximum of the whole channels of the image. The outstanding channels common to at least two-thirds of each group and less than one-eighth of the other group were defined as common features of the group. We used only common features for classification of the patients. Since such common features’ channels change along with training epochs, the training model was constructed so that it evaluates and updates common features’ channels at each epoch. Classification was performed slice-wise, and the average of the output scores of the stack of images was considered to be the prediction of the patient. The training was stopped when the accuracy of prediction on the training data exceeded 0.98. The program was coded using Python 3.6 with Chainer 6.4.0. The model performance was evaluated by leave-one-out cross-validation for all 57 cases.
RESULTS
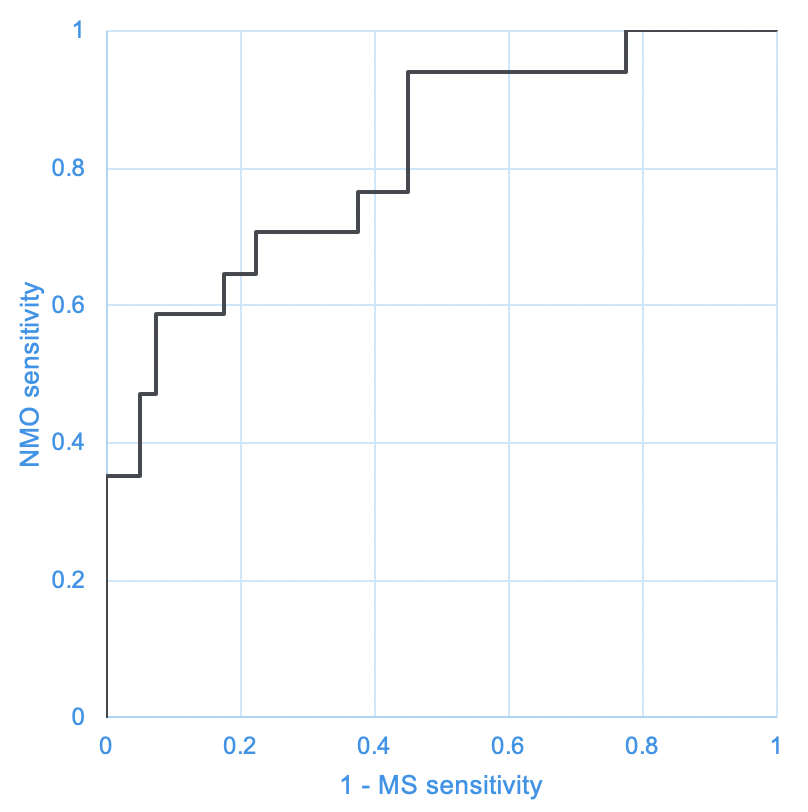
Fig 3 shows the receiver operating characteristic curve of the diagnostic ability of the developed CNN for MS and NMO. The area under the curve was 0.815. When the cutoff was set at the value where the sum of the sensitivity to MS and NMO was the highest, the sensitivity to MS and NMO was 77.5% and 70.6%, respectively. The accuracy was 80.7%.DISCUSSION
In the present study, we designed a CNN model to overcome the overfitting caused by the small number of training data. As a result, our proposed model achieved an accuracy of 80.7% for distinguishing between MS and NMO. It was slightly higher than a previous study that reported an accuracy of 80% using 3D T1-weighted and 3D FLAIR images as inputs of a random-forest algorithm.7 However, their algorithm requires feature extraction as pre-processing, which is difficult and time-consuming in a clinical setting. Our deep learning model automatically performs both feature extraction and classification. However, the generalizability of our model should be confirmed using a larger dataset in a future study. Further, we used only the MDME data in this study. A previous study that combined functional MRI and diffusion tensor imaging with T1-weighted and FLAIR images for a support vector machine algorithm achieved the accuracy of 88% in distinguishing MS and NMO,8 but these advanced MRI modalities are difficult to be incorporated into routine clinical scans. The MDME is now a clinical routine in some institutions because conventional contrast-weighted images can be created by synthetic MRI.2 Including other modalities that are clinically available, such as lumbar puncture results, antibody status, and quantitative spinal cord measures, may increase the performance of our algorithm.CONCLUSION
We developed a CNN model differentiating MS and NMO designed to avoid overfitting on a small number of training data.Acknowledgements
No acknowledgement found.References
1. Rosenthal JF, Hoffman BM, Tyor WR. CNS inflammatory demyelinating disorders: MS, NMOSD and MOG antibody associated disease. J Investig Med. 2019 [Epub ahead of print]
2. Hagiwara A, Warntjes M, Hori M, et al. SyMRI of the Brain: Rapid Quantification of Relaxation Rates and Proton Density, With Synthetic MRI, Automatic Brain Segmentation, and Myelin Measurement. Invest Radiol. 2017;52(10):647-657.
3. Pasquier B, Borisow N, Rasche L, et al. Quantitative 7T MRI does not detect occult brain damage in neuromyelitis optica. Neurol Neuroimmunol Neuroinflamm. 2019;6(3):e541.
4. Jeong IH, Choi JY, Kim SH, et al. Comparison of myelin water fraction values in periventricular white matter lesions between multiple sclerosis and neuromyelitis optica spectrum disorder. Mult Scler. 2016;22(12):1616-1620.
5. Warntjes JB, Leinhard OD, West J, et al. Rapid magnetic resonance quantification on the brain: Optimization for clinical usage. Magn Reson Med. 2008;60(2):320-329.
6. Iandola FN, Moskewicz MW, Ashraf K, et al. SqueezeNet: AlexNet-level accuracy with 50x fewer parameters and <0.5MB model size. arXiv:160207360. 2016
7. Eshaghi A, Wottschel V, Cortese R, et al. Gray matter MRI differentiates neuromyelitis optica from multiple sclerosis using random forest. Neurology. 2016;87(23):2463-2470.
8. Eshaghi A, Riyahi-Alam S, Saeedi R, et al. Classification algorithms with multi-modal data fusion could accurately distinguish neuromyelitis optica from multiple sclerosis. Neuroimage Clin. 2015;7:306-314.
Figures